Categories in Laç
Industries
Business Distribution by Industry in Laç
| Industry Description | Number of Establishments |
|---|---|
| Bars, pubs and taverns | 21 |
| Shopping | 19 |
| Department stores | 14 |
| Restaurants | 14 |
| Cafes | 11 |
| Car repair | 10 |
| Gas station | 10 |
| Education | 9 |
| Electronics stores | 8 |
| Travel agencies | 7 |
| Pizza | 7 |
| Clothing stores | 7 |
Laç Facts
| Area | 15.7 km² |
| Population | 15,430 |
| Male Population | 7,725 (50.1%) |
| Female Population | 7,705 (49.9%) |
| Population change (1975 to 2020) | +107.2% |
| Population change (2000 to 2020) | -17.8% |
| Median Age | 32.5 years (Male: 30.7, Female: 34.2) |
| Area Codes | 53 |
| Local Time | |
| Timezone | Central European Summer Time |
| Lat & Lng | 41.63556, 19.71306 |
| Postal Codes | 4604, 4701, 4702, 4703 |
Map of Laç
Interactive Map
Laç Population
Years 1975 to 2030
| Data | 1975 | 1990 | 2000 | 2015 | 2020 | 2025* | 2030* |
|---|---|---|---|---|---|---|---|
| Population | 7,446 | 19,130 | 18,777 | 15,515 | 15,430 | 13,523 | 11,719 |
| Population Density | 474.6 / km² | 1,219.4 / km² | 1,196.9 / km² | 989 / km² | 983.6 / km² | 862 / km² | 747 / km² |
Laç Population change from 2000 to 2020
Decrease of 17.8% from year 2000 to 2020
| Location | Change since 1975 | Change since 1990 | Change since 2000 |
|---|---|---|---|
| Laç | +107.2% | -19.3% | -17.8% |
| Lezhë County | — | — | — |
| Albania | — | — | — |
Laç Median Age
Median Age: 32.5 years
| Location | Median Age | Median Age (Female) | Median Age (Male) |
|---|---|---|---|
| Laç | 32.5 yrs | 34.2 yrs | 30.7 yrs |
| Lezhë County | 32.5 yrs | 34.2 yrs | 30.7 yrs |
| Albania | 33.6 yrs | 34.7 yrs | 32.3 yrs |
Laç Population Density
Population Density: 984 / km²
| Location | Population | Area | Density |
|---|---|---|---|
| Laç | 15,430 | 15.7 km² | 984 / km² |
| Lezhë County | 133,856 | 1,652.7 km² | 81 / km² |
| Albania | 2.9 million | 28,671.4 km² | 101 / km² |
Laç Historical and Projected Population
Estimated Population from 0 to 2100
- JRC (European Commission's Joint Research Centre) work on the GHS built-up grid
- CIESIN (Center for International Earth Science Information Network)
- [Link] Klein Goldewijk, K., Beusen, A., Doelman, J., and Stehfest, E.: Anthropogenic land use estimates for the Holocene – HYDE 3.2, Earth Syst. Sci. Data, 9, 927–953, https://doi.org/10.5194/essd-9-927-2017, 2017.
Area Codes
Percentage Area Codes used by businesses in Laç
Human Development Index (HDI)
Statistic composite index of life expectancy, education, and per capita income.
Laç CO2 Emissions
Carbon Dioxide (CO2) Emissions Per Capita in Tonnes Per Year
| Location | CO2 Emissions | CO2 Emissions Per Capita | CO2 Emissions Intensity |
|---|---|---|---|
| Laç | 38,678 tn | 2.51 tn | 2,465.5 tons/km² |
| Lezhë County | 319,565 tn | 2.39 tn | 193.4 tons/km² |
| Albania | 7,341,173 tn | 2.55 tn | 256 tons/km² |
| 2013 CO2 emissions (tonnes/year) | 38,678 tn |
| 2013 CO2 emissions (tonnes/year) per capita | 2.51 tn |
| 2013 CO2 emissions intensity (tonnes/km²/year) | 2,465.5 tons/km² |
Natural Hazards Risk
Relative risk out of 10
| Hazard | Risk Level |
|---|---|
| Earthquake | Medium (6) |
| Landslide | Medium (6) |
* Risk, particularly concerning flood or landslide, may not be for the entire area.
- Dilley, M., R.S. Chen, U. Deichmann, A.L. Lerner-Lam, M. Arnold, J. Agwe, P. Buys, O. Kjekstad, B. Lyon, and G. Yetman. 2005. Natural Disaster Hotspots: A Global Risk Analysis. Washington, D.C.: World Bank. https://doi.org/10.1596/0-8213-5930-4.
- Center for Hazards and Risk Research - CHRR - Columbia University, Center for International Earth Science Information Network - CIESIN - Columbia University, and Norwegian Geotechnical Institute - NGI. 2005. Global Landslide Hazard Distribution. Palisades, NY: NASA Socioeconomic Data and Applications Center (SEDAC). https://doi.org/10.7927/H4P848VZ.
- Center for Hazards and Risk Research - CHRR - Columbia University, Center for International Earth Science Information Network - CIESIN - Columbia University. 2005. Global Earthquake Hazard Distribution - Peak Ground Acceleration. Palisades, NY: NASA Socioeconomic Data and Applications Center (SEDAC). https://doi.org/10.7927/H4BZ63ZS.
Recent Nearby Earthquakes
Magnitude 3.0 and greater
| Date▼ | Time↕ | Magnitude↕ | Distance↕ | Depth↕ | Location↕ | Link |
|---|---|---|---|---|---|---|
| 4/23/19 | 8:58 AM | 4.5 | 18.5 km | 10,000 m | 14km WSW of Mamurras, Albania | usgs.gov |
| 7/5/18 | 10:49 PM | 4.1 | 27.7 km | 7,520 m | 14km NNW of Shijak, Albania | usgs.gov |
| 7/5/18 | 2:09 AM | 3.5 | 23.4 km | 10,000 m | 16km NNW of Shijak, Albania | usgs.gov |
| 7/5/18 | 12:48 AM | 4.2 | 24.3 km | 11,670 m | 15km NNW of Shijak, Albania | usgs.gov |
| 7/4/18 | 11:24 AM | 4.4 | 28.5 km | 10,000 m | 10km NNW of Shijak, Albania | usgs.gov |
| 7/4/18 | 9:08 AM | 4.3 | 26.4 km | 10,000 m | 14km NNW of Shijak, Albania | usgs.gov |
| 7/4/18 | 9:01 AM | 5.1 | 23.6 km | 22,000 m | 8km NW of Vore, Albania | usgs.gov |
| 2/26/18 | 3:04 PM | 4.3 | 11.3 km | 10,000 m | 6km SSE of Lezhe, Albania | usgs.gov |
| 6/23/17 | 2:15 PM | 4.1 | 24.2 km | 25,920 m | 9km SE of Kruje, Albania | usgs.gov |
| 11/4/16 | 5:08 AM | 4.3 | 28.6 km | 9,220 m | 9km N of Rreshen, Albania | usgs.gov |
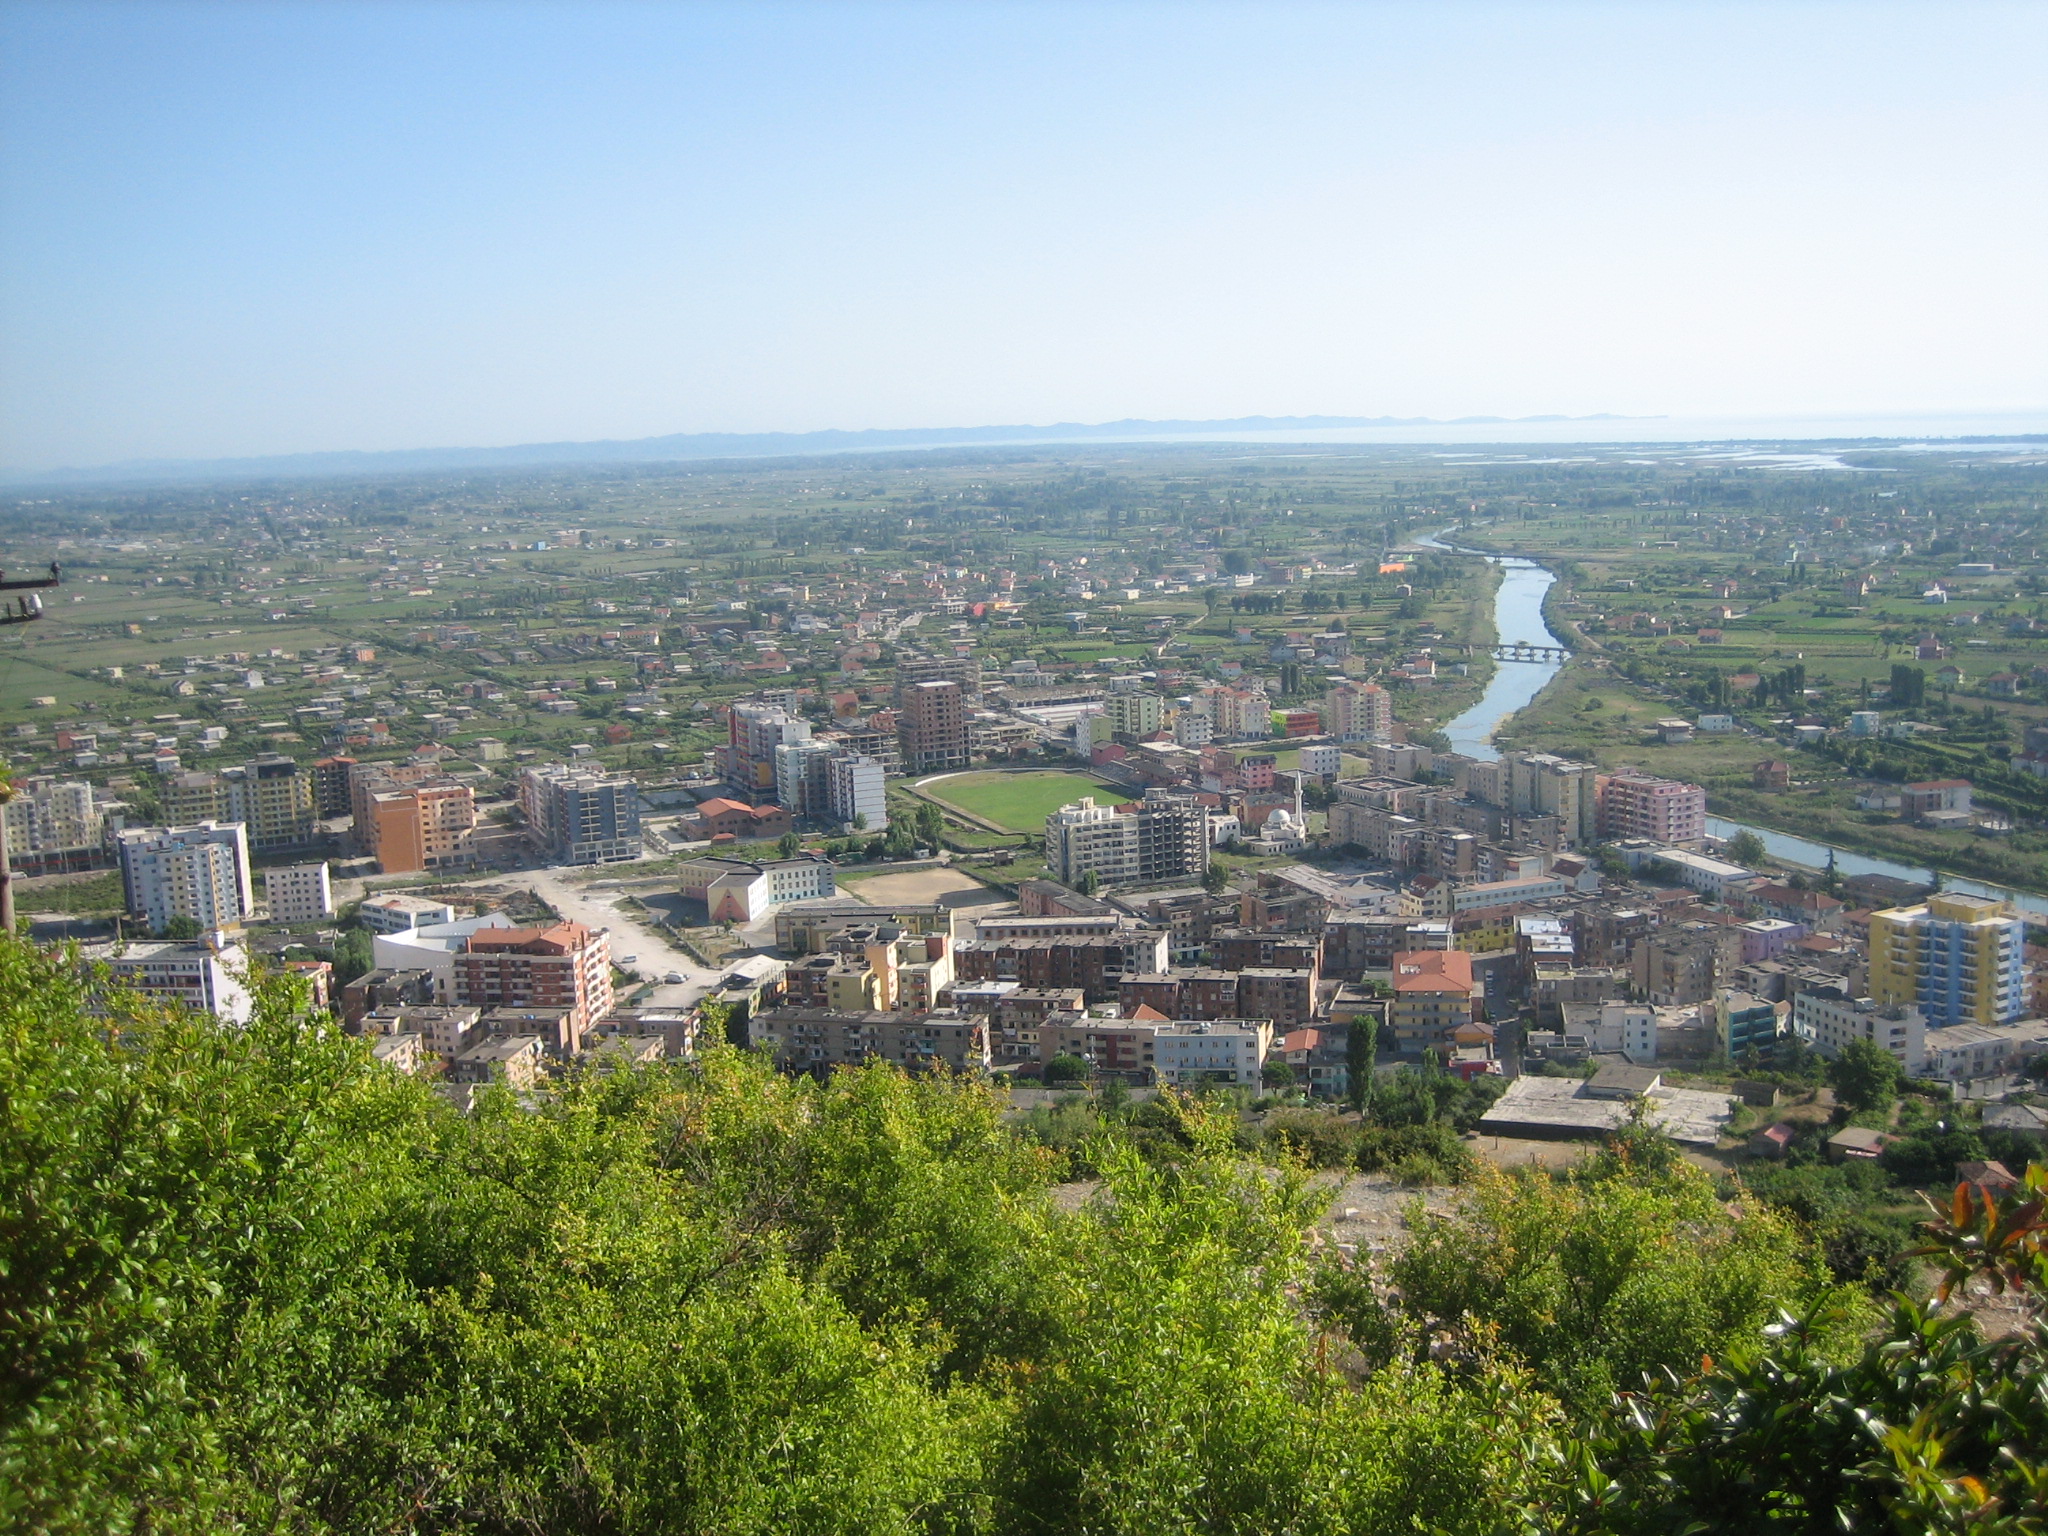
Laç
Laç (pronounced [lat͡ʃ]; definite Albanian form: Laçi) is a town and a former municipality in Lezhë County, northwestern Albania. At the 2015 local government reform it became a subdivision and the seat of the municipality Kurbin. It was the administ..
Laç Wikipedia Page


About Our Data
The data on this page is estimated using a number of publicly available tools and resources. It is provided without warranty, and could contain inaccuracies. Use at your own risk.