Vergo Facts
| Area | 136.8 km² |
| Population | 1,506 |
| Male Population | 759 (50.4%) |
| Female Population | 747 (49.6%) |
| Population change (1975 to 2020) | +30.1% |
| Population change (2000 to 2020) | -36.2% |
| Median Age | 38.4 years (Male: 37.2, Female: 39.5) |
| GDP per capita (PPP) | $3,215 (2022) |
| Local Time | |
| Timezone | Central European Summer Time |
| Lat & Lng | 40.00667, 20.00889 |
| Postal Codes | 9720 |
Map of Vergo
Interactive Map
Vergo Population
Years 1975 to 2030
| Data | 1975 | 1990 | 2000 | 2015 | 2020 | 2025* | 2030* |
|---|---|---|---|---|---|---|---|
| Population | 1,158 | 2,508 | 2,362 | 1,768 | 1,506 | 1,282 | 1,079 |
| Population Density | 8.5 / km² | 18.3 / km² | 17.3 / km² | 12.9 / km² | 11 / km² | 9.4 / km² | 7.9 / km² |
Vergo Population change from 2000 to 2020
Decrease of 36.2% from year 2000 to 2020
| Location | Change since 1975 | Change since 1990 | Change since 2000 |
|---|---|---|---|
| Vergo | +30.1% | -40% | -36.2% |
| Vlorë County | — | — | — |
| Albania | — | — | — |
Vergo Median Age
Median Age: 38.4 years
| Location | Median Age | Median Age (Female) | Median Age (Male) |
|---|---|---|---|
| Vergo | 38.4 yrs | 39.5 yrs | 37.2 yrs |
| Vlorë County | 37.5 yrs | 38.5 yrs | 36.4 yrs |
| Albania | 33.6 yrs | 34.7 yrs | 32.3 yrs |
Vergo Population Density
Population Density: 11 / km²
| Location | Population | Area | Density |
|---|---|---|---|
| Vergo | 1,506 | 136.8 km² | 11 / km² |
| Vlorë County | 180,230 | 2,684.2 km² | 67.1 / km² |
| Albania | 2.9 million | 28,671.4 km² | 101 / km² |
Vergo Historical and Projected Population
Estimated Population from 0 to 2100
- JRC (European Commission's Joint Research Centre) work on the GHS built-up grid
- CIESIN (Center for International Earth Science Information Network)
- [Link] Klein Goldewijk, K., Beusen, A., Doelman, J., and Stehfest, E.: Anthropogenic land use estimates for the Holocene – HYDE 3.2, Earth Syst. Sci. Data, 9, 927–953, https://doi.org/10.5194/essd-9-927-2017, 2017.
Human Development Index (HDI)
Statistic composite index of life expectancy, education, and per capita income.
Vergo Gross Domestic Product (GDP)
GDP per capita, PPP (constant 2017 international $)
| Data | 1990 | 1995 | 2000 | 2005 | 2010 | 2015 | 2020 | 2022 |
|---|---|---|---|---|---|---|---|---|
| GDP per capita | $3,522 | $2,331 | $2,291 | $2,243 | $1,965 | $2,447 | $2,412 | $3,215 |
| Total GDP | $3.2M | $1.8M | $1.4M | $1M | $682.5K | $653.2K | $506.7K | $608.9K |
Vergo CO2 Emissions
Carbon Dioxide (CO2) Emissions Per Capita in Tonnes Per Year
| Location | CO2 Emissions | CO2 Emissions Per Capita | CO2 Emissions Intensity |
|---|---|---|---|
| Vergo | 4,090 tn | 2.72 tn | 29.9 tons/km² |
| Vlorë County | 482,133 tn | 2.68 tn | 179.6 tons/km² |
| Albania | 7,341,173 tn | 2.55 tn | 256 tons/km² |
| 2013 CO2 emissions (tonnes/year) | 4,090 tn |
| 2013 CO2 emissions (tonnes/year) per capita | 2.72 tn |
| 2013 CO2 emissions intensity (tonnes/km²/year) | 29.9 tons/km² |
Natural Hazards Risk
Relative risk out of 10
| Hazard | Risk Level |
|---|---|
| Drought | High (8) |
| Flood | Medium (4) |
| Earthquake | Medium (7) |
| Landslide | Medium (7) |
* Risk, particularly concerning flood or landslide, may not be for the entire area.
- Dilley, M., R.S. Chen, U. Deichmann, A.L. Lerner-Lam, M. Arnold, J. Agwe, P. Buys, O. Kjekstad, B. Lyon, and G. Yetman. 2005. Natural Disaster Hotspots: A Global Risk Analysis. Washington, D.C.: World Bank. https://doi.org/10.1596/0-8213-5930-4.
- Center for Hazards and Risk Research - CHRR - Columbia University, Center for International Earth Science Information Network - CIESIN - Columbia University, and Norwegian Geotechnical Institute - NGI. 2005. Global Landslide Hazard Distribution. Palisades, NY: NASA Socioeconomic Data and Applications Center (SEDAC). https://doi.org/10.7927/H4P848VZ.
- Center for Hazards and Risk Research - CHRR - Columbia University, Center for International Earth Science Information Network - CIESIN - Columbia University, and International Research Institute for Climate and Society - IRI - Columbia University. 2005. Global Drought Hazard Frequency and Distribution. Palisades, NY: NASA Socioeconomic Data and Applications Center (SEDAC). https://doi.org/10.7927/H4VX0DFT.
- Center for Hazards and Risk Research - CHRR - Columbia University, Center for International Earth Science Information Network - CIESIN - Columbia University. 2005. Global Flood Hazard Frequency and Distribution. Palisades, NY: NASA Socioeconomic Data and Applications Center (SEDAC). https://doi.org/10.7927/H4668B3D.
- Center for Hazards and Risk Research - CHRR - Columbia University, Center for International Earth Science Information Network - CIESIN - Columbia University. 2005. Global Earthquake Hazard Distribution - Peak Ground Acceleration. Palisades, NY: NASA Socioeconomic Data and Applications Center (SEDAC). https://doi.org/10.7927/H4BZ63ZS.
Recent Nearby Earthquakes
Magnitude 3.0 and greater
| Date▼ | Time↕ | Magnitude↕ | Distance↕ | Depth↕ | Location↕ | Link |
|---|---|---|---|---|---|---|
| 9/28/17 | 9:33 PM | 3.3 | 11.8 km | 10,600 m | 6km NW of Sarande, Albania | usgs.gov |
| 9/18/17 | 4:47 PM | 4.3 | 10.3 km | 15,740 m | 15km W of Gjirokaster, Albania | usgs.gov |
| 12/17/16 | 10:39 AM | 4.3 | 1.5 km | 10,000 m | 11km NW of Delvine, Albania | usgs.gov |
| 9/17/09 | 10:53 PM | 4.4 | 5.1 km | 29,400 m | Albania | usgs.gov |
| 8/25/08 | 8:46 PM | 3.3 | 8 km | 16,000 m | Albania | usgs.gov |
| 4/20/08 | 6:41 AM | 3.4 | 24.9 km | 9,000 m | Albania | usgs.gov |
| 2/17/08 | 12:58 PM | 3.3 | 15.3 km | 11,000 m | Albania | usgs.gov |
| 2/2/08 | 7:42 PM | 3.3 | 21.5 km | 16,000 m | Greece-Albania border region | usgs.gov |
| 12/17/07 | 12:07 PM | 3.1 | 1.7 km | 10,000 m | Albania | usgs.gov |
| 7/29/07 | 3:33 AM | 3.4 | 13 km | 11,000 m | Albania | usgs.gov |
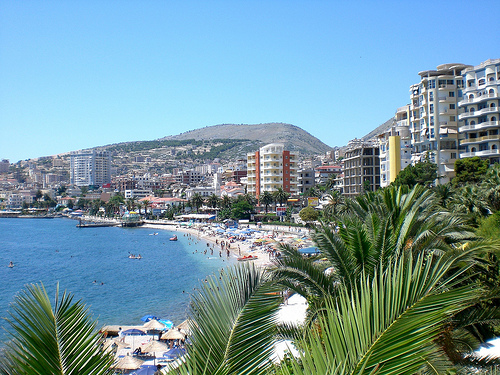
Vergo
Vergo is a village and a former municipality in the Vlorë County, southern Albania. At the 2015 local government reform it became a subdivision of the municipality Delvinë. The population at the 2011 census was 1,844. The municipal unit consists of t..
Vergo Wikipedia Page

About Our Data
The data on this page is estimated using a number of publicly available tools and resources. It is provided without warranty, and could contain inaccuracies. Use at your own risk.