Categories in Khashtarak
Khashtarak Facts
| Area | 23.0 km² |
| Population | 1,516 |
| Male Population | 680 (44.9%) |
| Female Population | 836 (55.1%) |
| Population change (1975 to 2020) | +46.9% |
| Population change (2000 to 2020) | +4.1% |
| Median Age | 34.6 years (Male: 31.6, Female: 37.1) |
| GDP per capita (PPP) | $10,927 (2022) |
| Local Time | |
| Timezone | Armenia Standard Time |
| Lat & Lng | 40.93668, 45.18210 |
| Postal Codes | 4009 |
Map of Khashtarak
Interactive Map
Khashtarak Population
Years 1975 to 2030
| Data | 1975 | 1990 | 2000 | 2015 | 2020 | 2025* | 2030* |
|---|---|---|---|---|---|---|---|
| Population | 1,032 | 1,529 | 1,456 | 1,628 | 1,516 | 1,468 | 1,417 |
| Population Density | 44.9 / km² | 66.5 / km² | 63.3 / km² | 70.8 / km² | 65.9 / km² | 63.8 / km² | 61.6 / km² |
Khashtarak Population change from 2000 to 2020
Increase of 4.1% from year 2000 to 2020
| Location | Change since 1975 | Change since 1990 | Change since 2000 |
|---|---|---|---|
| Khashtarak | +46.9% | -0.9% | +4.1% |
| Tavush Province | — | — | — |
| Armenia | — | — | — |
Khashtarak Median Age
Median Age: 34.6 years
| Location | Median Age | Median Age (Female) | Median Age (Male) |
|---|---|---|---|
| Khashtarak | 34.6 yrs | 37.1 yrs | 31.6 yrs |
| Tavush Province | 34 yrs | 36.5 yrs | 31.2 yrs |
| Armenia | 33.1 yrs | 35.3 yrs | 30.8 yrs |
Khashtarak Population Density
Population Density: 65.9 / km²
| Location | Population | Area | Density |
|---|---|---|---|
| Khashtarak | 1,516 | 23 km² | 65.9 / km² |
| Tavush Province | 112,181 | 2,626.3 km² | 42.7 / km² |
| Armenia | 3 million | 29,714.7 km² | 102 / km² |
Khashtarak Historical and Projected Population
Estimated Population from 1100 to 2100
- JRC (European Commission's Joint Research Centre) work on the GHS built-up grid
- CIESIN (Center for International Earth Science Information Network)
- [Link] Klein Goldewijk, K., Beusen, A., Doelman, J., and Stehfest, E.: Anthropogenic land use estimates for the Holocene – HYDE 3.2, Earth Syst. Sci. Data, 9, 927–953, https://doi.org/10.5194/essd-9-927-2017, 2017.
Human Development Index (HDI)
Statistic composite index of life expectancy, education, and per capita income.
Khashtarak Gross Domestic Product (GDP)
GDP per capita, PPP (constant 2017 international $)
| Data | 1990 | 1995 | 2000 | 2005 | 2010 | 2015 | 2020 | 2022 |
|---|---|---|---|---|---|---|---|---|
| GDP per capita | $2,999 | $1,698 | $2,728 | $4,093 | $5,017 | $6,655 | $8,085 | $10,927 |
| Total GDP | $18.6M | $9.5M | $14.3M | $21.4M | $26.4M | $34.6M | $42.8M | $57.1M |
Khashtarak CO2 Emissions
Carbon Dioxide (CO2) Emissions Per Capita in Tonnes Per Year
| Location | CO2 Emissions | CO2 Emissions Per Capita | CO2 Emissions Intensity |
|---|---|---|---|
| Khashtarak | 3,013 tn | 1.99 tn | 131 tons/km² |
| Tavush Province | 226,247 tn | 2.02 tn | 86.1 tons/km² |
| Armenia | 6,386,017 tn | 2.12 tn | 214.9 tons/km² |
| 2013 CO2 emissions (tonnes/year) | 3,013 tn |
| 2013 CO2 emissions (tonnes/year) per capita | 1.99 tn |
| 2013 CO2 emissions intensity (tonnes/km²/year) | 131 tons/km² |
Natural Hazards Risk
Relative risk out of 10
| Hazard | Risk Level |
|---|---|
| Drought | Low (2) |
| Earthquake | High (7.6) |
| Landslide | Medium (6) |
* Risk, particularly concerning flood or landslide, may not be for the entire area.
- Dilley, M., R.S. Chen, U. Deichmann, A.L. Lerner-Lam, M. Arnold, J. Agwe, P. Buys, O. Kjekstad, B. Lyon, and G. Yetman. 2005. Natural Disaster Hotspots: A Global Risk Analysis. Washington, D.C.: World Bank. https://doi.org/10.1596/0-8213-5930-4.
- Center for Hazards and Risk Research - CHRR - Columbia University, Center for International Earth Science Information Network - CIESIN - Columbia University, and Norwegian Geotechnical Institute - NGI. 2005. Global Landslide Hazard Distribution. Palisades, NY: NASA Socioeconomic Data and Applications Center (SEDAC). https://doi.org/10.7927/H4P848VZ.
- Center for Hazards and Risk Research - CHRR - Columbia University, Center for International Earth Science Information Network - CIESIN - Columbia University, and International Research Institute for Climate and Society - IRI - Columbia University. 2005. Global Drought Hazard Frequency and Distribution. Palisades, NY: NASA Socioeconomic Data and Applications Center (SEDAC). https://doi.org/10.7927/H4VX0DFT.
- Center for Hazards and Risk Research - CHRR - Columbia University, Center for International Earth Science Information Network - CIESIN - Columbia University. 2005. Global Earthquake Hazard Distribution - Peak Ground Acceleration. Palisades, NY: NASA Socioeconomic Data and Applications Center (SEDAC). https://doi.org/10.7927/H4BZ63ZS.
Recent Nearby Earthquakes
Magnitude 3.0 and greater
| Date▼ | Time↕ | Magnitude↕ | Distance↕ | Depth↕ | Location↕ | Link |
|---|---|---|---|---|---|---|
| 6/6/18 | 1:07 PM | 4.2 | 75.3 km | 10,000 m | 2km NE of Arevashogh, Armenia | usgs.gov |
| 6/7/17 | 6:25 PM | 4.7 | 86.2 km | 10,000 m | 17km S of Tsnori, Georgia | usgs.gov |
| 7/21/16 | 3:17 PM | 4.2 | 84.9 km | 15,760 m | 11km NNE of Metsavan, Armenia | usgs.gov |
| 4/6/15 | 1:26 AM | 4.1 | 78.1 km | 10,000 m | 5km SW of Lanjaghbyur, Armenia | usgs.gov |
| 10/3/14 | 9:45 AM | 4 | 32.2 km | 34,270 m | 7km WNW of Tovuz, Azerbaijan | usgs.gov |
| 9/27/11 | 8:58 AM | 4.2 | 99.7 km | 10,000 m | Georgia (Sak'art'velo) | usgs.gov |
| 6/18/08 | 11:04 AM | 3.7 | 79.7 km | 10,000 m | Georgia (Sak'art'velo) | usgs.gov |
| 4/29/08 | 5:20 AM | 3.7 | 98.3 km | 10,000 m | Armenia | usgs.gov |
| 7/9/07 | 9:33 AM | 4.4 | 89.1 km | 15,000 m | Armenia | usgs.gov |
| 1/12/07 | 8:00 AM | 4.2 | 86.7 km | 5,000 m | Armenia | usgs.gov |
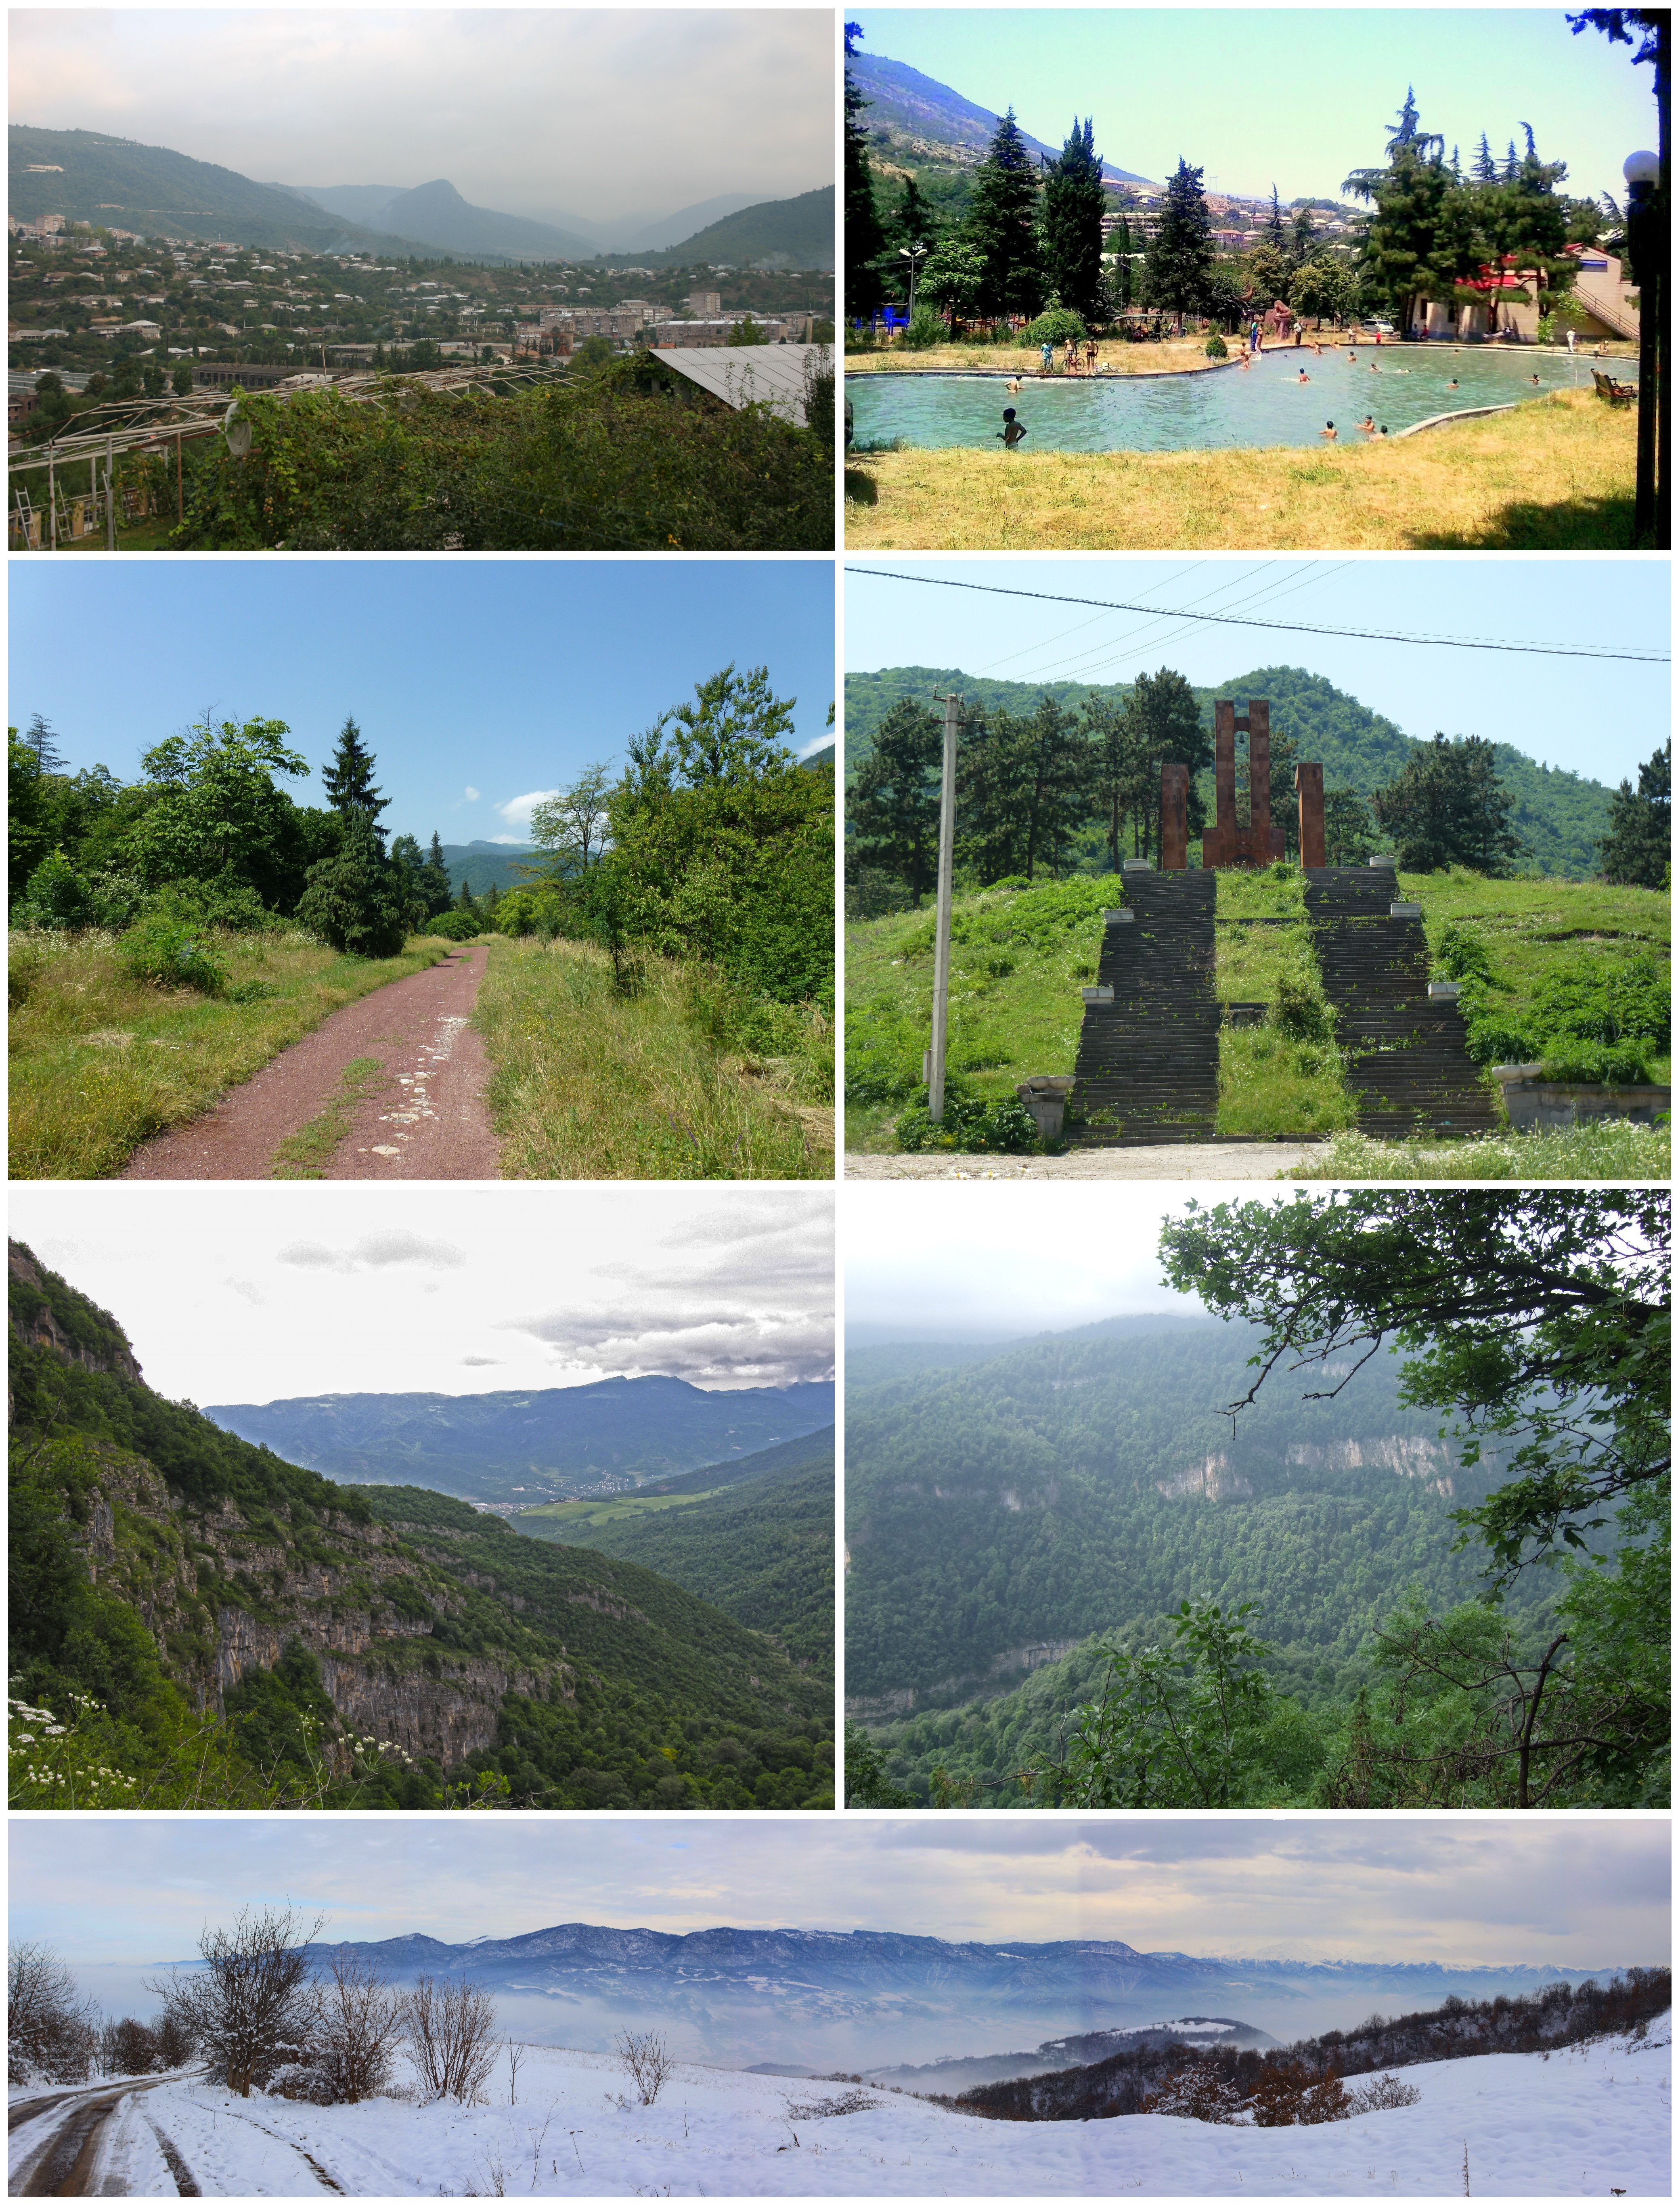
Khashtarak
(Armenian: Խաշթառակ, also Romanized as Khasht’arrak and Khashtarrak) is a village in the Tavush Province of Armenia. Within the village is a recently built church, and nearby west and southeast are abandoned medieval settlements with khachkars. , K..
Khashtarak Wikipedia Page

About Our Data
The data on this page is estimated using a number of publicly available tools and resources. It is provided without warranty, and could contain inaccuracies. Use at your own risk.