Tsovazard Facts
| Area | 41.2 km² |
| Population | 1,781 |
| Male Population | 879 (49.3%) |
| Female Population | 902 (50.7%) |
| Population change (1975 to 2020) | -20.2% |
| Population change (2000 to 2020) | -13.0% |
| Median Age | 30.3 years (Male: 28.3, Female: 32.6) |
| GDP per capita (PPP) | $11,775 (2022) |
| Local Time | |
| Timezone | Armenia Standard Time |
| Lat & Lng | 40.47089, 45.05879 |
| Postal Codes | 1210 |
Map of Tsovazard
Interactive Map
Tsovazard Population
Years 1975 to 2030
| Data | 1975 | 1990 | 2000 | 2015 | 2020 | 2025* | 2030* |
|---|---|---|---|---|---|---|---|
| Population | 2,231 | 2,542 | 2,046 | 1,767 | 1,781 | 1,775 | 1,757 |
| Population Density | 54.2 / km² | 61.7 / km² | 49.7 / km² | 42.9 / km² | 43.2 / km² | 43.1 / km² | 42.7 / km² |
Tsovazard Population change from 2000 to 2020
Decrease of 13% from year 2000 to 2020
| Location | Change since 1975 | Change since 1990 | Change since 2000 |
|---|---|---|---|
| Tsovazard | -20.2% | -29.9% | -13% |
| Gegharkunik Province | — | — | — |
| Armenia | — | — | — |
Tsovazard Median Age
Median Age: 30.3 years
| Location | Median Age | Median Age (Female) | Median Age (Male) |
|---|---|---|---|
| Tsovazard | 30.3 yrs | 32.6 yrs | 28.3 yrs |
| Gegharkunik Province | 30.3 yrs | 32.5 yrs | 28.2 yrs |
| Armenia | 33.1 yrs | 35.3 yrs | 30.8 yrs |
Tsovazard Population Density
Population Density: 43.2 / km²
| Location | Population | Area | Density |
|---|---|---|---|
| Tsovazard | 1,781 | 41.2 km² | 43.2 / km² |
| Gegharkunik Province | 225,308 | 5,271.9 km² | 42.7 / km² |
| Armenia | 3 million | 29,714.7 km² | 102 / km² |
Tsovazard Historical and Projected Population
Estimated Population from 0 to 2100
- JRC (European Commission's Joint Research Centre) work on the GHS built-up grid
- CIESIN (Center for International Earth Science Information Network)
- [Link] Klein Goldewijk, K., Beusen, A., Doelman, J., and Stehfest, E.: Anthropogenic land use estimates for the Holocene – HYDE 3.2, Earth Syst. Sci. Data, 9, 927–953, https://doi.org/10.5194/essd-9-927-2017, 2017.
Human Development Index (HDI)
Statistic composite index of life expectancy, education, and per capita income.
Tsovazard Gross Domestic Product (GDP)
GDP per capita, PPP (constant 2017 international $)
| Data | 1990 | 1995 | 2000 | 2005 | 2010 | 2015 | 2020 | 2022 |
|---|---|---|---|---|---|---|---|---|
| GDP per capita | $3,488 | $1,939 | $2,845 | $4,647 | $5,650 | $7,227 | $9,939 | $11,775 |
| Total GDP | $12.6M | $6.4M | $7.4M | $12.9M | $15.2M | $18.4M | $24.7M | $29.5M |
Tsovazard CO2 Emissions
Carbon Dioxide (CO2) Emissions Per Capita in Tonnes Per Year
| Location | CO2 Emissions | CO2 Emissions Per Capita | CO2 Emissions Intensity |
|---|---|---|---|
| Tsovazard | 3,624 tn | 2.03 tn | 88 tons/km² |
| Gegharkunik Province | 461,660 tn | 2.05 tn | 87.6 tons/km² |
| Armenia | 6,386,017 tn | 2.12 tn | 214.9 tons/km² |
| 2013 CO2 emissions (tonnes/year) | 3,624 tn |
| 2013 CO2 emissions (tonnes/year) per capita | 2.03 tn |
| 2013 CO2 emissions intensity (tonnes/km²/year) | 88 tons/km² |
Natural Hazards Risk
Relative risk out of 10
| Hazard | Risk Level |
|---|---|
| Drought | Low (2) |
| Earthquake | High (8) |
| Landslide | Medium (7) |
* Risk, particularly concerning flood or landslide, may not be for the entire area.
- Dilley, M., R.S. Chen, U. Deichmann, A.L. Lerner-Lam, M. Arnold, J. Agwe, P. Buys, O. Kjekstad, B. Lyon, and G. Yetman. 2005. Natural Disaster Hotspots: A Global Risk Analysis. Washington, D.C.: World Bank. https://doi.org/10.1596/0-8213-5930-4.
- Center for Hazards and Risk Research - CHRR - Columbia University, Center for International Earth Science Information Network - CIESIN - Columbia University, and Norwegian Geotechnical Institute - NGI. 2005. Global Landslide Hazard Distribution. Palisades, NY: NASA Socioeconomic Data and Applications Center (SEDAC). https://doi.org/10.7927/H4P848VZ.
- Center for Hazards and Risk Research - CHRR - Columbia University, Center for International Earth Science Information Network - CIESIN - Columbia University, and International Research Institute for Climate and Society - IRI - Columbia University. 2005. Global Drought Hazard Frequency and Distribution. Palisades, NY: NASA Socioeconomic Data and Applications Center (SEDAC). https://doi.org/10.7927/H4VX0DFT.
- Center for Hazards and Risk Research - CHRR - Columbia University, Center for International Earth Science Information Network - CIESIN - Columbia University. 2005. Global Earthquake Hazard Distribution - Peak Ground Acceleration. Palisades, NY: NASA Socioeconomic Data and Applications Center (SEDAC). https://doi.org/10.7927/H4BZ63ZS.
Recent Nearby Earthquakes
Magnitude 3.0 and greater
| Date▼ | Time↕ | Magnitude↕ | Distance↕ | Depth↕ | Location↕ | Link |
|---|---|---|---|---|---|---|
| 6/6/18 | 1:07 PM | 4.2 | 79.1 km | 10,000 m | 2km NE of Arevashogh, Armenia | usgs.gov |
| 4/6/15 | 1:26 AM | 4.1 | 26.3 km | 10,000 m | 5km SW of Lanjaghbyur, Armenia | usgs.gov |
| 10/3/14 | 9:45 AM | 4 | 74.2 km | 34,270 m | 7km WNW of Tovuz, Azerbaijan | usgs.gov |
| 11/4/08 | 6:53 PM | 3.3 | 77.1 km | 5,000 m | Armenia | usgs.gov |
| 4/29/08 | 5:20 AM | 3.7 | 70.1 km | 10,000 m | Armenia | usgs.gov |
| 4/11/07 | 7:43 PM | 3.5 | 63.5 km | 5,000 m | Armenia | usgs.gov |
| 1/12/07 | 8:00 AM | 4.2 | 38.4 km | 5,000 m | Armenia | usgs.gov |
| 7/29/05 | 9:09 PM | 3.1 | 89.8 km | 5,000 m | Armenia | usgs.gov |
| 3/13/05 | 3:02 AM | 4.6 | 68.2 km | 10,000 m | Azerbaijan | usgs.gov |
| 8/9/04 | 6:33 PM | 4 | 83.9 km | 4,300 m | Turkey-Iran border region | usgs.gov |
Tsovazard
(Azerbaijani: Hacı Muxan; Armenian: Ծովազարդ; until 1978 Mukhan and Gadzhi Mukhan) is a village in the Gegharkunik Province of Armenia. There are Bronze Age burial sites and a church rebuilt in the 19th century in the vicinity.
Tsovazard Wikipedia Page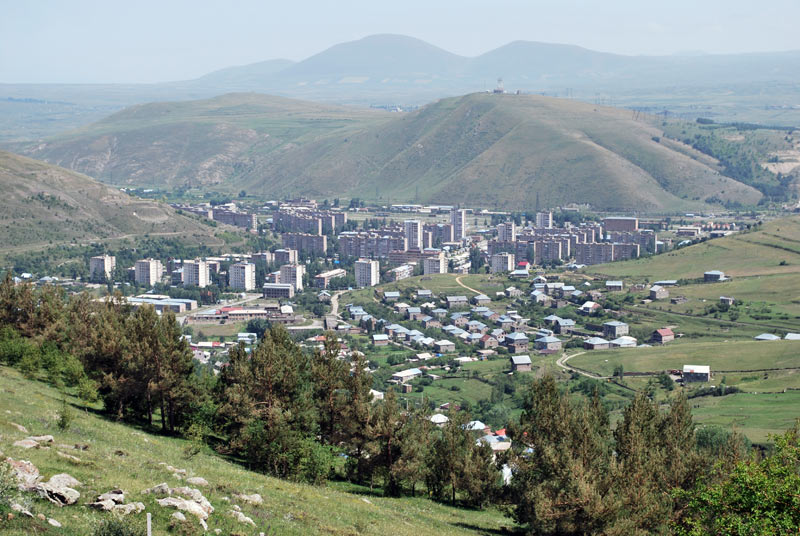


About Our Data
The data on this page is estimated using a number of publicly available tools and resources. It is provided without warranty, and could contain inaccuracies. Use at your own risk.