Categories in Cafayate
Industries
Business Distribution by Industry in Cafayate
| Industry Description | Number of Establishments | Average Google Rating |
|---|---|---|
| Other accommodation | 69 | 4.2 |
| Hotels and motels | 44 | 4.2 |
| Shopping | 42 | 4.1 |
| Restaurants | 32 | 4 |
| Latin american restaurants | 25 | 3.9 |
| Grocery stores and supermarkets | 19 | 4.2 |
| All food and beverage | 18 | 4.3 |
| Bars, pubs and taverns | 18 | 4.1 |
| Winery | 17 | 4.3 |
| Travel agencies | 17 | 4.4 |
| Hostels | 14 | 4.2 |
| Bed and breakfasts | 13 | 4.5 |
| Gifts, cards and party supplies | 8 | 4.2 |
| Education | 7 | 4.2 |
| Pizza | 5 | 4.1 |
| Pharmacies and drug stores | 5 | 4.5 |
| Churches | 5 | 4.6 |
| Cafes | 5 | 3.9 |
Cafayate Facts
| Area | 2.6 km² |
| Population | 15,114 |
| Population change (1975 to 2020) | +116161.5% |
| Population change (2000 to 2020) | +43.5% |
| Area Codes | 3868 |
| Neighborhoods | Centro, Norte, Salta, Alberdi, Costanera |
| Local Time | |
| Timezone | Argentina Standard Time |
| Lat & Lng | -26.07286, -65.97766 |
Map of Cafayate
Interactive Map
Cafayate Population
Years 1975 to 2020
| Data | 1975 | 1990 | 2000 | 2015 | 2020 |
|---|---|---|---|---|---|
| Population | 13 | 8,105 | 10,535 | 14,587 | 15,114 |
| Population Density | 5 / km² | 3,087.6 / km² | 4,013.3 / km² | 5,557 / km² | 5,757.7 / km² |
Cafayate Population change from 2000 to 2015
Increase of 38.5% from year 2000 to 2015
| Location | Change since 1975 | Change since 1990 | Change since 2000 |
|---|---|---|---|
| Cafayate | +112107.7% | +80% | +38.5% |
| Salta Province | +83.3% | +41% | +20.6% |
| Argentina | +66.4% | +32.6% | +17.1% |
Cafayate Population Density
Population Density: 5,758 / km²
| Location | Population | Area | Density |
|---|---|---|---|
| Cafayate | 15,114 | 2.625 km² | 5,758 / km² |
| Salta Province | 1.3 million | 155,410.6 km² | 8.2 / km² |
| Argentina | 43.2 million | 2,779,516.9 km² | 15.5 / km² |
Cafayate Historical and Projected Population
Estimated Population from 1975 to 2100
- JRC (European Commission's Joint Research Centre) work on the GHS built-up grid
- CIESIN (Center for International Earth Science Information Network)
- [Link] Klein Goldewijk, K., Beusen, A., Doelman, J., and Stehfest, E.: Anthropogenic land use estimates for the Holocene – HYDE 3.2, Earth Syst. Sci. Data, 9, 927–953, https://doi.org/10.5194/essd-9-927-2017, 2017.
Area Codes
Percentage Area Codes used by businesses in Cafayate
Price Distribution
Business distribution by price for Cafayate
Human Development Index (HDI)
Statistic composite index of life expectancy, education, and per capita income.
Cafayate CO2 Emissions
Carbon Dioxide (CO2) Emissions Per Capita in Tonnes Per Year
| Location | CO2 Emissions | CO2 Emissions Per Capita | CO2 Emissions Intensity |
|---|---|---|---|
| Cafayate | 65,916 tn | 4.36 tn | 25,110.7 tons/km² |
| Salta Province | 4,890,433 tn | 3.84 tn | 31.5 tons/km² |
| Argentina | 198,107,945 tn | 4.59 tn | 71.3 tons/km² |
| 2013 CO2 emissions (tonnes/year) | 65,916 tn |
| 2013 CO2 emissions (tonnes/year) per capita | 4.36 tn |
| 2013 CO2 emissions intensity (tonnes/km²/year) | 25,110.7 tons/km² |
Natural Hazards Risk
Relative risk out of 10
| Hazard | Risk Level |
|---|---|
| Drought | Medium (7) |
| Earthquake | Medium (6) |
* Risk, particularly concerning flood or landslide, may not be for the entire area.
- Dilley, M., R.S. Chen, U. Deichmann, A.L. Lerner-Lam, M. Arnold, J. Agwe, P. Buys, O. Kjekstad, B. Lyon, and G. Yetman. 2005. Natural Disaster Hotspots: A Global Risk Analysis. Washington, D.C.: World Bank. https://doi.org/10.1596/0-8213-5930-4.
- Center for Hazards and Risk Research - CHRR - Columbia University, Center for International Earth Science Information Network - CIESIN - Columbia University, and International Research Institute for Climate and Society - IRI - Columbia University. 2005. Global Drought Hazard Frequency and Distribution. Palisades, NY: NASA Socioeconomic Data and Applications Center (SEDAC). https://doi.org/10.7927/H4VX0DFT.
- Center for Hazards and Risk Research - CHRR - Columbia University, Center for International Earth Science Information Network - CIESIN - Columbia University. 2005. Global Earthquake Hazard Distribution - Peak Ground Acceleration. Palisades, NY: NASA Socioeconomic Data and Applications Center (SEDAC). https://doi.org/10.7927/H4BZ63ZS.
Recent Nearby Earthquakes
Magnitude 3.0 and greater
| Date▼ | Time↕ | Magnitude↕ | Distance↕ | Depth↕ | Location↕ | Link |
|---|---|---|---|---|---|---|
| 11/18/17 | 3:01 PM | 4.3 | 75.9 km | 123,270 m | 56km S of Chicoana, Argentina | usgs.gov |
| 7/29/16 | 4:44 PM | 4.2 | 76.9 km | 59,710 m | 16km S of Trancas, Argentina | usgs.gov |
| 12/22/12 | 5:30 AM | 4.2 | 90.3 km | 35,800 m | Catamarca, Argentina | usgs.gov |
| 5/18/11 | 9:27 PM | 4.7 | 92 km | 159,600 m | Catamarca, Argentina | usgs.gov |
| 5/21/10 | 1:02 PM | 5.1 | 81.4 km | 10,000 m | Salta, Argentina | usgs.gov |
| 3/21/10 | 4:40 AM | 4.4 | 72.2 km | 35,000 m | Salta, Argentina | usgs.gov |
| 3/10/10 | 2:40 AM | 4.3 | 95.2 km | 43,700 m | Catamarca, Argentina | usgs.gov |
| 3/9/10 | 1:48 AM | 4.8 | 88.2 km | 63,800 m | Catamarca, Argentina | usgs.gov |
| 3/8/10 | 8:51 PM | 4.4 | 71.5 km | 10,000 m | Salta, Argentina | usgs.gov |
| 3/8/10 | 5:03 PM | 5.8 | 75.5 km | 10,000 m | Salta, Argentina | usgs.gov |
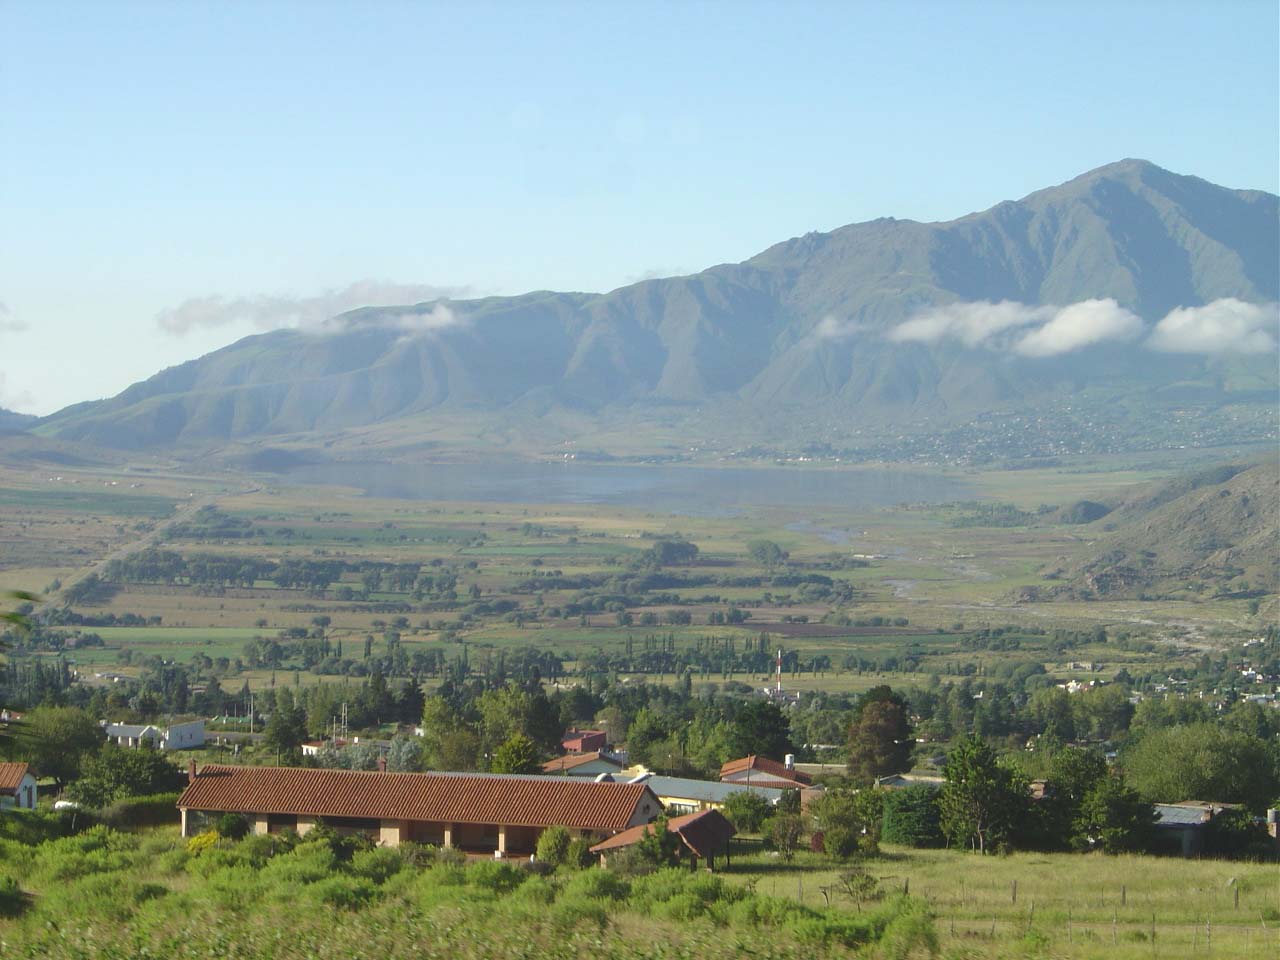
Cafayate
Cafayate (Spanish pronunciation: [kafaˈʒate]) is a town located at the central zone of the Valles Calchaquíes in the province of Salta, Argentina. It sits 1,683 metres (5,522 ft) above mean sea level, at a distance of 189 kilometres (117 mi) from Sal..
Cafayate Wikipedia Page


About Our Data
The data on this page is estimated using a number of publicly available tools and resources. It is provided without warranty, and could contain inaccuracies. Use at your own risk.