Mailín Facts
| Area | 0.3 km² |
| Population | 869 |
| Population change (1975 to 2020) | +35.6% |
| Population change (2000 to 2020) | +21.4% |
| Area Codes | 3844 |
| Local Time | |
| Timezone | Argentina Standard Time |
| Lat & Lng | -28.48262, -63.27624 |
Map of Mailín
Interactive Map
Mailín Population
Years 1975 to 2020
| Data | 1975 | 1990 | 2000 | 2015 | 2020 |
|---|---|---|---|---|---|
| Population | 641 | 692 | 716 | 846 | 869 |
| Population Density | 2,051.2 / km² | 2,214.4 / km² | 2,291.2 / km² | 2,707.2 / km² | 2,780.8 / km² |
Mailín Population change from 2000 to 2015
Increase of 18.2% from year 2000 to 2015
| Location | Change since 1975 | Change since 1990 | Change since 2000 |
|---|---|---|---|
| Mailín | +32% | +22.3% | +18.2% |
| Santiago del Estero Province | +55.9% | +26% | +13.1% |
| Argentina | +66.4% | +32.6% | +17.1% |
Mailín Population Density
Population Density: 2,781 / km²
| Location | Population | Area | Density |
|---|---|---|---|
| Mailín | 869 | 0.313 km² | 2,781 / km² |
| Santiago del Estero Province | 929,066 | 136,963.3 km² | 6.8 / km² |
| Argentina | 43.2 million | 2,779,516.9 km² | 15.5 / km² |
Mailín Historical and Projected Population
Estimated Population from 1770 to 2100
- JRC (European Commission's Joint Research Centre) work on the GHS built-up grid
- CIESIN (Center for International Earth Science Information Network)
- [Link] Klein Goldewijk, K., Beusen, A., Doelman, J., and Stehfest, E.: Anthropogenic land use estimates for the Holocene – HYDE 3.2, Earth Syst. Sci. Data, 9, 927–953, https://doi.org/10.5194/essd-9-927-2017, 2017.
Human Development Index (HDI)
Statistic composite index of life expectancy, education, and per capita income.
Mailín CO2 Emissions
Carbon Dioxide (CO2) Emissions Per Capita in Tonnes Per Year
| Location | CO2 Emissions | CO2 Emissions Per Capita | CO2 Emissions Intensity |
|---|---|---|---|
| Mailín | 3,085 tn | 3.55 tn | 9,873.5 tons/km² |
| Santiago del Estero Province | 3,477,324 tn | 3.74 tn | 25.4 tons/km² |
| Argentina | 198,107,945 tn | 4.59 tn | 71.3 tons/km² |
| 2013 CO2 emissions (tonnes/year) | 3,085 tn |
| 2013 CO2 emissions (tonnes/year) per capita | 3.55 tn |
| 2013 CO2 emissions intensity (tonnes/km²/year) | 9,873.5 tons/km² |
Natural Hazards Risk
Relative risk out of 10
| Hazard | Risk Level |
|---|---|
| Drought | Medium (5) |
| Flood | Medium (4) |
| Earthquake | Low (2) |
* Risk, particularly concerning flood or landslide, may not be for the entire area.
- Dilley, M., R.S. Chen, U. Deichmann, A.L. Lerner-Lam, M. Arnold, J. Agwe, P. Buys, O. Kjekstad, B. Lyon, and G. Yetman. 2005. Natural Disaster Hotspots: A Global Risk Analysis. Washington, D.C.: World Bank. https://doi.org/10.1596/0-8213-5930-4.
- Center for Hazards and Risk Research - CHRR - Columbia University, Center for International Earth Science Information Network - CIESIN - Columbia University, and International Research Institute for Climate and Society - IRI - Columbia University. 2005. Global Drought Hazard Frequency and Distribution. Palisades, NY: NASA Socioeconomic Data and Applications Center (SEDAC). https://doi.org/10.7927/H4VX0DFT.
- Center for Hazards and Risk Research - CHRR - Columbia University, Center for International Earth Science Information Network - CIESIN - Columbia University. 2005. Global Flood Hazard Frequency and Distribution. Palisades, NY: NASA Socioeconomic Data and Applications Center (SEDAC). https://doi.org/10.7927/H4668B3D.
- Center for Hazards and Risk Research - CHRR - Columbia University, Center for International Earth Science Information Network - CIESIN - Columbia University. 2005. Global Earthquake Hazard Distribution - Peak Ground Acceleration. Palisades, NY: NASA Socioeconomic Data and Applications Center (SEDAC). https://doi.org/10.7927/H4BZ63ZS.
Recent Nearby Earthquakes
Magnitude 3.0 and greater
| Date▼ | Time↕ | Magnitude↕ | Distance↕ | Depth↕ | Location↕ | Link |
|---|---|---|---|---|---|---|
| 8/11/19 | 6:44 PM | 4.9 | 43.6 km | 587,310 m | 30km SE of Suncho Corral, Argentina | usgs.gov |
| 4/16/19 | 5:01 PM | 5 | 31.7 km | 589,620 m | 39km NW of Anatuya, Argentina | usgs.gov |
| 3/1/19 | 12:13 AM | 5.5 | 25.8 km | 577,650 m | 37km SSE of Suncho Corral, Argentina | usgs.gov |
| 7/20/18 | 10:24 AM | 5.6 | 50.7 km | 579,000 m | 22km ESE of Suncho Corral, Argentina | usgs.gov |
| 10/6/16 | 7:36 AM | 4.2 | 64.3 km | 605,910 m | 30km ESE of Colonia Dora, Argentina | usgs.gov |
| 11/18/14 | 9:16 PM | 4.6 | 87.2 km | 567,670 m | 26km NNE of Suncho Corral, Argentina | usgs.gov |
| 4/18/14 | 7:46 AM | 5.2 | 95.1 km | 609,680 m | 37km WSW of Quimili, Argentina | usgs.gov |
| 2/22/13 | 12:01 PM | 6.1 | 63.5 km | 575,200 m | 23km ESE of Suncho Corral, Argentina | usgs.gov |
| 5/28/12 | 11:50 AM | 4.9 | 47.2 km | 580,600 m | Santiago Del Estero, Argentina | usgs.gov |
| 5/28/12 | 5:07 AM | 6.7 | 51.9 km | 586,900 m | Santiago Del Estero, Argentina | usgs.gov |
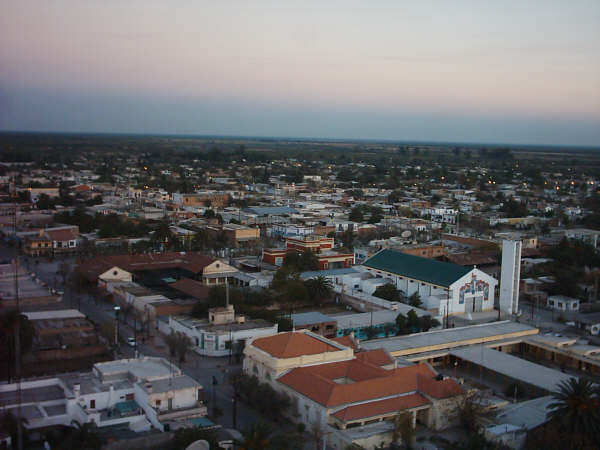
Mailín
Mailín is a small town 150 kilometres from Santiago del Estero, in the Santiago del Estero Province, Argentina, with a population of around 500. town is best known for the annual peregrination honouring the Señor de los Milagros de Mailín (Lord of M..
Mailín Wikipedia Page
About Our Data
The data on this page is estimated using a number of publicly available tools and resources. It is provided without warranty, and could contain inaccuracies. Use at your own risk.