Categories in Merlo
Industries
Business Distribution by Industry in Merlo
| Industry Description | Number of Establishments |
|---|---|
| Other accommodation | 52 |
| Restaurants | 45 |
| Hotels and motels | 29 |
| Shopping | 27 |
| Grocery stores and supermarkets | 24 |
| Bakeries | 16 |
| Holiday homes, cabins and resorts | 16 |
| Clothing stores | 13 |
| Real estate | 11 |
| Car repair | 11 |
| Bars, pubs and taverns | 11 |
| Shopping other | 10 |
| Education | 9 |
| Construction of houses | 8 |
| Radio broadcasting | 8 |
| Religion | 8 |
Merlo Facts
| Area | 15.1 km² |
| Population | 16,341 |
| Male Population | 8,025 (49.1%) |
| Female Population | 8,316 (50.9%) |
| Population change (1975 to 2020) | +673.4% |
| Population change (2000 to 2020) | +83.9% |
| Median Age | 32.2 years (Male: 31.4, Female: 33.1) |
| GDP per capita (PPP) | $10,293 (2022) |
| Neighborhoods | Barrio Chumamaya, Barrio Los Olivos |
| Local Time | |
| Timezone | Argentina Standard Time |
| Lat & Lng | -32.34288, -65.01396 |
Map of Merlo
Interactive Map
Merlo Population
Years 1975 to 2030
| Data | 1975 | 1990 | 2000 | 2015 | 2020 | 2025* | 2030* |
|---|---|---|---|---|---|---|---|
| Population | 2,113 | 5,320 | 8,888 | 15,684 | 16,341 | 17,147 | 17,829 |
| Population Density | 139.7 / km² | 351.7 / km² | 587.6 / km² | 1,037 / km² | 1,080.4 / km² | 1,133.7 / km² | 1,178.8 / km² |
Merlo Population change from 2000 to 2020
Increase of 83.9% from year 2000 to 2020
| Location | Change since 1975 | Change since 1990 | Change since 2000 |
|---|---|---|---|
| Merlo | +673.4% | +207.2% | +83.9% |
| San Luis Province | — | — | — |
| Argentina | — | — | — |
Merlo Median Age
Median Age: 32.2 years
| Location | Median Age | Median Age (Female) | Median Age (Male) |
|---|---|---|---|
| Merlo | 32.2 yrs | 33.1 yrs | 31.4 yrs |
| San Luis Province | 28.4 yrs | 29 yrs | 27.7 yrs |
| Argentina | 29.8 yrs | 30.9 yrs | 28.7 yrs |
Merlo Population Density
Population Density: 1,080 / km²
| Location | Population | Area | Density |
|---|---|---|---|
| Merlo | 16,341 | 15.1 km² | 1,080 / km² |
| San Luis Province | 483,042 | 75,575.7 km² | 6.4 / km² |
| Argentina | 43.2 million | 2,779,516.9 km² | 15.5 / km² |
Merlo Historical and Projected Population
Estimated Population from 1870 to 2100
- JRC (European Commission's Joint Research Centre) work on the GHS built-up grid
- CIESIN (Center for International Earth Science Information Network)
- [Link] Klein Goldewijk, K., Beusen, A., Doelman, J., and Stehfest, E.: Anthropogenic land use estimates for the Holocene – HYDE 3.2, Earth Syst. Sci. Data, 9, 927–953, https://doi.org/10.5194/essd-9-927-2017, 2017.
Area Codes
Percentage Area Codes used by businesses in Merlo
Price Distribution
Business distribution by price for Merlo
Human Development Index (HDI)
Statistic composite index of life expectancy, education, and per capita income.
Merlo Gross Domestic Product (GDP)
GDP per capita, PPP (constant 2017 international $)
| Data | 1990 | 1995 | 2000 | 2005 | 2010 | 2015 | 2020 | 2022 |
|---|---|---|---|---|---|---|---|---|
| GDP per capita | $10,353 | $12,337 | $13,107 | $13,654 | $14,422 | $13,055 | $8,925 | $10,293 |
| Total GDP | $12.8M | $15.7M | $16.9M | $18M | $19.5M | $18.3M | $12.9M | $14.9M |
Merlo CO2 Emissions
Carbon Dioxide (CO2) Emissions Per Capita in Tonnes Per Year
| Location | CO2 Emissions | CO2 Emissions Per Capita | CO2 Emissions Intensity |
|---|---|---|---|
| Merlo | 79,535 tn | 4.87 tn | 5,258.5 tons/km² |
| San Luis Province | 2,163,295 tn | 4.48 tn | 28.6 tons/km² |
| Argentina | 198,107,945 tn | 4.59 tn | 71.3 tons/km² |
| 2013 CO2 emissions (tonnes/year) | 79,535 tn |
| 2013 CO2 emissions (tonnes/year) per capita | 4.87 tn |
| 2013 CO2 emissions intensity (tonnes/km²/year) | 5,258.5 tons/km² |
Natural Hazards Risk
Relative risk out of 10
| Hazard | Risk Level |
|---|---|
| Drought | Medium (7) |
| Flood | Medium (4) |
| Earthquake | Medium (4) |
* Risk, particularly concerning flood or landslide, may not be for the entire area.
- Dilley, M., R.S. Chen, U. Deichmann, A.L. Lerner-Lam, M. Arnold, J. Agwe, P. Buys, O. Kjekstad, B. Lyon, and G. Yetman. 2005. Natural Disaster Hotspots: A Global Risk Analysis. Washington, D.C.: World Bank. https://doi.org/10.1596/0-8213-5930-4.
- Center for Hazards and Risk Research - CHRR - Columbia University, Center for International Earth Science Information Network - CIESIN - Columbia University, and International Research Institute for Climate and Society - IRI - Columbia University. 2005. Global Drought Hazard Frequency and Distribution. Palisades, NY: NASA Socioeconomic Data and Applications Center (SEDAC). https://doi.org/10.7927/H4VX0DFT.
- Center for Hazards and Risk Research - CHRR - Columbia University, Center for International Earth Science Information Network - CIESIN - Columbia University. 2005. Global Flood Hazard Frequency and Distribution. Palisades, NY: NASA Socioeconomic Data and Applications Center (SEDAC). https://doi.org/10.7927/H4668B3D.
- Center for Hazards and Risk Research - CHRR - Columbia University, Center for International Earth Science Information Network - CIESIN - Columbia University. 2005. Global Earthquake Hazard Distribution - Peak Ground Acceleration. Palisades, NY: NASA Socioeconomic Data and Applications Center (SEDAC). https://doi.org/10.7927/H4BZ63ZS.
Recent Nearby Earthquakes
Magnitude 3.0 and greater
| Date▼ | Time↕ | Magnitude↕ | Distance↕ | Depth↕ | Location↕ | Link |
|---|---|---|---|---|---|---|
| 8/12/19 | 2:30 AM | 4 | 27.4 km | 10,000 m | 17km NNW of Santa Rosa del Conlara, Argentina | usgs.gov |
| 6/15/19 | 5:15 AM | 3.4 | 51.4 km | 10,000 m | 9km NE of Villa Dolores, Argentina | usgs.gov |
| 4/18/18 | 3:29 PM | 3.9 | 4.5 km | 10,000 m | 4km NNE of Merlo, Argentina | usgs.gov |
| 7/22/16 | 1:25 AM | 3.8 | 71.2 km | 24,000 m | 7km ENE of Mina Clavero, Argentina | usgs.gov |
| 7/22/16 | 1:25 AM | 3.3 | 71.2 km | 24,000 m | 7km ENE of Mina Clavero, Argentina | usgs.gov |
| 6/26/16 | 4:17 AM | 3.2 | 58.6 km | 17,000 m | 14km SW of Mina Clavero, Argentina | usgs.gov |
| 10/12/15 | 4:36 AM | 3.1 | 86.3 km | 10,200 m | 17km NNW of Villa Cura Brochero, Argentina | usgs.gov |
| 9/12/13 | 1:43 AM | 4.7 | 69.3 km | 20,000 m | 3km E of Mina Clavero, Argentina | usgs.gov |
| 12/17/12 | 8:38 AM | 4.4 | 25.7 km | 20,000 m | San Luis, Argentina | usgs.gov |
| 1/19/11 | 10:52 AM | 3.6 | 45.9 km | 12,300 m | Cordoba, Argentina | usgs.gov |
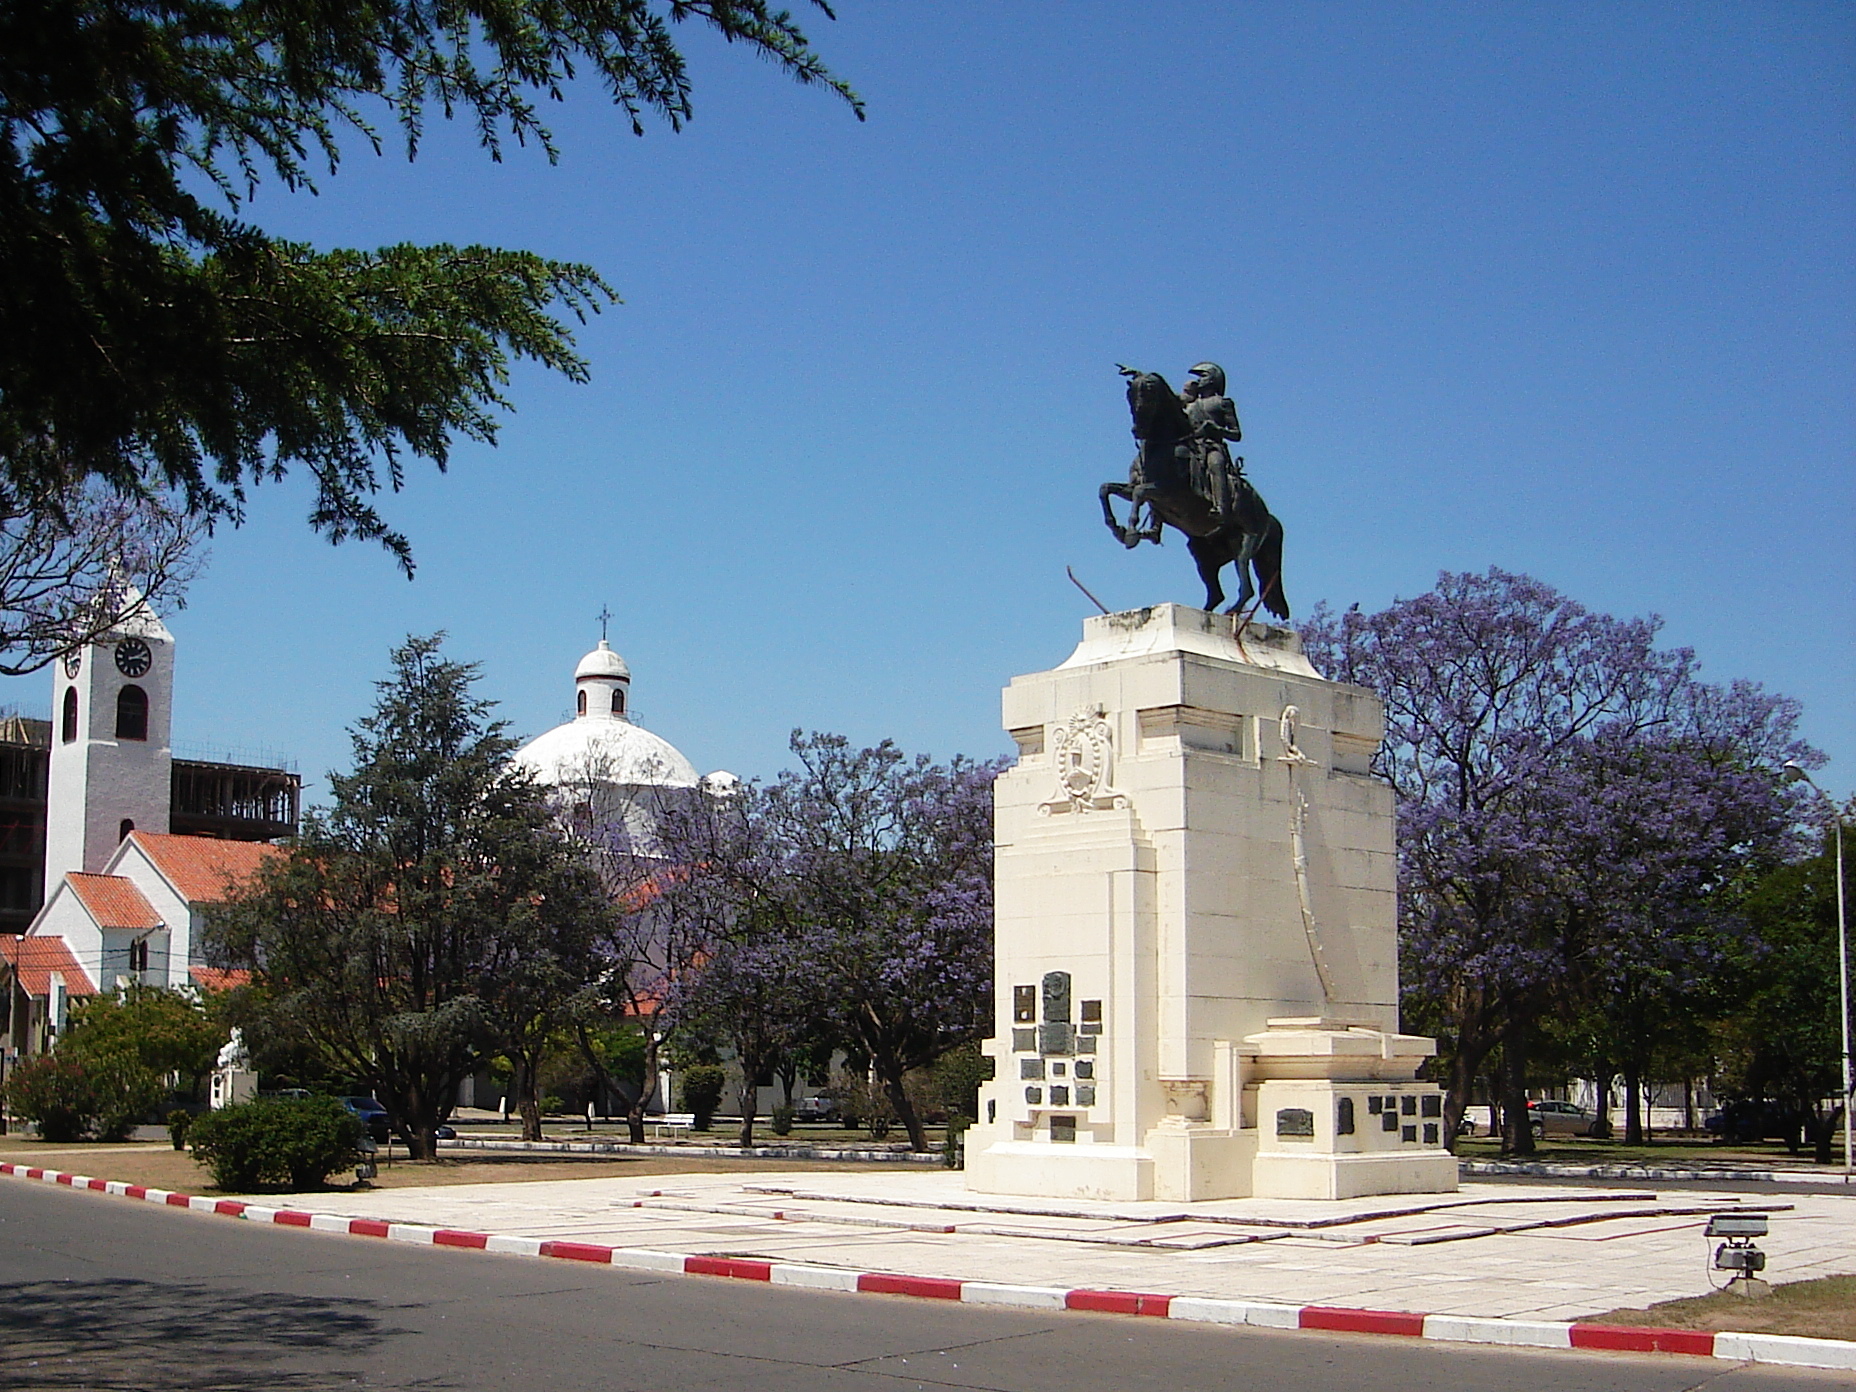
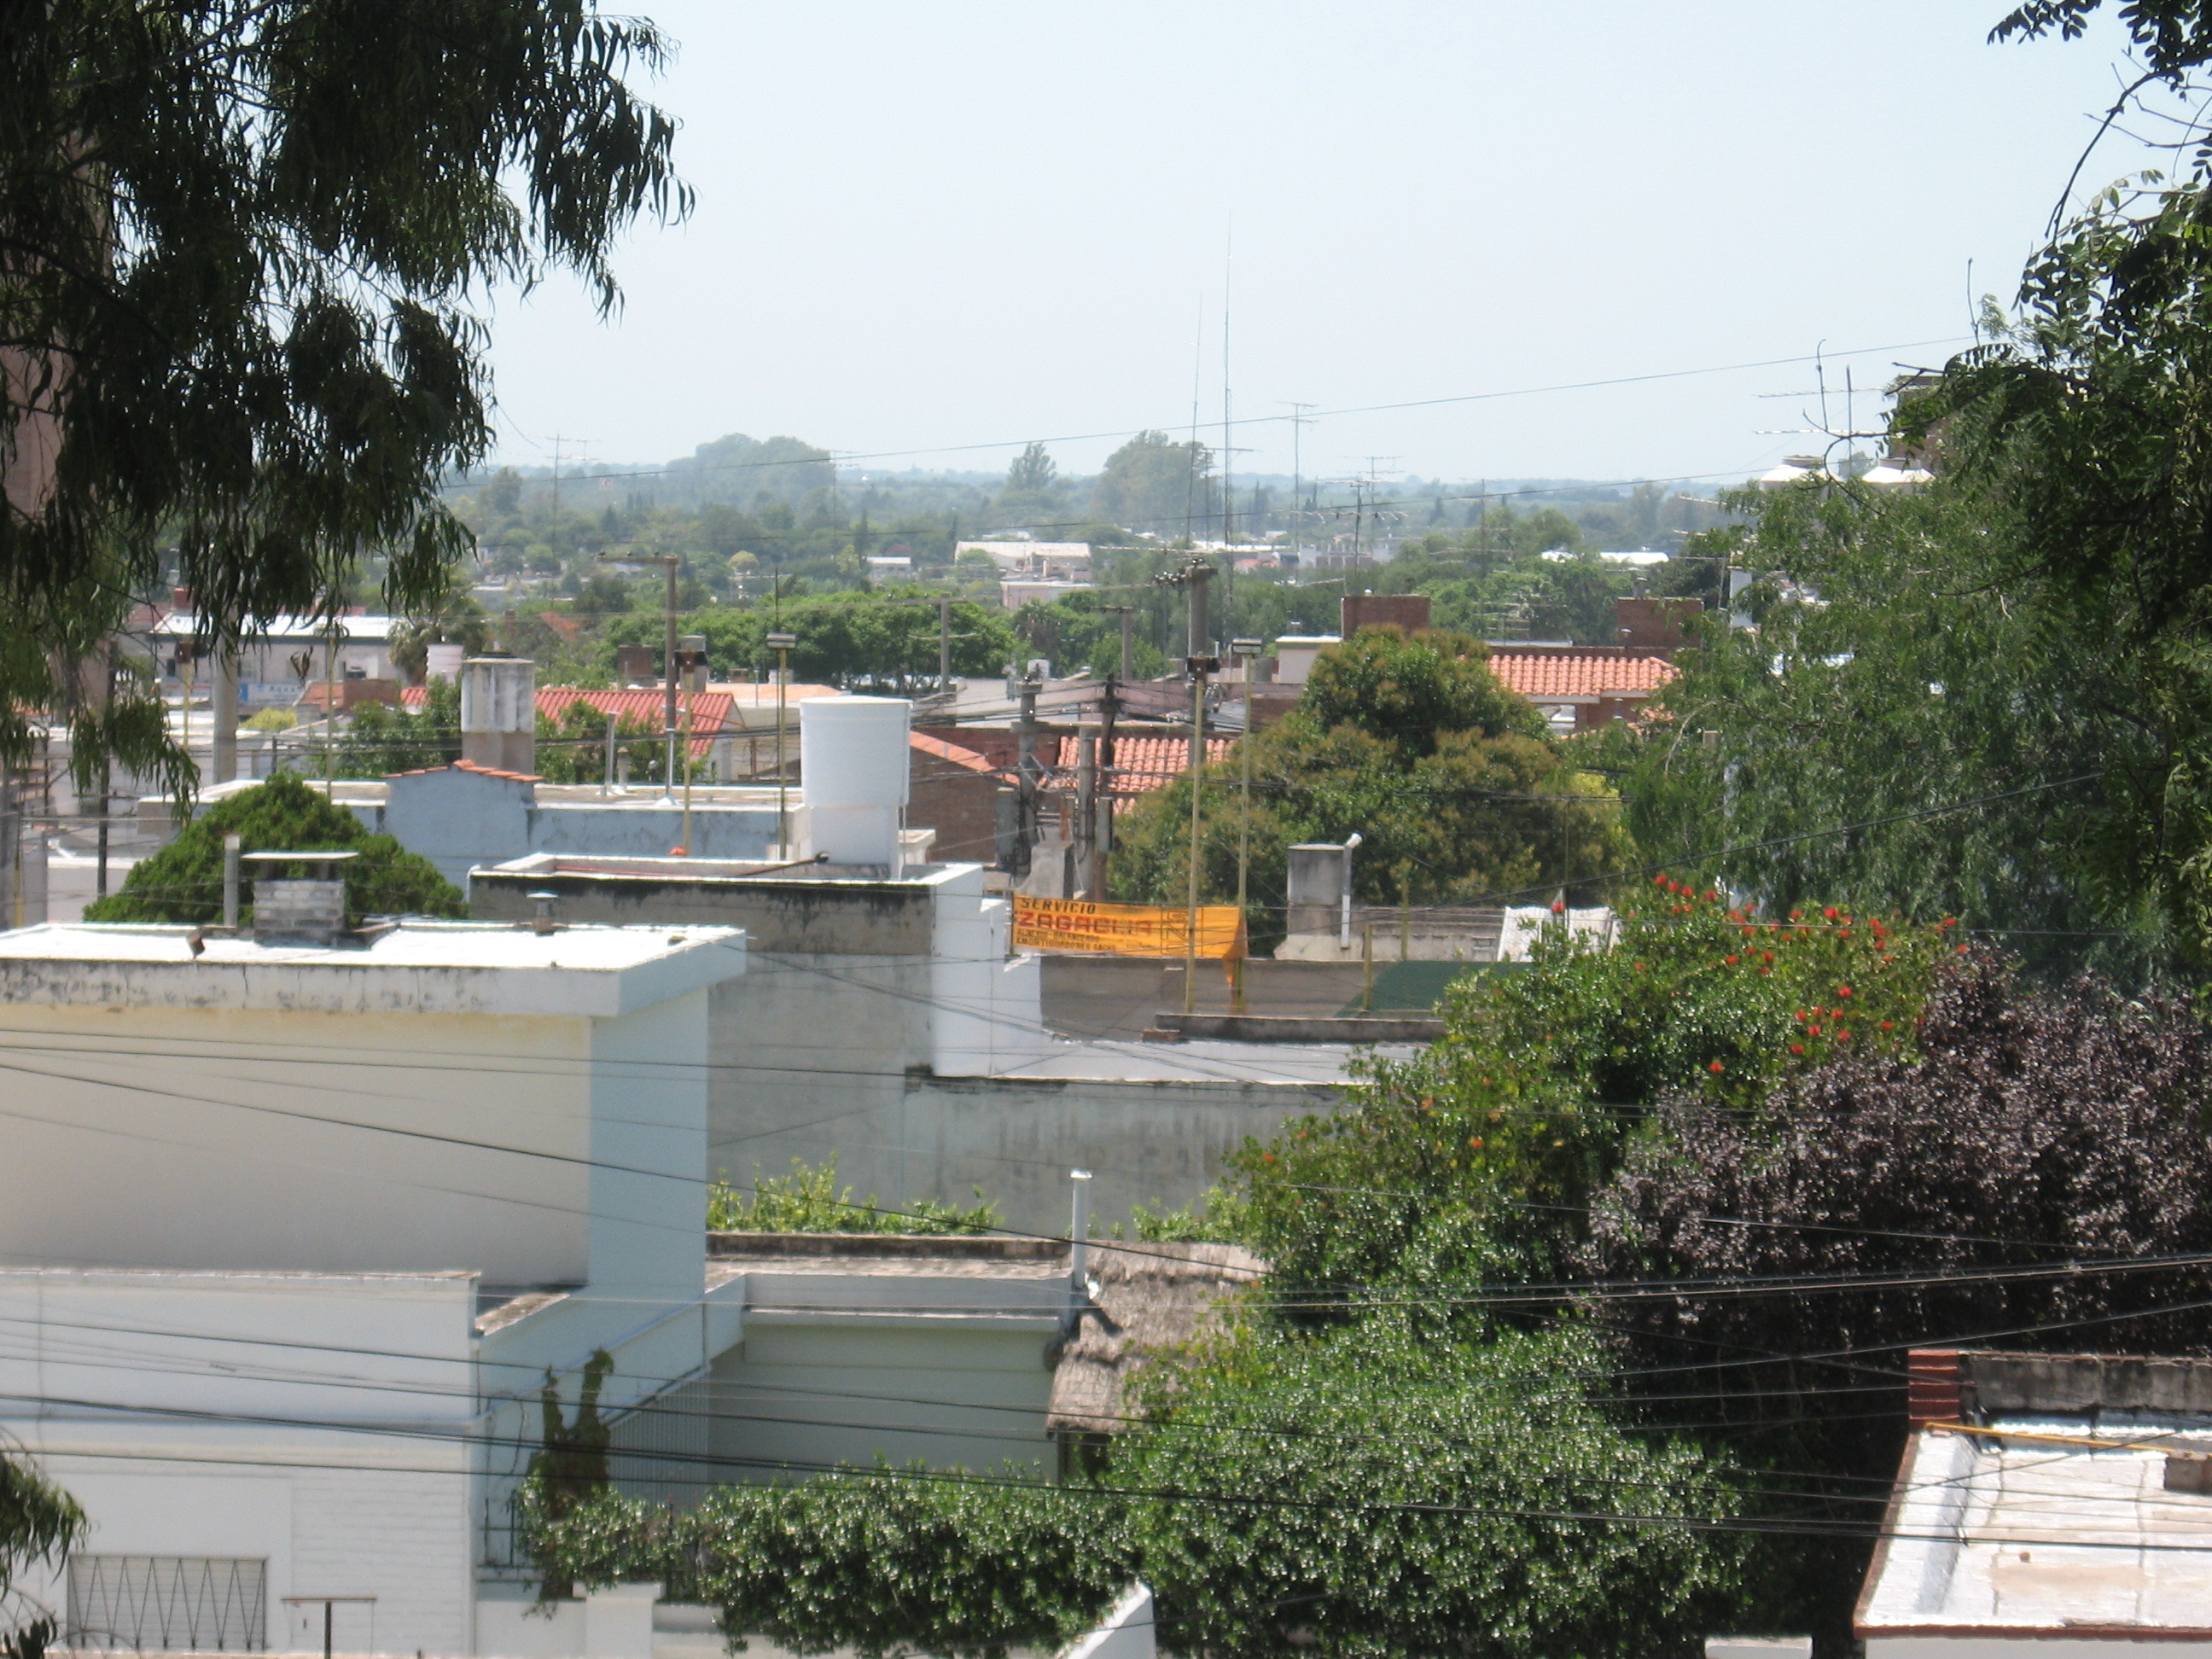
Villa de Merlo
Villa de Merlo lies 796 meters above sea level at 32° 36' 00" South, 66° 07' 60" West, in the Department of Junín, Province of San Luis, Argentina, a small city administered by an intendant, presently former Provincial Senator Gloria Petrino. The dem..
Villa de Merlo Wikipedia Page

About Our Data
The data on this page is estimated using a number of publicly available tools and resources. It is provided without warranty, and could contain inaccuracies. Use at your own risk.