Pagai Facts
| Area | 0.4 km² |
| Population | 117 |
| Male Population | 60 (51.2%) |
| Female Population | 57 (48.8%) |
| Population change (1975 to 2020) | +735.7% |
| Population change (2000 to 2020) | -4.9% |
| Median Age | 24 years (Male: 24.1, Female: 24) |
| Local Time | |
| Timezone | American Samoa Standard Time |
| Lat & Lng | -14.27500, -170.60528 |
Map of Pagai
Interactive Map
Pagai Population
Years 1975 to 2020
| Data | 1975 | 1990 | 2000 | 2015 | 2020 |
|---|---|---|---|---|---|
| Population | 14 | 92 | 123 | 116 | 117 |
| Population Density | 37.3 / km² | 245.3 / km² | 328 / km² | 309.3 / km² | 312 / km² |
Sources: JRC (European Commission's Joint Research Centre) work on the GHS built-up grid
Pagai Population change from 2000 to 2015
Decrease of 5.7% from year 2000 to 2015
| Location | Change since 1975 | Change since 1990 | Change since 2000 |
|---|---|---|---|
| Pagai | +728.6% | +26.1% | -5.7% |
| Eastern District, American Samoa | -34.6% | -2.7% | -10.1% |
Sources: JRC (European Commission's Joint Research Centre) work on the GHS built-up grid
Pagai Median Age
Median Age: 24 years
| Location | Median Age | Median Age (Female) | Median Age (Male) |
|---|---|---|---|
| Pagai | 24 yrs | 24 yrs | 24.1 yrs |
| Eastern District, American Samoa | 23.4 yrs | 23.9 yrs | 23 yrs |
Sources: CIESIN (Center for International Earth Science Information Network)
Pagai Population Density
Population Density: 312 / km²
| Location | Population | Area | Density |
|---|---|---|---|
| Pagai | 117 | 0.375 km² | 312 / km² |
| Eastern District, American Samoa | 16,304 | 54.3 km² | 300 / km² |
Sources: JRC (European Commission's Joint Research Centre) work on the GHS built-up grid
Pagai Historical and Projected Population
Estimated Population from 1700 to 2100
Sources:
- JRC (European Commission's Joint Research Centre) work on the GHS built-up grid
- CIESIN (Center for International Earth Science Information Network)
- [Link] Klein Goldewijk, K., Beusen, A., Doelman, J., and Stehfest, E.: Anthropogenic land use estimates for the Holocene – HYDE 3.2, Earth Syst. Sci. Data, 9, 927–953, https://doi.org/10.5194/essd-9-927-2017, 2017.
Human Development Index (HDI)
Statistic composite index of life expectancy, education, and per capita income.
Source: [Link] Kummu, M., Taka, M. &Guillaume, J. Gridded global datasets for Gross Domestic Product and Human Development Index over 1990–2015. Sci Data 5, 180004 (2018) doi:10.1038/sdata.2018.4
Pagai CO2 Emissions
Carbon Dioxide (CO2) Emissions Per Capita in Tonnes Per Year
| Location | CO2 Emissions | CO2 Emissions Per Capita | CO2 Emissions Intensity |
|---|---|---|---|
| Pagai | 1,730 tn | 14.79 tn | 4,614 tons/km² |
| Eastern District, American Samoa | 243,675 tn | 14.95 tn | 4,484.1 tons/km² |
Sources: [Link] Moran, D., Kanemoto K; Jiborn, M., Wood, R., Többen, J., and Seto, K.C. (2018) Carbon footprints of 13,000 cities. Environmental Research Letters DOI: 10.1088/1748-9326/aac72a
Pagai CO2 Emissions
| 2013 CO2 emissions (tonnes/year) | 1,730 tn |
| 2013 CO2 emissions (tonnes/year) per capita | 14.79 tn |
| 2013 CO2 emissions intensity (tonnes/km²/year) | 4,614 tons/km² |
Recent Nearby Earthquakes
Magnitude 3.0 and greater
| Date▼ | Time↕ | Magnitude↕ | Distance↕ | Depth↕ | Location↕ | Link |
|---|---|---|---|---|---|---|
| 6/14/19 | 5:46 PM | 4.6 | 85.5 km | 10,000 m | 87km NNE of Aua, American Samoa | usgs.gov |
| 6/24/04 | 11:05 PM | 4.6 | 99.1 km | 10,000 m | Samoa Islands region | usgs.gov |
| 10/3/95 | 1:00 AM | 4.9 | 87.6 km | 38,300 m | Samoa Islands | usgs.gov |
| 1/20/95 | 11:20 AM | 4.7 | 87.4 km | 33,000 m | Samoa Islands | usgs.gov |
| 10/19/84 | 1:28 AM | 5.4 | 89.9 km | 33,000 m | Samoa Islands | usgs.gov |
Source: U.S. Geological Survey (USGS)
Pagai
Pagai is a village on the southeast coast of Tutuila Island, American Samoa. It is located on the edge of Faga'itua Bay, and in between the villages of Faga'itua and Alofau. Pagai is six miles east of Pago Pago.
Pagai Wikipedia Page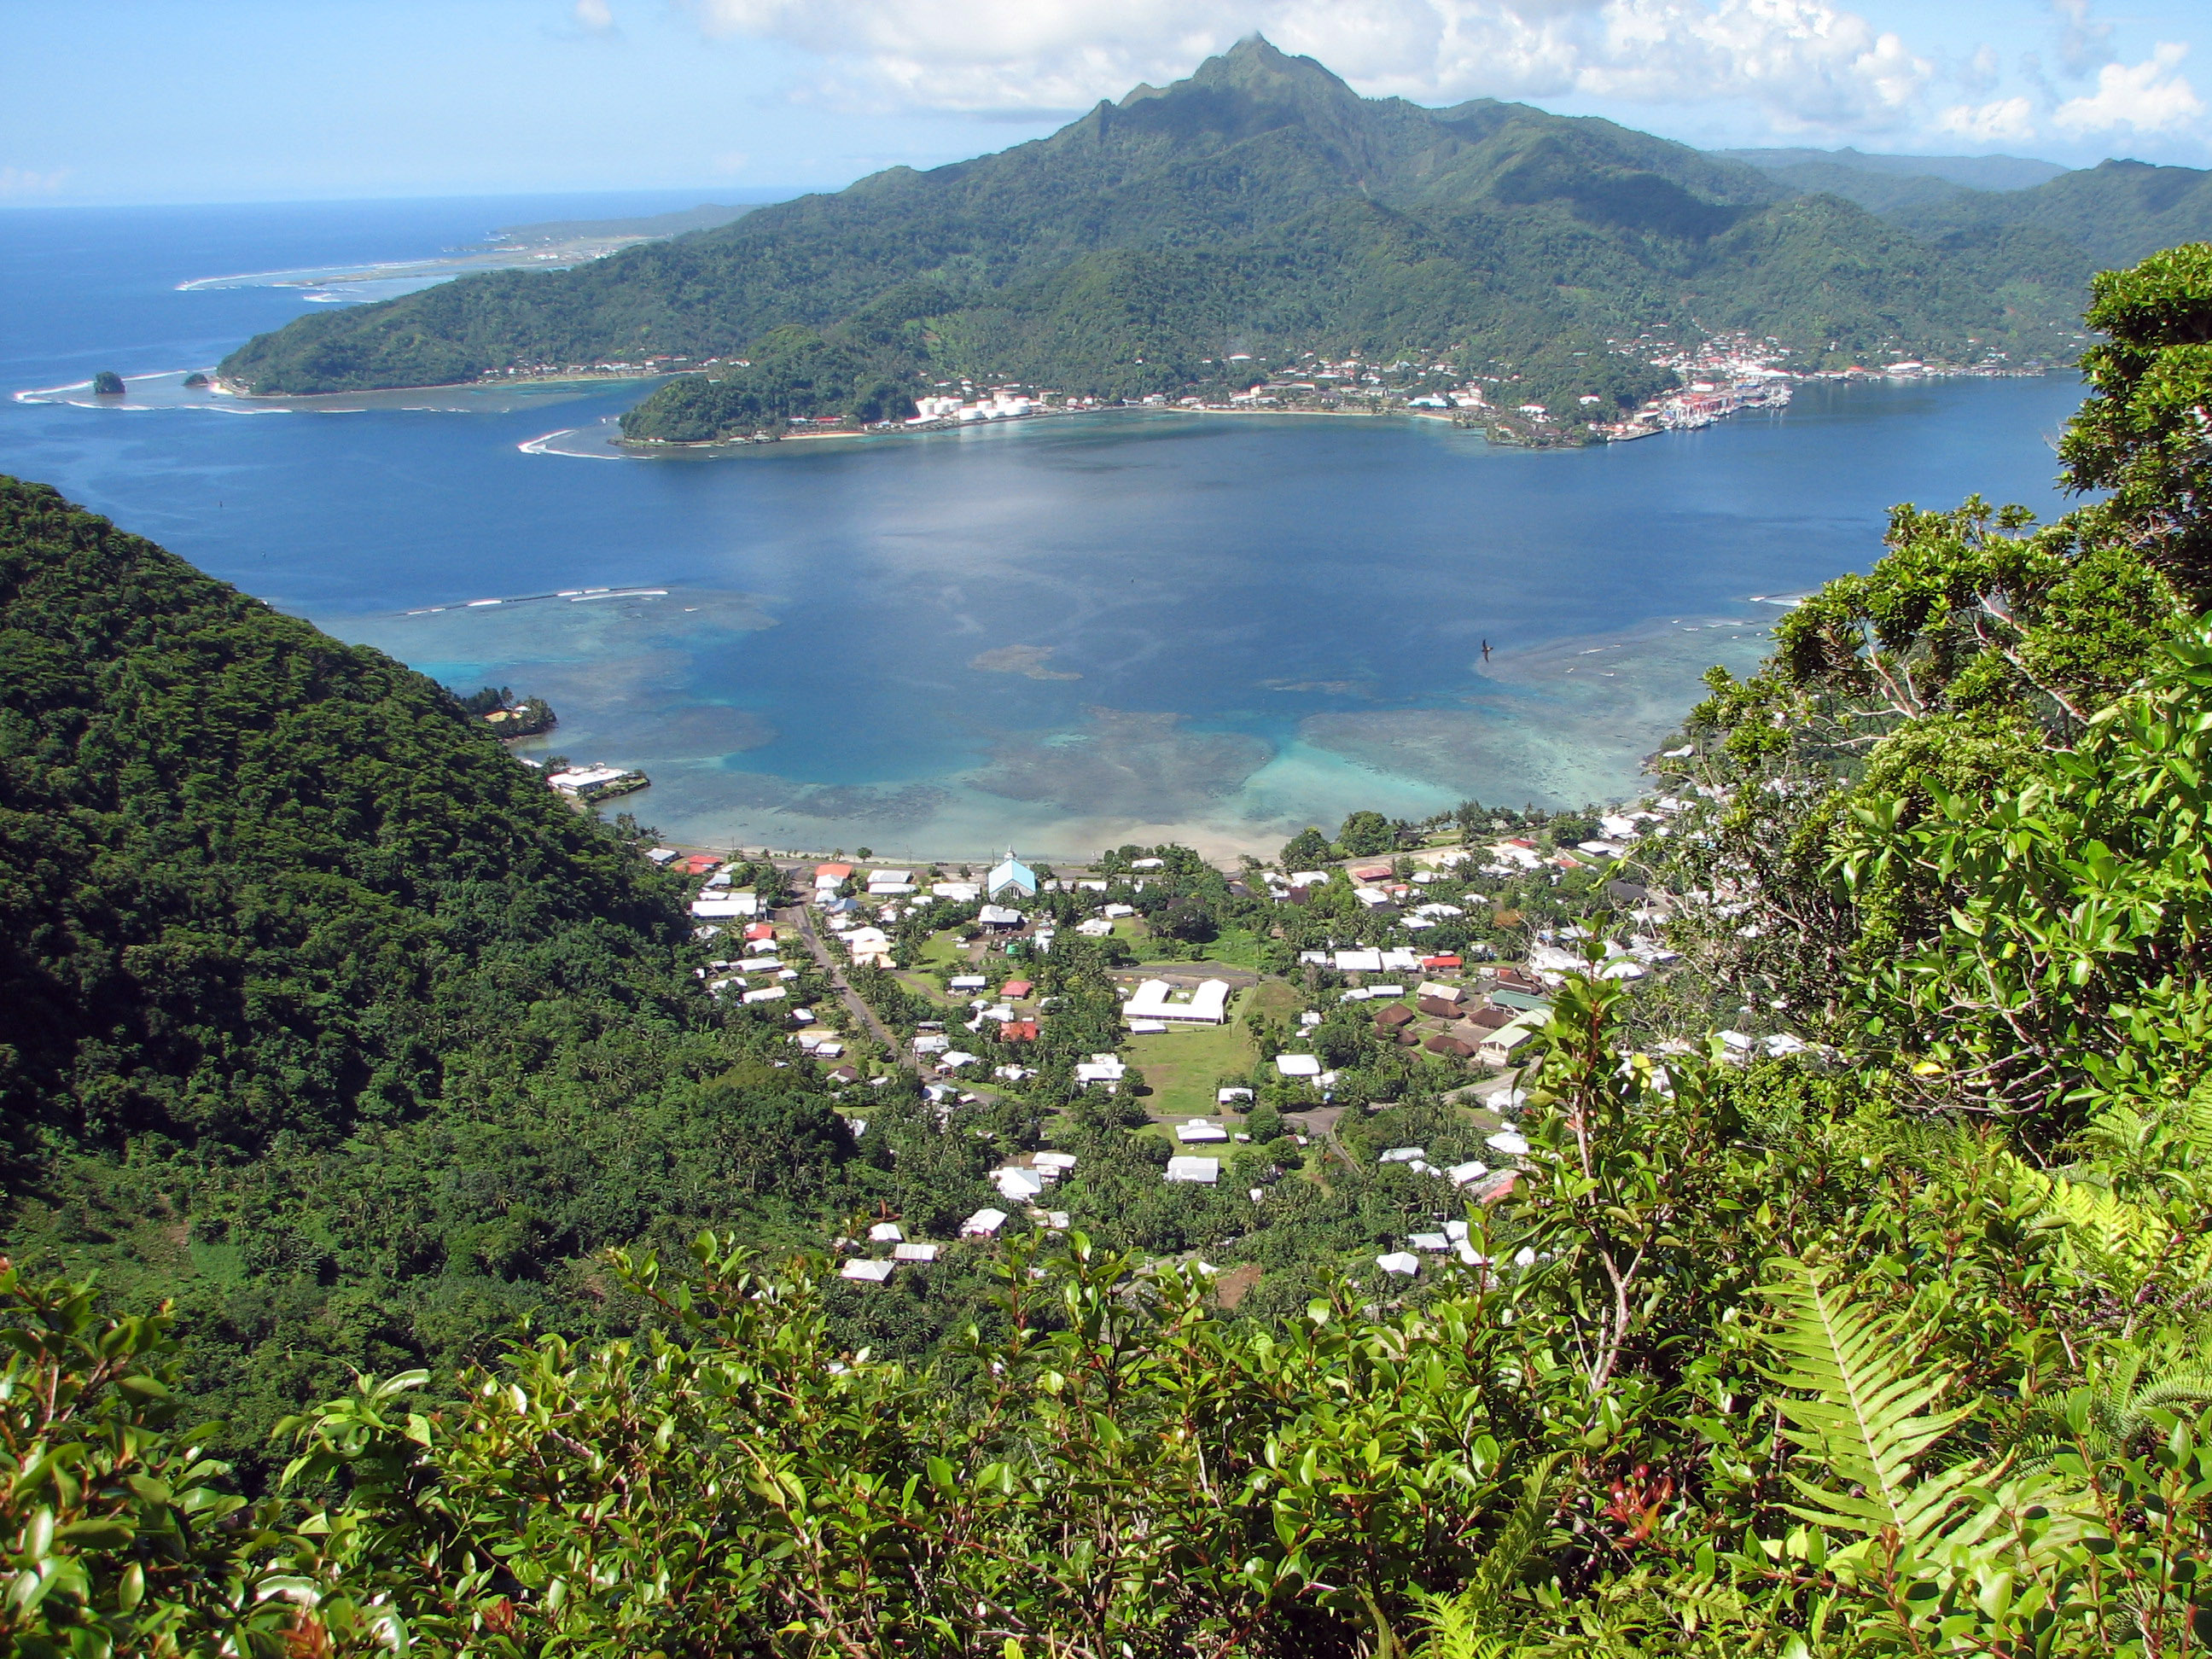


About Our Data
The data on this page is estimated using a number of publicly available tools and resources. It is provided without warranty, and could contain inaccuracies. Use at your own risk.