Categories in Dürnstein
Industries
Business Distribution by Industry in Dürnstein
| Industry Description | Number of Establishments | Average Google Rating |
|---|---|---|
| All food and beverage | 22 | 4.1 |
| Grocery stores and supermarkets | 20 | 4.1 |
| Other accommodation | 19 | 4.4 |
| Winery | 15 | 3.9 |
| Shopping | 14 | 4.4 |
| Hotels and motels | 12 | 4.4 |
| Restaurants | 11 | 4.3 |
Dürnstein Facts
| Area | 16.6 km² |
| Population | 882 |
| Male Population | 424 (48.0%) |
| Female Population | 458 (52.0%) |
| Population change (1975 to 2020) | -24.0% |
| Population change (2000 to 2020) | -8.0% |
| Median Age | 46.8 years (Male: 46, Female: 47.5) |
| Area Codes | 2711, 2732 |
| Neighborhoods | Oberloiben, Unterloiben, Dürnsteiner Waldhütten |
| Local Time | |
| Timezone | Central European Summer Time |
| Lat & Lng | 48.39582, 15.51973 |
| Postal Codes | 3512, 3601 |
Map of Dürnstein
Interactive Map
Dürnstein Population
Years 1975 to 2020
| Data | 1975 | 1990 | 2000 | 2015 | 2020 |
|---|---|---|---|---|---|
| Population | 1,161 | 1,016 | 959 | 861 | 882 |
| Population Density | 69.8 / km² | 61.1 / km² | 57.7 / km² | 51.8 / km² | 53.1 / km² |
Dürnstein Population change from 2000 to 2015
Decrease of 10.2% from year 2000 to 2015
| Location | Change since 1975 | Change since 1990 | Change since 2000 |
|---|---|---|---|
| Dürnstein | -25.8% | -15.3% | -10.2% |
| Lower Austria | +10.3% | +9.9% | +5.6% |
| Austria | +12.1% | +10.9% | +6.1% |
Dürnstein Median Age
Median Age: 46.8 years
| Location | Median Age | Median Age (Female) | Median Age (Male) |
|---|---|---|---|
| Dürnstein | 46.8 yrs | 47.5 yrs | 46 yrs |
| Lower Austria | 43.4 yrs | 44.4 yrs | 42.3 yrs |
| Austria | 42.3 yrs | 43.5 yrs | 41.1 yrs |
Dürnstein Population Density
Population Density: 53.1 / km²
| Location | Population | Area | Density |
|---|---|---|---|
| Dürnstein | 882 | 16.6 km² | 53.1 / km² |
| Lower Austria | 1.6 million | 19,195.1 km² | 85.7 / km² |
| Austria | 8.5 million | 83,905.5 km² | 102 / km² |
Dürnstein Historical and Projected Population
Estimated Population from 0 to 2100
- JRC (European Commission's Joint Research Centre) work on the GHS built-up grid
- CIESIN (Center for International Earth Science Information Network)
- [Link] Klein Goldewijk, K., Beusen, A., Doelman, J., and Stehfest, E.: Anthropogenic land use estimates for the Holocene – HYDE 3.2, Earth Syst. Sci. Data, 9, 927–953, https://doi.org/10.5194/essd-9-927-2017, 2017.
Neighborhoods in Dürnstein
Percentage of businesses by neighborhood in Dürnstein
Area Codes
Percentage Area Codes used by businesses in Dürnstein
Price Distribution
Business distribution by price for Dürnstein
Human Development Index (HDI)
Statistic composite index of life expectancy, education, and per capita income.
Dürnstein CO2 Emissions
Carbon Dioxide (CO2) Emissions Per Capita in Tonnes Per Year
| Location | CO2 Emissions | CO2 Emissions Per Capita | CO2 Emissions Intensity |
|---|---|---|---|
| Dürnstein | 9,334 tn | 10.58 tn | 561.4 tons/km² |
| Lower Austria | 18,266,371 tn | 11.11 tn | 951.6 tons/km² |
| Austria | 91,216,590 tn | 10.69 tn | 1,087.1 tons/km² |
| 2013 CO2 emissions (tonnes/year) | 9,334 tn |
| 2013 CO2 emissions (tonnes/year) per capita | 10.58 tn |
| 2013 CO2 emissions intensity (tonnes/km²/year) | 561.4 tons/km² |
Natural Hazards Risk
Relative risk out of 10
| Hazard | Risk Level |
|---|---|
| Flood | Medium (4) |
| Earthquake | Low (3) |
* Risk, particularly concerning flood or landslide, may not be for the entire area.
- Dilley, M., R.S. Chen, U. Deichmann, A.L. Lerner-Lam, M. Arnold, J. Agwe, P. Buys, O. Kjekstad, B. Lyon, and G. Yetman. 2005. Natural Disaster Hotspots: A Global Risk Analysis. Washington, D.C.: World Bank. https://doi.org/10.1596/0-8213-5930-4.
- Center for Hazards and Risk Research - CHRR - Columbia University, Center for International Earth Science Information Network - CIESIN - Columbia University. 2005. Global Flood Hazard Frequency and Distribution. Palisades, NY: NASA Socioeconomic Data and Applications Center (SEDAC). https://doi.org/10.7927/H4668B3D.
- Center for Hazards and Risk Research - CHRR - Columbia University, Center for International Earth Science Information Network - CIESIN - Columbia University. 2005. Global Earthquake Hazard Distribution - Peak Ground Acceleration. Palisades, NY: NASA Socioeconomic Data and Applications Center (SEDAC). https://doi.org/10.7927/H4BZ63ZS.
Recent Nearby Earthquakes
Magnitude 3.0 and greater
| Date▼ | Time↕ | Magnitude↕ | Distance↕ | Depth↕ | Location↕ | Link |
|---|---|---|---|---|---|---|
| 4/25/16 | 10:28 AM | 4.2 | 57.5 km | 3,460 m | 3km NNE of Heiligenkreuz, Austria | usgs.gov |
| 10/2/13 | 5:17 PM | 3.6 | 84 km | 11,550 m | 2km SW of Mitterndorf an der Fischa, Austria | usgs.gov |
| 9/20/13 | 2:06 AM | 4.2 | 88.1 km | 14,570 m | 1km SSE of Leithaprodersdorf, Austria | usgs.gov |
| 5/7/09 | 9:27 PM | 4.2 | 92.6 km | 11,900 m | Austria | usgs.gov |
| 12/7/08 | 2:47 AM | 3.9 | 75.9 km | 10,000 m | Austria | usgs.gov |
| 6/3/08 | 7:42 PM | 3.1 | 83 km | 6,600 m | Austria | usgs.gov |
| 2/26/08 | 7:57 PM | 3.9 | 88.1 km | 10,000 m | Austria | usgs.gov |
| 1/30/08 | 2:54 PM | 3.8 | 90.1 km | 10,000 m | Austria | usgs.gov |
| 7/25/05 | 3:06 AM | 4.1 | 86.6 km | 12,100 m | Austria | usgs.gov |
| 12/11/03 | 1:38 AM | 3.3 | 25.8 km | 10,000 m | Austria | usgs.gov |
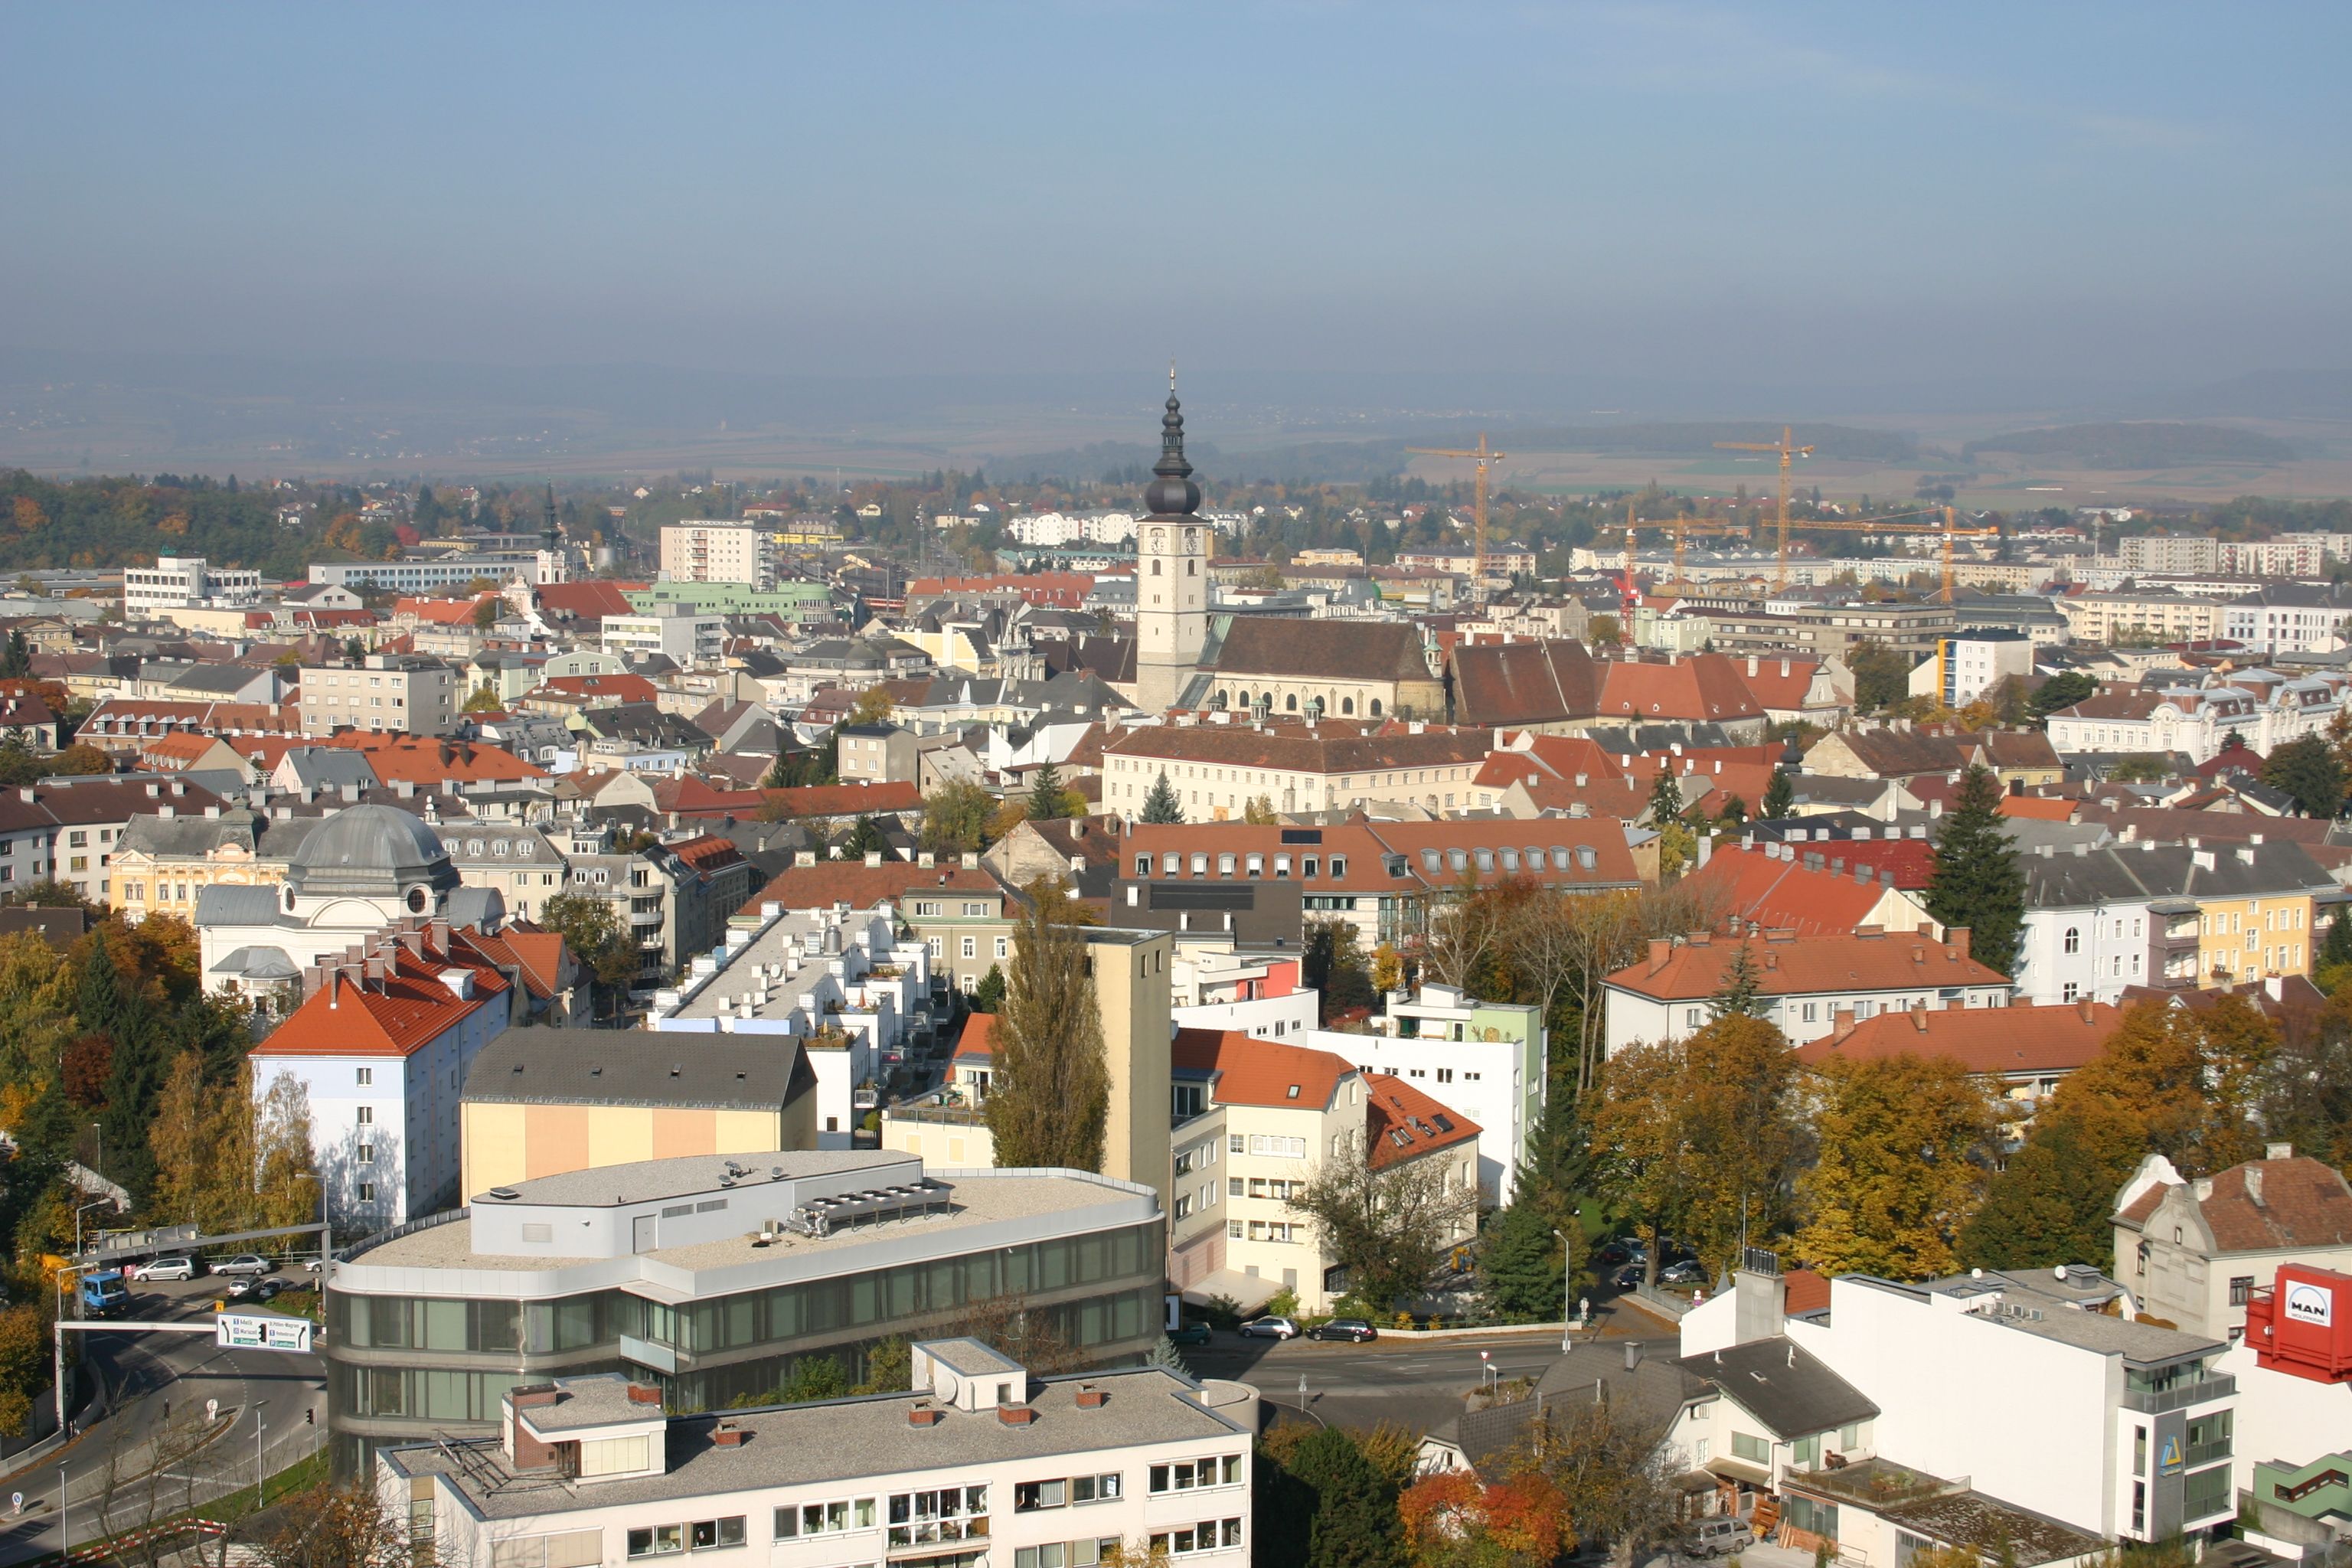
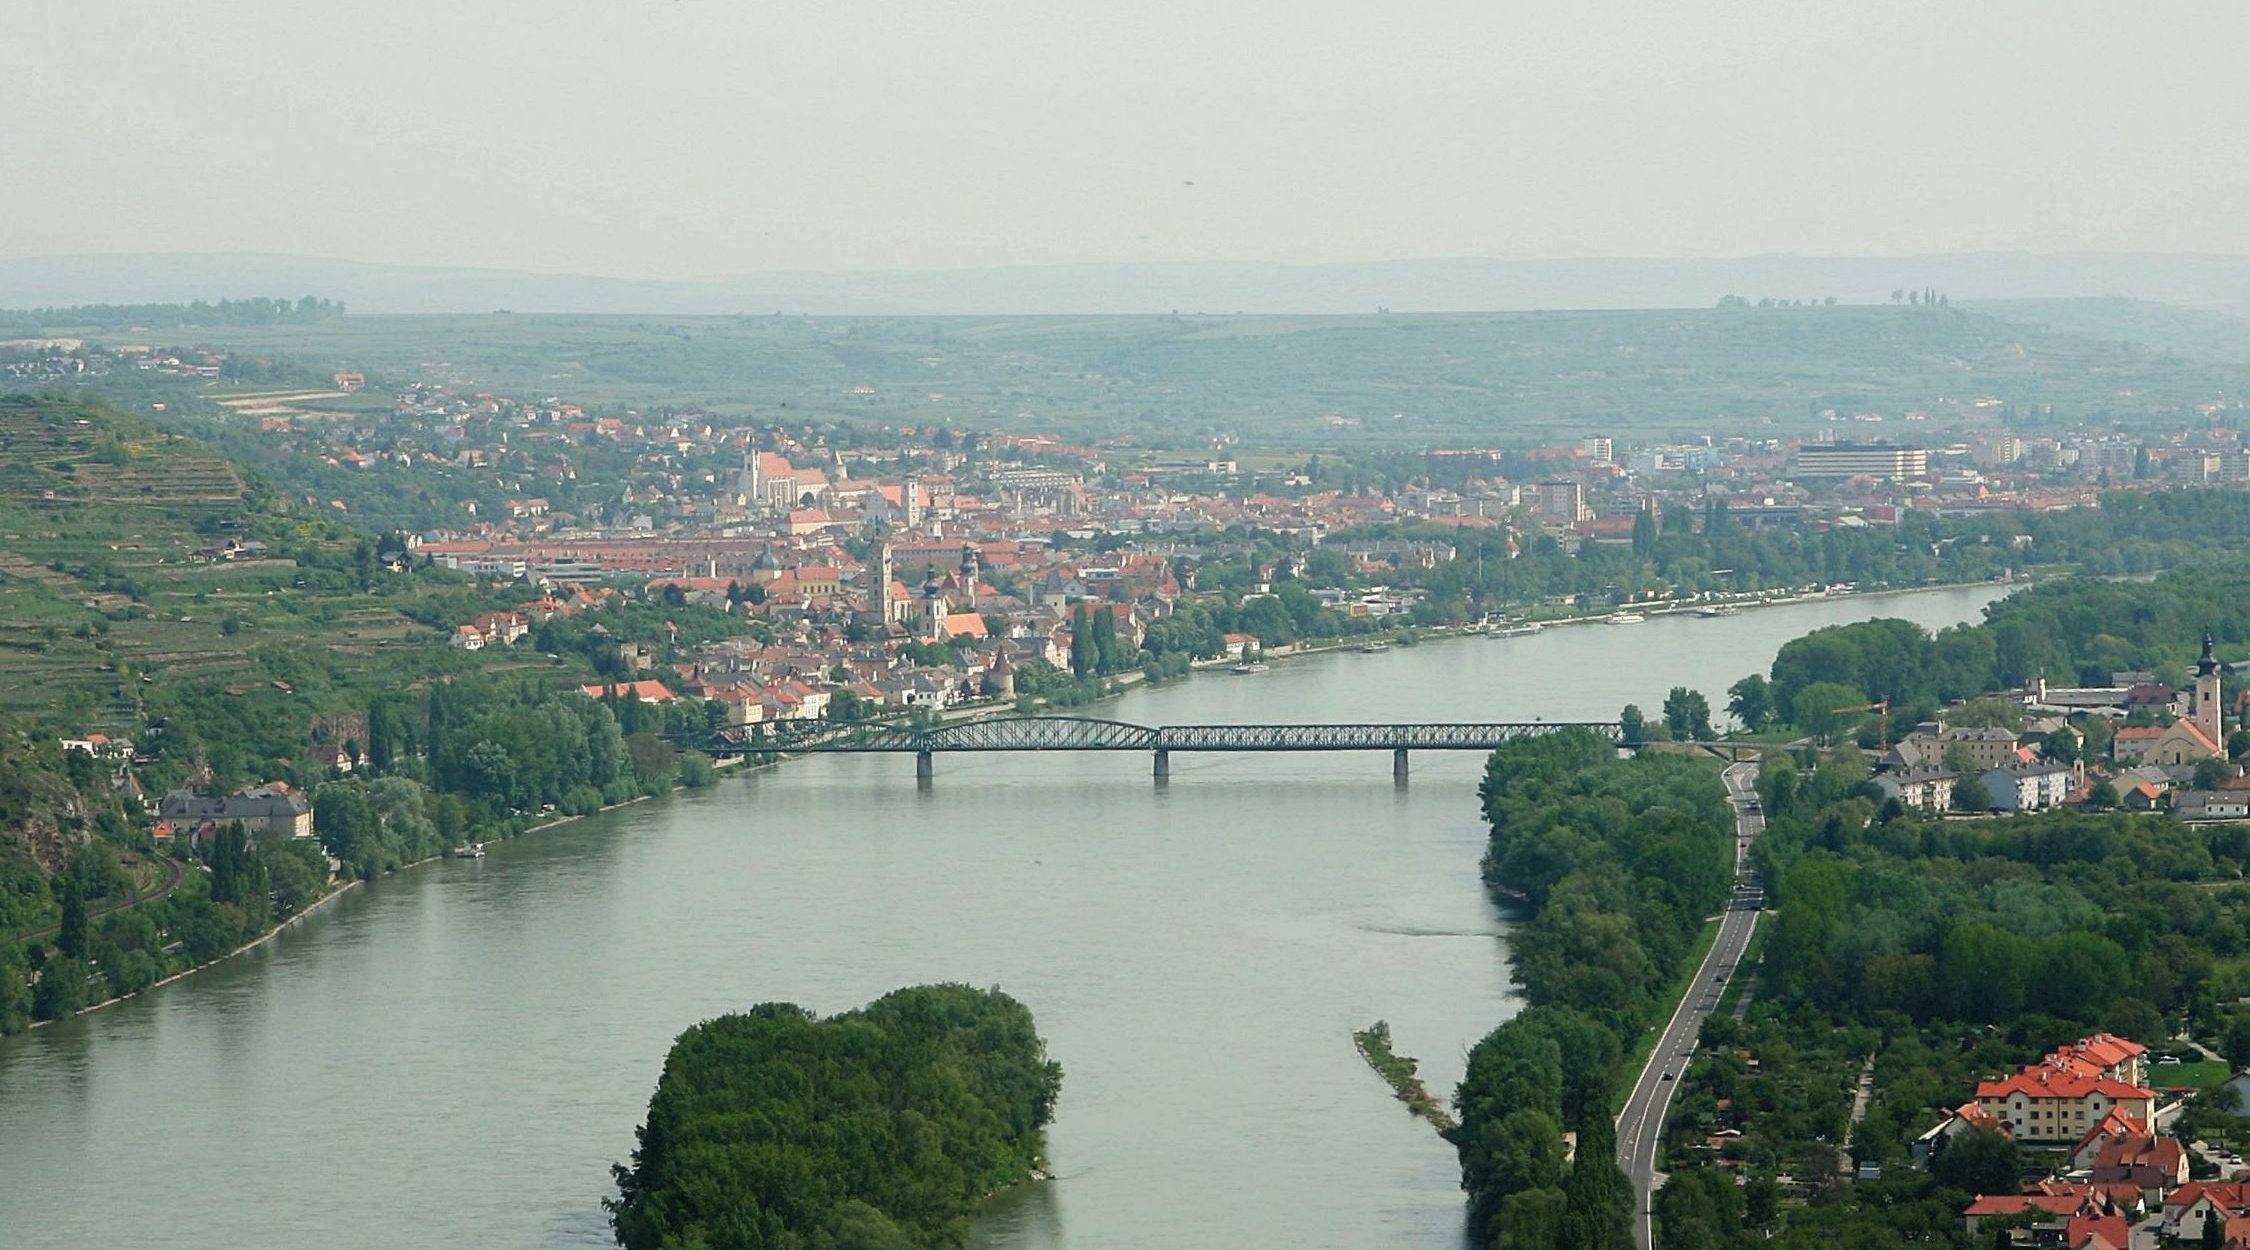
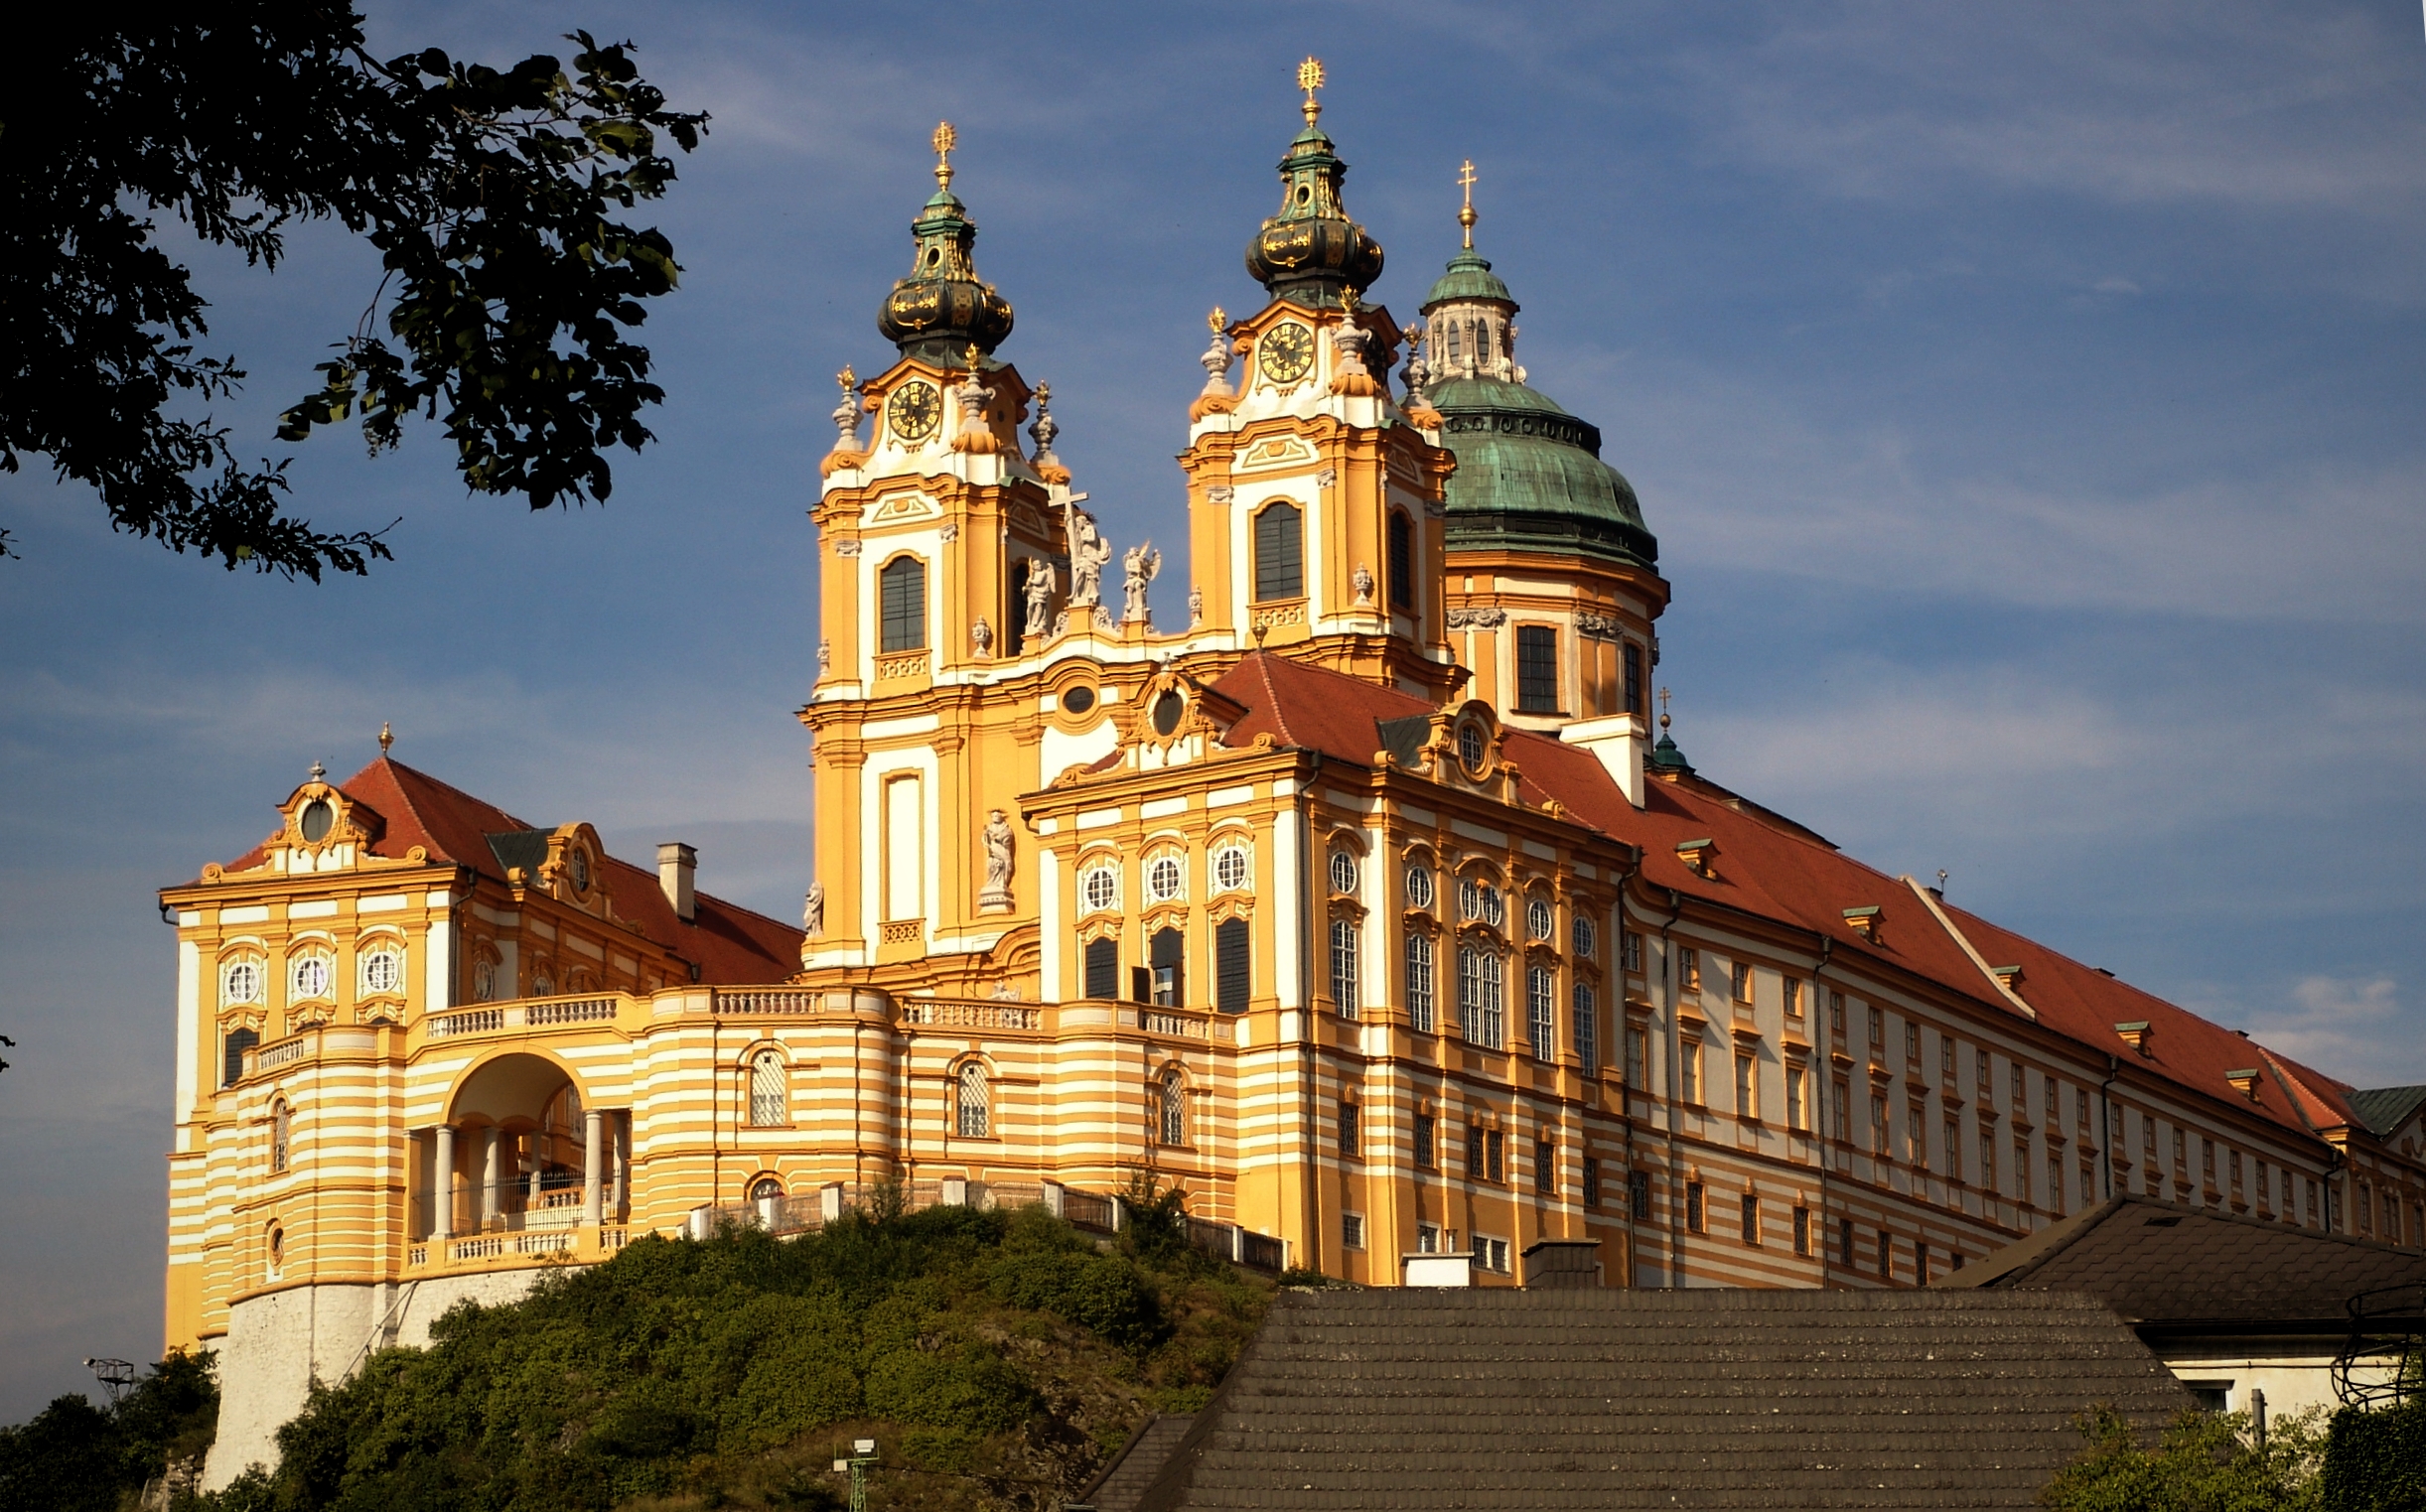
Dürnstein
Dürnstein is a small town on the Danube river in the Krems-Land district, in the Austrian state of Lower Austria. It is one of the most visited tourist destinations in the Wachau region and also a well-known wine growing area. The municipality consis..
Dürnstein Wikipedia Page
About Our Data
The data on this page is estimated using a number of publicly available tools and resources. It is provided without warranty, and could contain inaccuracies. Use at your own risk.