Categories in Captains Flat
Captains Flat Facts
| Area | 2.8 km² |
| Population | 654 |
| Male Population | 330 (50.5%) |
| Female Population | 324 (49.5%) |
| Population change (1975 to 2020) | +49.0% |
| Population change (2000 to 2020) | +14.3% |
| Median Age | 39 years (Male: 38.5, Female: 40.1) |
| Local Time | |
| Timezone | Australian Eastern Standard Time |
| Lat & Lng | -35.59110, 149.44524 |
| Postal Codes | 2623 |
Map of Captains Flat
Interactive Map
Captains Flat Population
Years 1975 to 2020
| Data | 1975 | 1990 | 2000 | 2015 | 2020 |
|---|---|---|---|---|---|
| Population | 439 | 528 | 572 | 614 | 654 |
| Population Density | 156.1 / km² | 187.7 / km² | 203.4 / km² | 218.3 / km² | 232.5 / km² |
Captains Flat Population change from 2000 to 2015
Increase of 7.3% from year 2000 to 2015
| Location | Change since 1975 | Change since 1990 | Change since 2000 |
|---|---|---|---|
| Captains Flat | +39.9% | +16.3% | +7.3% |
| New South Wales | +72.6% | +40.2% | +25.4% |
| Australia | +72.6% | +40.3% | +25.5% |
Captains Flat Median Age
Median Age: 39 years
| Location | Median Age | Median Age (Female) | Median Age (Male) |
|---|---|---|---|
| Captains Flat | 39 yrs | 40.1 yrs | 38.5 yrs |
| New South Wales | 38.3 yrs | 39.2 yrs | 37.4 yrs |
| Australia | 37.7 yrs | 38.6 yrs | 36.8 yrs |
Captains Flat Population Density
Population Density: 233 / km²
| Location | Population | Area | Density |
|---|---|---|---|
| Captains Flat | 654 | 2.813 km² | 233 / km² |
| New South Wales | 7.7 million | 801,634.1 km² | 9.6 / km² |
| Australia | 23.8 million | 7,690,961.5 km² | 3.1 / km² |
Captains Flat Historical and Projected Population
Estimated Population from 1830 to 2100
- JRC (European Commission's Joint Research Centre) work on the GHS built-up grid
- CIESIN (Center for International Earth Science Information Network)
- [Link] Klein Goldewijk, K., Beusen, A., Doelman, J., and Stehfest, E.: Anthropogenic land use estimates for the Holocene – HYDE 3.2, Earth Syst. Sci. Data, 9, 927–953, https://doi.org/10.5194/essd-9-927-2017, 2017.
Human Development Index (HDI)
Statistic composite index of life expectancy, education, and per capita income.
Captains Flat CO2 Emissions
Carbon Dioxide (CO2) Emissions Per Capita in Tonnes Per Year
| Location | CO2 Emissions | CO2 Emissions Per Capita | CO2 Emissions Intensity |
|---|---|---|---|
| Captains Flat | 13,976 tn | 21.37 tn | 4,969.4 tons/km² |
| New South Wales | 133,365,481 tn | 17.39 tn | 166.4 tons/km² |
| Australia | 401,155,564 tn | 16.88 tn | 52.2 tons/km² |
| 2013 CO2 emissions (tonnes/year) | 13,976 tn |
| 2013 CO2 emissions (tonnes/year) per capita | 21.37 tn |
| 2013 CO2 emissions intensity (tonnes/km²/year) | 4,969.4 tons/km² |
Natural Hazards Risk
Relative risk out of 10
| Hazard | Risk Level |
|---|---|
| Drought | Low (2) |
| Earthquake | Medium (4) |
* Risk, particularly concerning flood or landslide, may not be for the entire area.
- Dilley, M., R.S. Chen, U. Deichmann, A.L. Lerner-Lam, M. Arnold, J. Agwe, P. Buys, O. Kjekstad, B. Lyon, and G. Yetman. 2005. Natural Disaster Hotspots: A Global Risk Analysis. Washington, D.C.: World Bank. https://doi.org/10.1596/0-8213-5930-4.
- Center for Hazards and Risk Research - CHRR - Columbia University, Center for International Earth Science Information Network - CIESIN - Columbia University, and International Research Institute for Climate and Society - IRI - Columbia University. 2005. Global Drought Hazard Frequency and Distribution. Palisades, NY: NASA Socioeconomic Data and Applications Center (SEDAC). https://doi.org/10.7927/H4VX0DFT.
- Center for Hazards and Risk Research - CHRR - Columbia University, Center for International Earth Science Information Network - CIESIN - Columbia University. 2005. Global Earthquake Hazard Distribution - Peak Ground Acceleration. Palisades, NY: NASA Socioeconomic Data and Applications Center (SEDAC). https://doi.org/10.7927/H4BZ63ZS.
Recent Nearby Earthquakes
Magnitude 3.0 and greater
| Date▼ | Time↕ | Magnitude↕ | Distance↕ | Depth↕ | Location↕ | Link |
|---|---|---|---|---|---|---|
| 4/19/12 | 7:09 PM | 3.7 | 86.3 km | 4,000 m | New South Wales, Australia | usgs.gov |
| 8/13/06 | 1:30 PM | 3.3 | 91.2 km | 3,000 m | New South Wales, Australia | usgs.gov |
| 4/21/06 | 8:11 AM | 3.1 | 90.8 km | 5,000 m | New South Wales, Australia | usgs.gov |
| 3/2/06 | 6:17 AM | 3.4 | 91.2 km | 3,000 m | New South Wales, Australia | usgs.gov |
| 12/1/03 | 2:29 PM | 3 | 71.6 km | 5,000 m | near the southeast coast of Australia | usgs.gov |
| 11/26/03 | 4:39 AM | 3 | 92.5 km | 0 m | New South Wales, Australia | usgs.gov |
| 1/14/03 | 1:43 PM | 3.1 | 75.2 km | 10,000 m | near the southeast coast of Australia | usgs.gov |
| 11/9/02 | 12:27 PM | 3.2 | 89.1 km | 10,000 m | New South Wales, Australia | usgs.gov |
| 7/2/92 | 6:45 PM | 3 | 98.8 km | 10,000 m | New South Wales, Australia | usgs.gov |
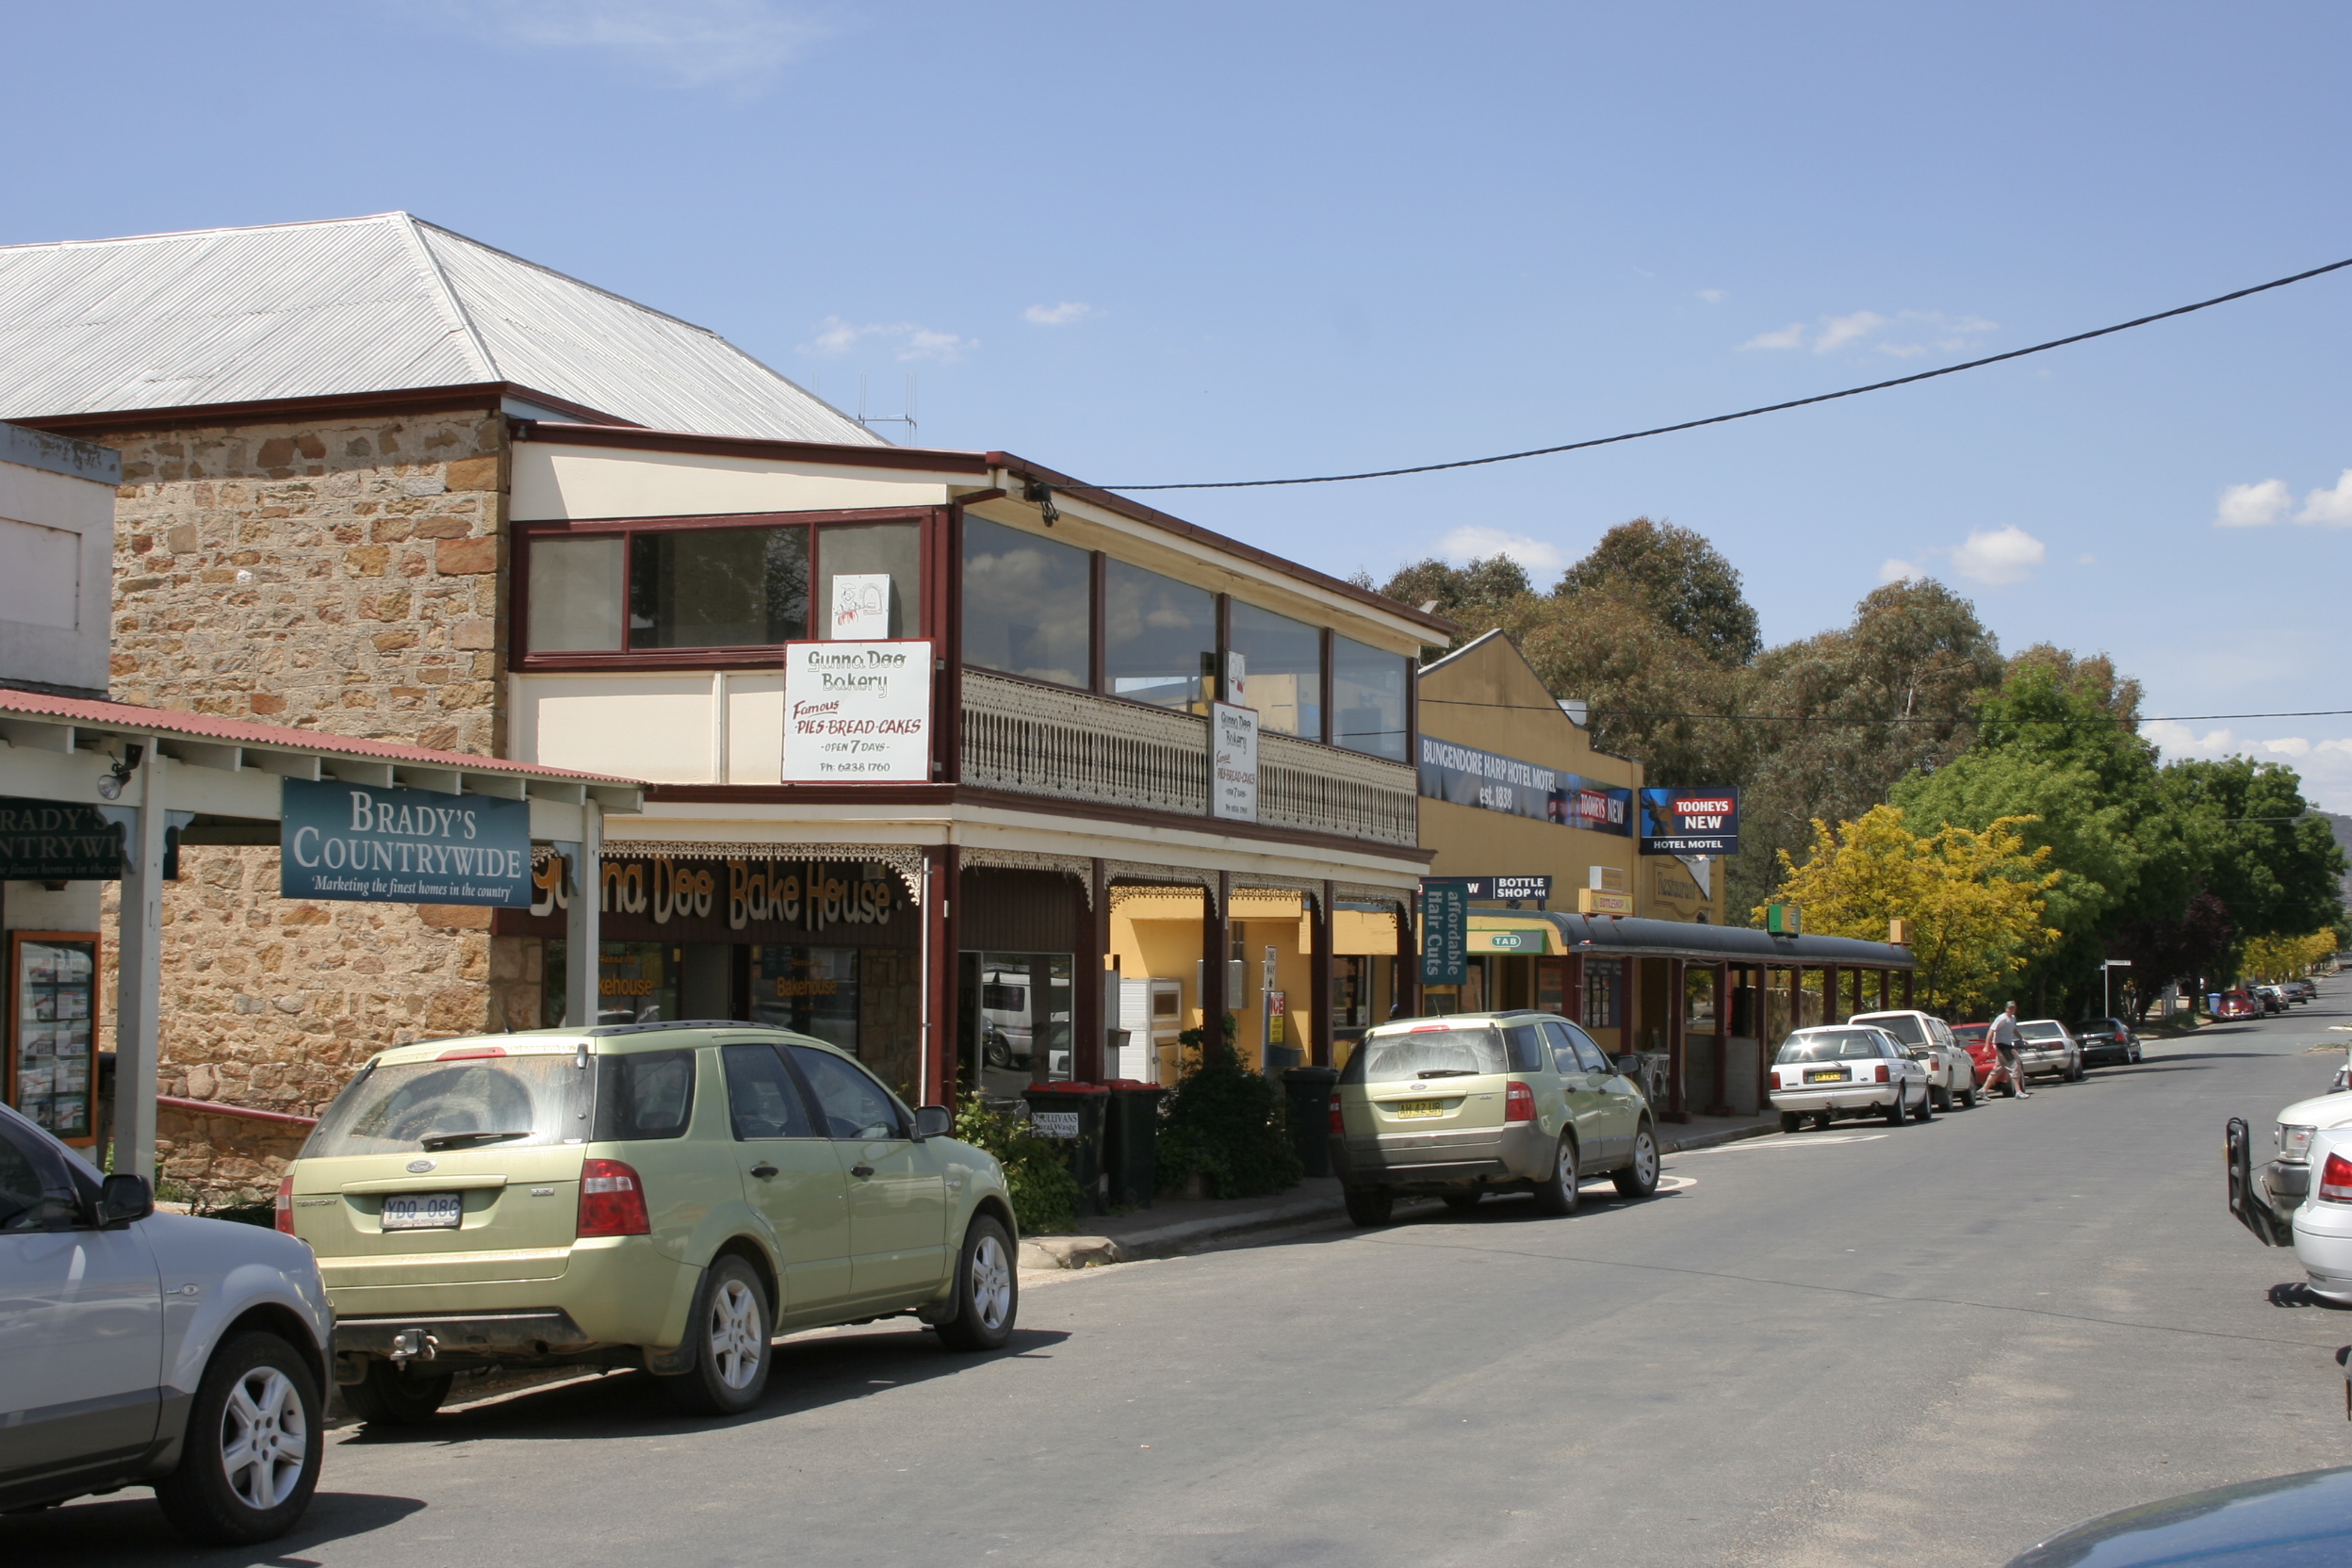
Captains Flat
Captains Flat is a town in the Southern Tablelands of New South Wales, Australia, in Palerang Shire. It is south of Queanbeyan. is suggested that a bullock named "Captain" from Foxlow station, 12 km away, grazed here and hence the place name. area ..
Captains Flat Wikipedia Page

About Our Data
The data on this page is estimated using a number of publicly available tools and resources. It is provided without warranty, and could contain inaccuracies. Use at your own risk.