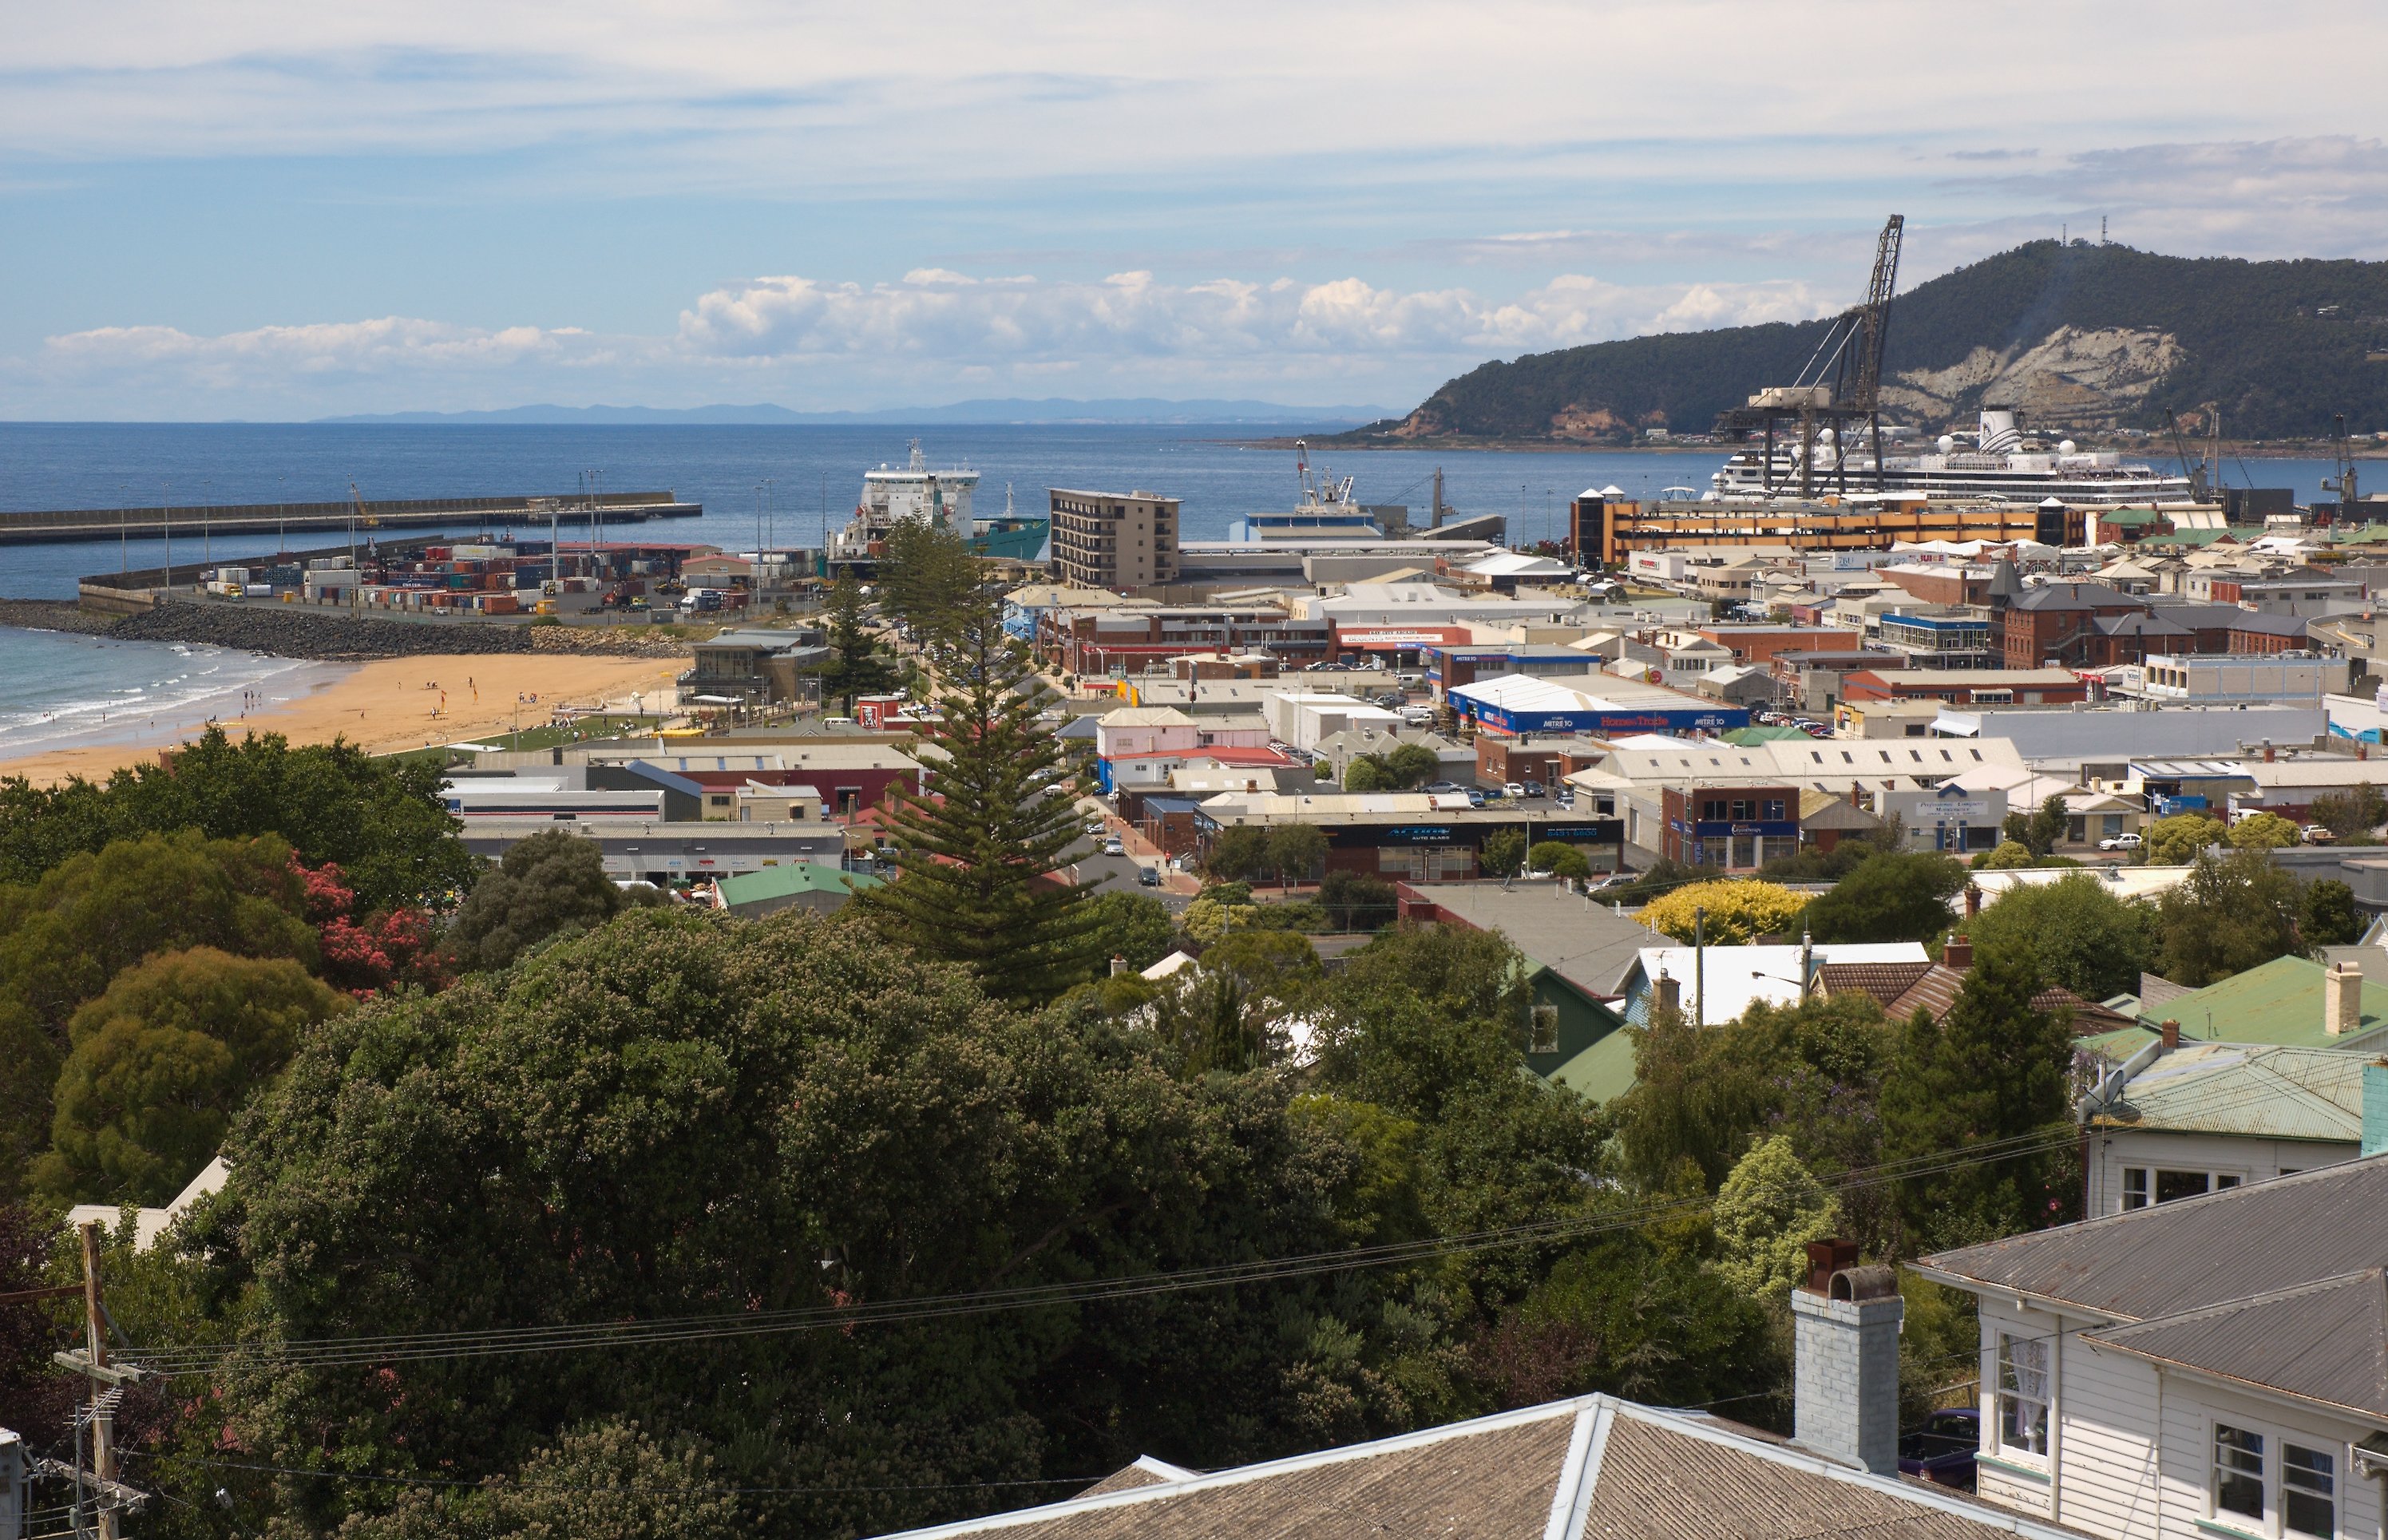
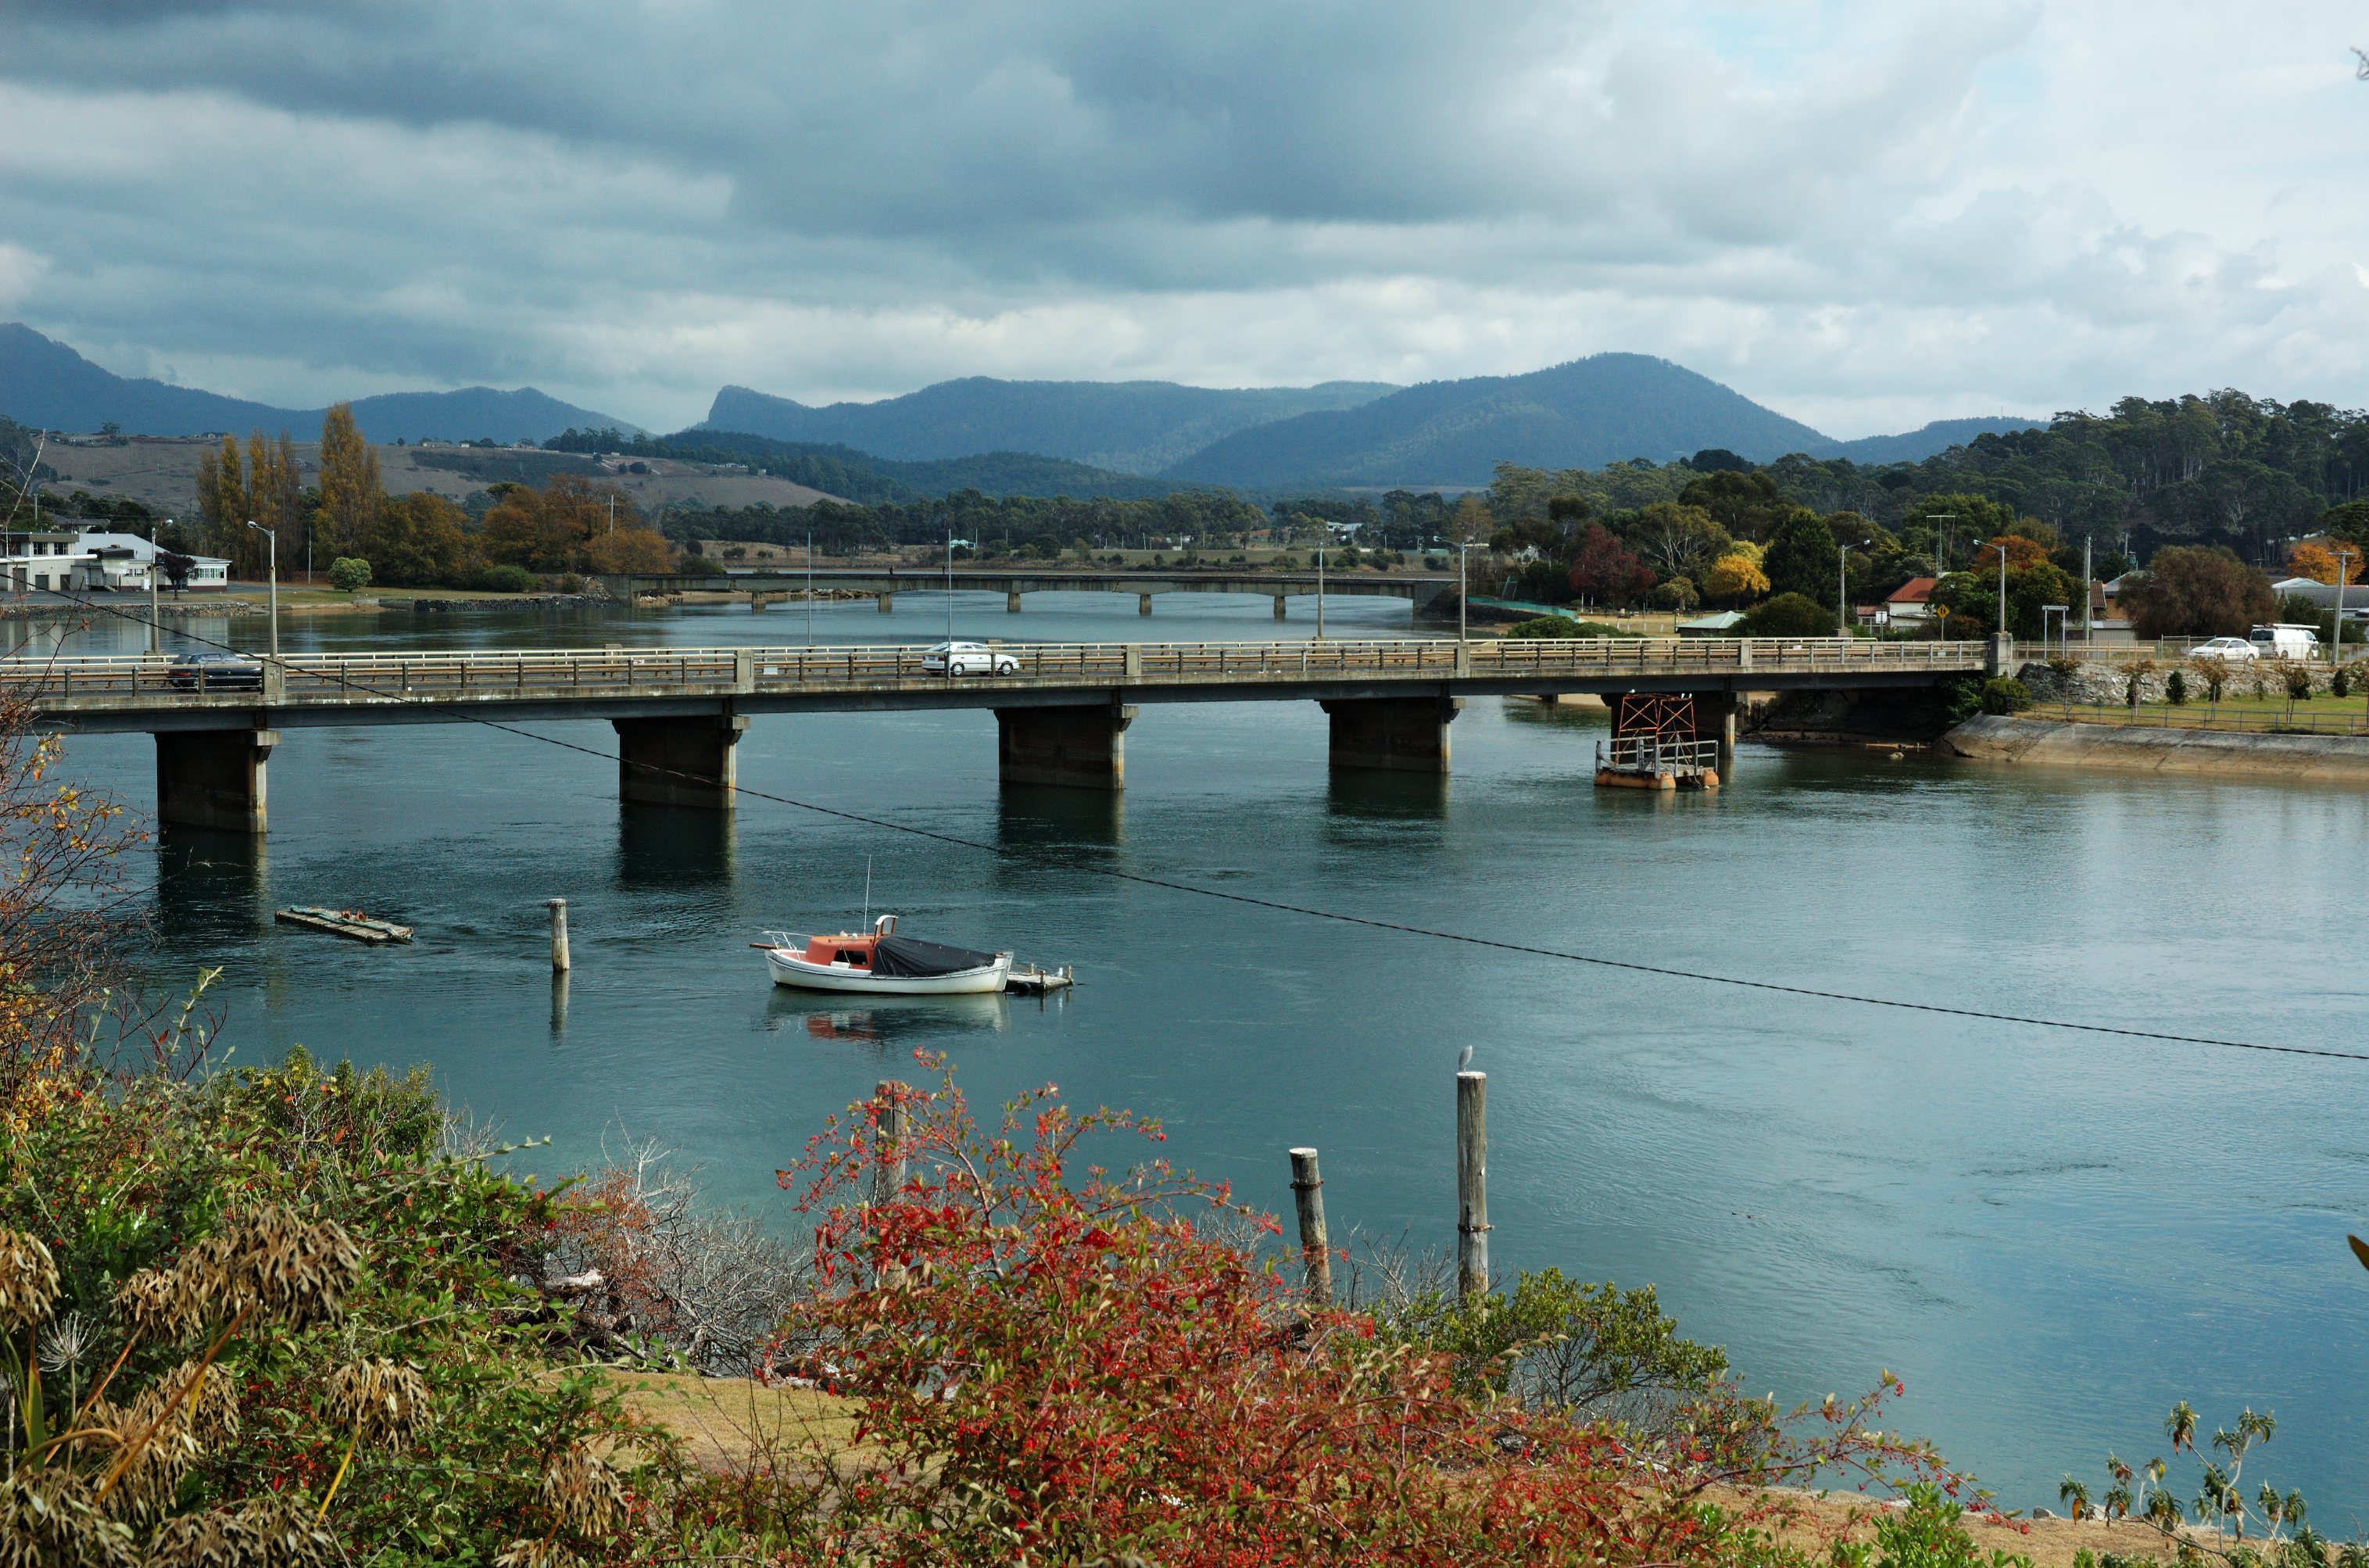
Categories in Forest
Industries
Business Distribution by Industry in Forest
| Industry Description | Number of Establishments |
|---|---|
| Health and medical | 252 |
| Shopping | 124 |
| Construction of buildings | 119 |
| Restaurants | 102 |
| Electronics stores | 99 |
| Creative arts | 60 |
| Real estate | 60 |
| Accountants | 59 |
| Other construction | 53 |
| Dentists | 51 |
| Corporate management | 49 |
| Wholesale of machinery | 42 |
| Bridal shops | 40 |
| Specialized design | 39 |
| Automotive | 39 |
Forest Facts
| Area | 46.9 km² |
| Population | 436 |
| Male Population | 224 (51.3%) |
| Female Population | 212 (48.7%) |
| Population change (1975 to 2020) | +67.7% |
| Population change (2000 to 2020) | +39.7% |
| Median Age | 37.7 years (Male: 38.1, Female: 37.2) |
| GDP per capita (PPP) | $32,870 (2022) |
| Neighborhoods | Inner West, Forest Lodge, Heathwood, Clarence Gardens, Warringah |
| Local Time | |
| Timezone | Australian Eastern Standard Time |
| Lat & Lng | -40.85824, 145.24318 |
Map of Forest
Interactive Map
Forest Population
Years 1975 to 2030
| Data | 1975 | 1990 | 2000 | 2015 | 2020 | 2025* | 2030* |
|---|---|---|---|---|---|---|---|
| Population | 260 | 265 | 312 | 369 | 436 | 428 | 417 |
| Population Density | 5.5 / km² | 5.7 / km² | 6.7 / km² | 7.9 / km² | 9.3 / km² | 9.1 / km² | 8.9 / km² |
Forest Population change from 2000 to 2020
Increase of 39.7% from year 2000 to 2020
| Location | Change since 1975 | Change since 1990 | Change since 2000 |
|---|---|---|---|
| Forest | +67.7% | +64.5% | +39.7% |
| Tasmania | — | — | — |
| Australia | — | — | — |
Forest Median Age
Median Age: 37.7 years
| Location | Median Age | Median Age (Female) | Median Age (Male) |
|---|---|---|---|
| Forest | 37.7 yrs | 37.2 yrs | 38.1 yrs |
| Tasmania | 40.8 yrs | 41.6 yrs | 40 yrs |
| Australia | 37.7 yrs | 38.6 yrs | 36.8 yrs |
Forest Population Density
Population Density: 9.3 / km²
| Location | Population | Area | Density |
|---|---|---|---|
| Forest | 436 | 46.9 km² | 9.3 / km² |
| Tasmania | 531,949 | 68,587.8 km² | 7.8 / km² |
| Australia | 23.8 million | 7,690,961.5 km² | 3.1 / km² |
Forest Historical and Projected Population
Estimated Population from 0 to 2100
- JRC (European Commission's Joint Research Centre) work on the GHS built-up grid
- CIESIN (Center for International Earth Science Information Network)
- [Link] Klein Goldewijk, K., Beusen, A., Doelman, J., and Stehfest, E.: Anthropogenic land use estimates for the Holocene – HYDE 3.2, Earth Syst. Sci. Data, 9, 927–953, https://doi.org/10.5194/essd-9-927-2017, 2017.
Neighborhoods in Forest
Percentage of businesses by neighborhood in Forest
Area Codes
Percentage Area Codes used by businesses in Forest
Postal Codes
Percentage of businesses by Postal Codes in Forest
Price Distribution
Business distribution by price for Forest
Human Development Index (HDI)
Statistic composite index of life expectancy, education, and per capita income.
Forest Gross Domestic Product (GDP)
GDP per capita, PPP (constant 2017 international $)
| Data | 1990 | 1995 | 2000 | 2005 | 2010 | 2015 | 2020 | 2022 |
|---|---|---|---|---|---|---|---|---|
| GDP per capita | $13,981 | $14,427 | $21,480 | $25,894 | $28,269 | $29,251 | $30,348 | $32,870 |
| Total GDP | $8.1M | $8.2M | $13.3M | $16.3M | $18.4M | $18.8M | $19.3M | $20.6M |
Forest CO2 Emissions
Carbon Dioxide (CO2) Emissions Per Capita in Tonnes Per Year
| Location | CO2 Emissions | CO2 Emissions Per Capita | CO2 Emissions Intensity |
|---|---|---|---|
| Forest | 7,221 tn | 16.56 tn | 154 tons/km² |
| Tasmania | 8,759,956 tn | 16.47 tn | 127.7 tons/km² |
| Australia | 401,155,564 tn | 16.88 tn | 52.2 tons/km² |
| 2013 CO2 emissions (tonnes/year) | 7,221 tn |
| 2013 CO2 emissions (tonnes/year) per capita | 16.56 tn |
| 2013 CO2 emissions intensity (tonnes/km²/year) | 154 tons/km² |
Natural Hazards Risk
Relative risk out of 10
| Hazard | Risk Level |
|---|---|
| Earthquake | Medium (4) |
* Risk, particularly concerning flood or landslide, may not be for the entire area.
- Dilley, M., R.S. Chen, U. Deichmann, A.L. Lerner-Lam, M. Arnold, J. Agwe, P. Buys, O. Kjekstad, B. Lyon, and G. Yetman. 2005. Natural Disaster Hotspots: A Global Risk Analysis. Washington, D.C.: World Bank. https://doi.org/10.1596/0-8213-5930-4.
- Center for Hazards and Risk Research - CHRR - Columbia University, Center for International Earth Science Information Network - CIESIN - Columbia University. 2005. Global Earthquake Hazard Distribution - Peak Ground Acceleration. Palisades, NY: NASA Socioeconomic Data and Applications Center (SEDAC). https://doi.org/10.7927/H4BZ63ZS.
Recent Nearby Earthquakes
Magnitude 3.0 and greater
| Date▼ | Time↕ | Magnitude↕ | Distance↕ | Depth↕ | Location↕ | Link |
|---|---|---|---|---|---|---|
| 1/12/13 | 8:21 PM | 3.4 | 48.9 km | 10,000 m | Bass Strait, Australia | usgs.gov |
| 9/8/07 | 10:29 AM | 3.8 | 47.1 km | 10,000 m | Bass Strait, Australia | usgs.gov |
| 3/16/86 | 1:53 AM | 4 | 78.3 km | 10,000 m | Tasmania, Australia region | usgs.gov |

About Our Data
The data on this page is estimated using a number of publicly available tools and resources. It is provided without warranty, and could contain inaccuracies. Use at your own risk.