Categories in Kerang
Industries
Business Distribution by Industry in Kerang
| Industry Description | Number of Establishments |
|---|---|
| Shopping | 36 |
| Construction of buildings | 25 |
| Gas station | 17 |
| Health and medical | 17 |
| Household appliances and goods | 11 |
| Tractors and farm equipment | 10 |
| Real estate | 10 |
| Car repair | 10 |
| Public parks | 10 |
| Accountants | 10 |
| Clothing stores | 9 |
| Banks | 9 |
| All food and beverage | 8 |
| Religion | 8 |
| Restaurants | 8 |
| Wholesale of construction supplies | 7 |
Kerang Facts
| Area | 15.2 km² |
| Population | 4,363 |
| Male Population | 2,086 (47.8%) |
| Female Population | 2,277 (52.2%) |
| Population change (1975 to 2020) | +84.2% |
| Population change (2000 to 2020) | +34.8% |
| Median Age | 46.7 years (Male: 44.3, Female: 48.4) |
| Local Time | |
| Timezone | Australian Eastern Standard Time |
| Lat & Lng | -35.73489, 143.92027 |
Map of Kerang
Interactive Map
Kerang Population
Years 1975 to 2020
| Data | 1975 | 1990 | 2000 | 2015 | 2020 |
|---|---|---|---|---|---|
| Population | 2,369 | 2,901 | 3,237 | 4,053 | 4,363 |
| Population Density | 156 / km² | 191 / km² | 213.1 / km² | 266.9 / km² | 287.3 / km² |
Kerang Population change from 2000 to 2015
Increase of 25.2% from year 2000 to 2015
| Location | Change since 1975 | Change since 1990 | Change since 2000 |
|---|---|---|---|
| Kerang | +71.1% | +39.7% | +25.2% |
| Victoria (Australia) | +72.6% | +40.2% | +25.5% |
| Australia | +72.6% | +40.3% | +25.5% |
Kerang Median Age
Median Age: 46.7 years
| Location | Median Age | Median Age (Female) | Median Age (Male) |
|---|---|---|---|
| Kerang | 46.7 yrs | 48.4 yrs | 44.3 yrs |
| Victoria (Australia) | 37.6 yrs | 38.6 yrs | 36.6 yrs |
| Australia | 37.7 yrs | 38.6 yrs | 36.8 yrs |
Kerang Population Density
Population Density: 287 / km²
| Location | Population | Area | Density |
|---|---|---|---|
| Kerang | 4,363 | 15.2 km² | 287 / km² |
| Victoria (Australia) | 5.9 million | 227,400.2 km² | 26.1 / km² |
| Australia | 23.8 million | 7,690,961.5 km² | 3.1 / km² |
Kerang Historical and Projected Population
Estimated Population from 1850 to 2100
- JRC (European Commission's Joint Research Centre) work on the GHS built-up grid
- CIESIN (Center for International Earth Science Information Network)
- [Link] Klein Goldewijk, K., Beusen, A., Doelman, J., and Stehfest, E.: Anthropogenic land use estimates for the Holocene – HYDE 3.2, Earth Syst. Sci. Data, 9, 927–953, https://doi.org/10.5194/essd-9-927-2017, 2017.
Price Distribution
Business distribution by price for Kerang
Human Development Index (HDI)
Statistic composite index of life expectancy, education, and per capita income.
Kerang CO2 Emissions
Carbon Dioxide (CO2) Emissions Per Capita in Tonnes Per Year
| Location | CO2 Emissions | CO2 Emissions Per Capita | CO2 Emissions Intensity |
|---|---|---|---|
| Kerang | 70,749 tn | 16.22 tn | 4,658.4 tons/km² |
| Victoria (Australia) | 101,123,087 tn | 17.02 tn | 444.7 tons/km² |
| Australia | 401,155,564 tn | 16.88 tn | 52.2 tons/km² |
| 2013 CO2 emissions (tonnes/year) | 70,749 tn |
| 2013 CO2 emissions (tonnes/year) per capita | 16.22 tn |
| 2013 CO2 emissions intensity (tonnes/km²/year) | 4,658.4 tons/km² |
Natural Hazards Risk
Relative risk out of 10
| Hazard | Risk Level |
|---|---|
| Drought | Low (2) |
| Earthquake | Medium (4) |
* Risk, particularly concerning flood or landslide, may not be for the entire area.
- Dilley, M., R.S. Chen, U. Deichmann, A.L. Lerner-Lam, M. Arnold, J. Agwe, P. Buys, O. Kjekstad, B. Lyon, and G. Yetman. 2005. Natural Disaster Hotspots: A Global Risk Analysis. Washington, D.C.: World Bank. https://doi.org/10.1596/0-8213-5930-4.
- Center for Hazards and Risk Research - CHRR - Columbia University, Center for International Earth Science Information Network - CIESIN - Columbia University, and International Research Institute for Climate and Society - IRI - Columbia University. 2005. Global Drought Hazard Frequency and Distribution. Palisades, NY: NASA Socioeconomic Data and Applications Center (SEDAC). https://doi.org/10.7927/H4VX0DFT.
- Center for Hazards and Risk Research - CHRR - Columbia University, Center for International Earth Science Information Network - CIESIN - Columbia University. 2005. Global Earthquake Hazard Distribution - Peak Ground Acceleration. Palisades, NY: NASA Socioeconomic Data and Applications Center (SEDAC). https://doi.org/10.7927/H4BZ63ZS.
Recent Nearby Earthquakes
Magnitude 3.0 and greater
| Date▼ | Time↕ | Magnitude↕ | Distance↕ | Depth↕ | Location↕ | Link |
|---|---|---|---|---|---|---|
| 7/23/18 | 1:48 PM | 3 | 39.1 km | 10,000 m | 49km WNW of Echuca, Australia | usgs.gov |
| 12/29/03 | 1:31 PM | 3.6 | 65.9 km | 11,000 m | New South Wales, Australia | usgs.gov |
| 3/10/03 | 12:28 PM | 3.1 | 72.4 km | 8,000 m | Victoria, Australia | usgs.gov |
| 1/22/02 | 9:18 AM | 3.3 | 93.8 km | 10,000 m | Victoria, Australia | usgs.gov |
| 10/27/01 | 7:58 AM | 4.2 | 52 km | 10,000 m | Victoria, Australia | usgs.gov |
| 8/25/89 | 3:09 PM | 3.1 | 70.3 km | 10,000 m | Victoria, Australia | usgs.gov |
| 7/15/89 | 3:06 AM | 3.3 | 53.8 km | 10,000 m | New South Wales, Australia | usgs.gov |
| 1/20/89 | 5:41 PM | 3.4 | 38.1 km | 10,000 m | New South Wales, Australia | usgs.gov |
| 12/25/88 | 5:27 AM | 3.3 | 39.8 km | 10,000 m | Victoria, Australia | usgs.gov |
| 7/3/88 | 9:17 AM | 3.5 | 56.1 km | 10,000 m | New South Wales, Australia | usgs.gov |
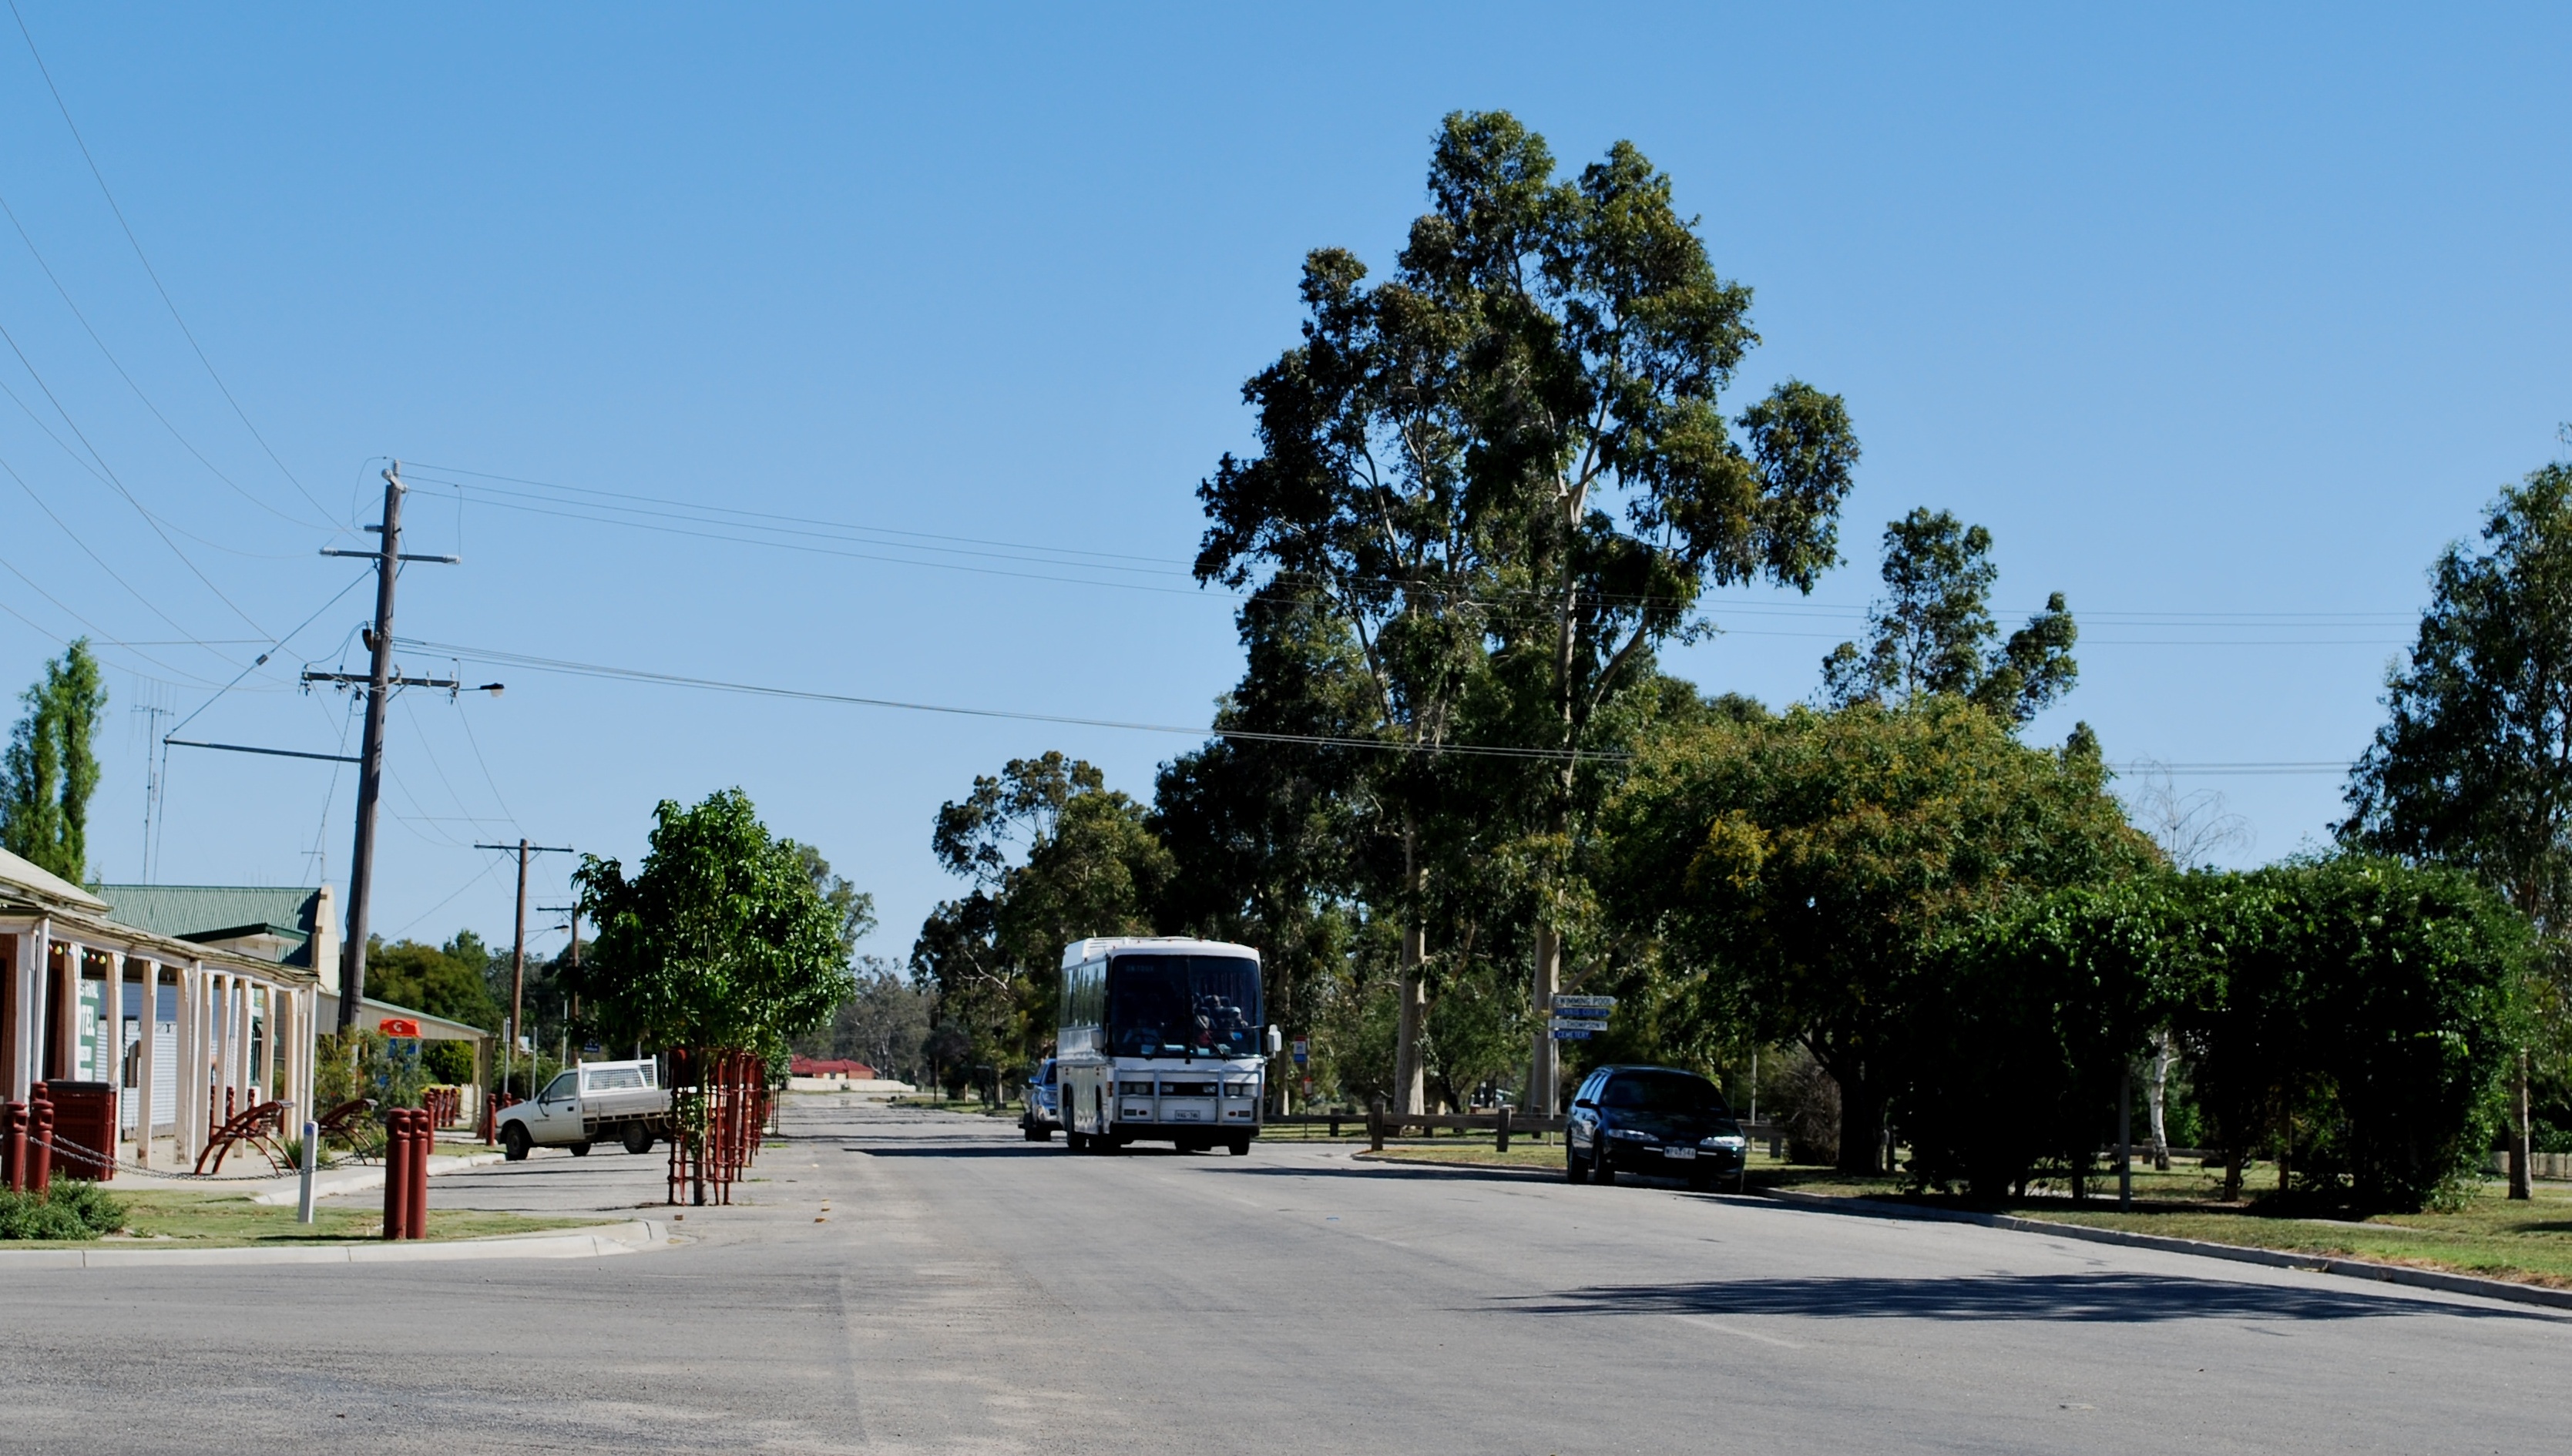
Kerang
Kerang is a rural town on the Loddon River in northern Victoria in Australia. It is the commercial centre to an irrigation district based on livestock, horticulture, lucerne and grain. It is located 279 kilometres (173 mi) north-west of Melbourne on ..
Kerang Wikipedia Page


About Our Data
The data on this page is estimated using a number of publicly available tools and resources. It is provided without warranty, and could contain inaccuracies. Use at your own risk.