Lapoinya Facts
| Area | 35.9 km² |
| Population | 41 |
| Population change (2000 to 2020) | +10.8% |
| Local Time | |
| Timezone | Australian Eastern Standard Time |
| Lat & Lng | -41.00107, 145.57534 |
Map of Lapoinya
Interactive Map
Lapoinya Population
Years 1975 to 2020
| Data | 1975 | 1990 | 2000 | 2015 | 2020 |
|---|---|---|---|---|---|
| Population | 0 | 25 | 37 | 39 | 41 |
| Population Density | 0 / km² | 0.7 / km² | 1 / km² | 1.1 / km² | 1.1 / km² |
Lapoinya Population change from 2000 to 2015
Increase of 5.4% from year 2000 to 2015
| Location | Change since 1975 | Change since 1990 | Change since 2000 |
|---|---|---|---|
| Lapoinya | — | +56% | +5.4% |
| Tasmania | +72.8% | +40.5% | +25.6% |
| Australia | +72.6% | +40.3% | +25.5% |
Lapoinya Population Density
Population Density: 1.1 / km²
| Location | Population | Area | Density |
|---|---|---|---|
| Lapoinya | 41 | 35.9 km² | 1.1 / km² |
| Tasmania | 531,949 | 68,587.8 km² | 7.8 / km² |
| Australia | 23.8 million | 7,690,961.5 km² | 3.1 / km² |
Lapoinya Historical and Projected Population
Estimated Population from 1975 to 2100
- JRC (European Commission's Joint Research Centre) work on the GHS built-up grid
- CIESIN (Center for International Earth Science Information Network)
- [Link] Klein Goldewijk, K., Beusen, A., Doelman, J., and Stehfest, E.: Anthropogenic land use estimates for the Holocene – HYDE 3.2, Earth Syst. Sci. Data, 9, 927–953, https://doi.org/10.5194/essd-9-927-2017, 2017.
Human Development Index (HDI)
Statistic composite index of life expectancy, education, and per capita income.
Lapoinya CO2 Emissions
Carbon Dioxide (CO2) Emissions Per Capita in Tonnes Per Year
| Location | CO2 Emissions | CO2 Emissions Per Capita | CO2 Emissions Intensity |
|---|---|---|---|
| Lapoinya | 727 tn | 17.73 tn | 20.3 tons/km² |
| Tasmania | 8,759,956 tn | 16.47 tn | 127.7 tons/km² |
| Australia | 401,155,564 tn | 16.88 tn | 52.2 tons/km² |
| 2013 CO2 emissions (tonnes/year) | 727 tn |
| 2013 CO2 emissions (tonnes/year) per capita | 17.73 tn |
| 2013 CO2 emissions intensity (tonnes/km²/year) | 20.3 tons/km² |
Natural Hazards Risk
Relative risk out of 10
| Hazard | Risk Level |
|---|---|
| Earthquake | Medium (4) |
* Risk, particularly concerning flood or landslide, may not be for the entire area.
- Dilley, M., R.S. Chen, U. Deichmann, A.L. Lerner-Lam, M. Arnold, J. Agwe, P. Buys, O. Kjekstad, B. Lyon, and G. Yetman. 2005. Natural Disaster Hotspots: A Global Risk Analysis. Washington, D.C.: World Bank. https://doi.org/10.1596/0-8213-5930-4.
- Center for Hazards and Risk Research - CHRR - Columbia University, Center for International Earth Science Information Network - CIESIN - Columbia University. 2005. Global Earthquake Hazard Distribution - Peak Ground Acceleration. Palisades, NY: NASA Socioeconomic Data and Applications Center (SEDAC). https://doi.org/10.7927/H4BZ63ZS.
Recent Nearby Earthquakes
Magnitude 3.0 and greater
| Date▼ | Time↕ | Magnitude↕ | Distance↕ | Depth↕ | Location↕ | Link |
|---|---|---|---|---|---|---|
| 1/12/13 | 8:21 PM | 3.4 | 21.4 km | 10,000 m | Bass Strait, Australia | usgs.gov |
| 9/8/07 | 10:29 AM | 3.8 | 78.1 km | 10,000 m | Bass Strait, Australia | usgs.gov |
| 11/18/04 | 11:31 PM | 4.3 | 80.6 km | 10,000 m | Tasmania, Australia region | usgs.gov |
| 8/23/97 | 5:30 PM | 4 | 93.1 km | 10,000 m | Tasmania, Australia region | usgs.gov |
| 3/16/86 | 1:53 AM | 4 | 90.9 km | 10,000 m | Tasmania, Australia region | usgs.gov |
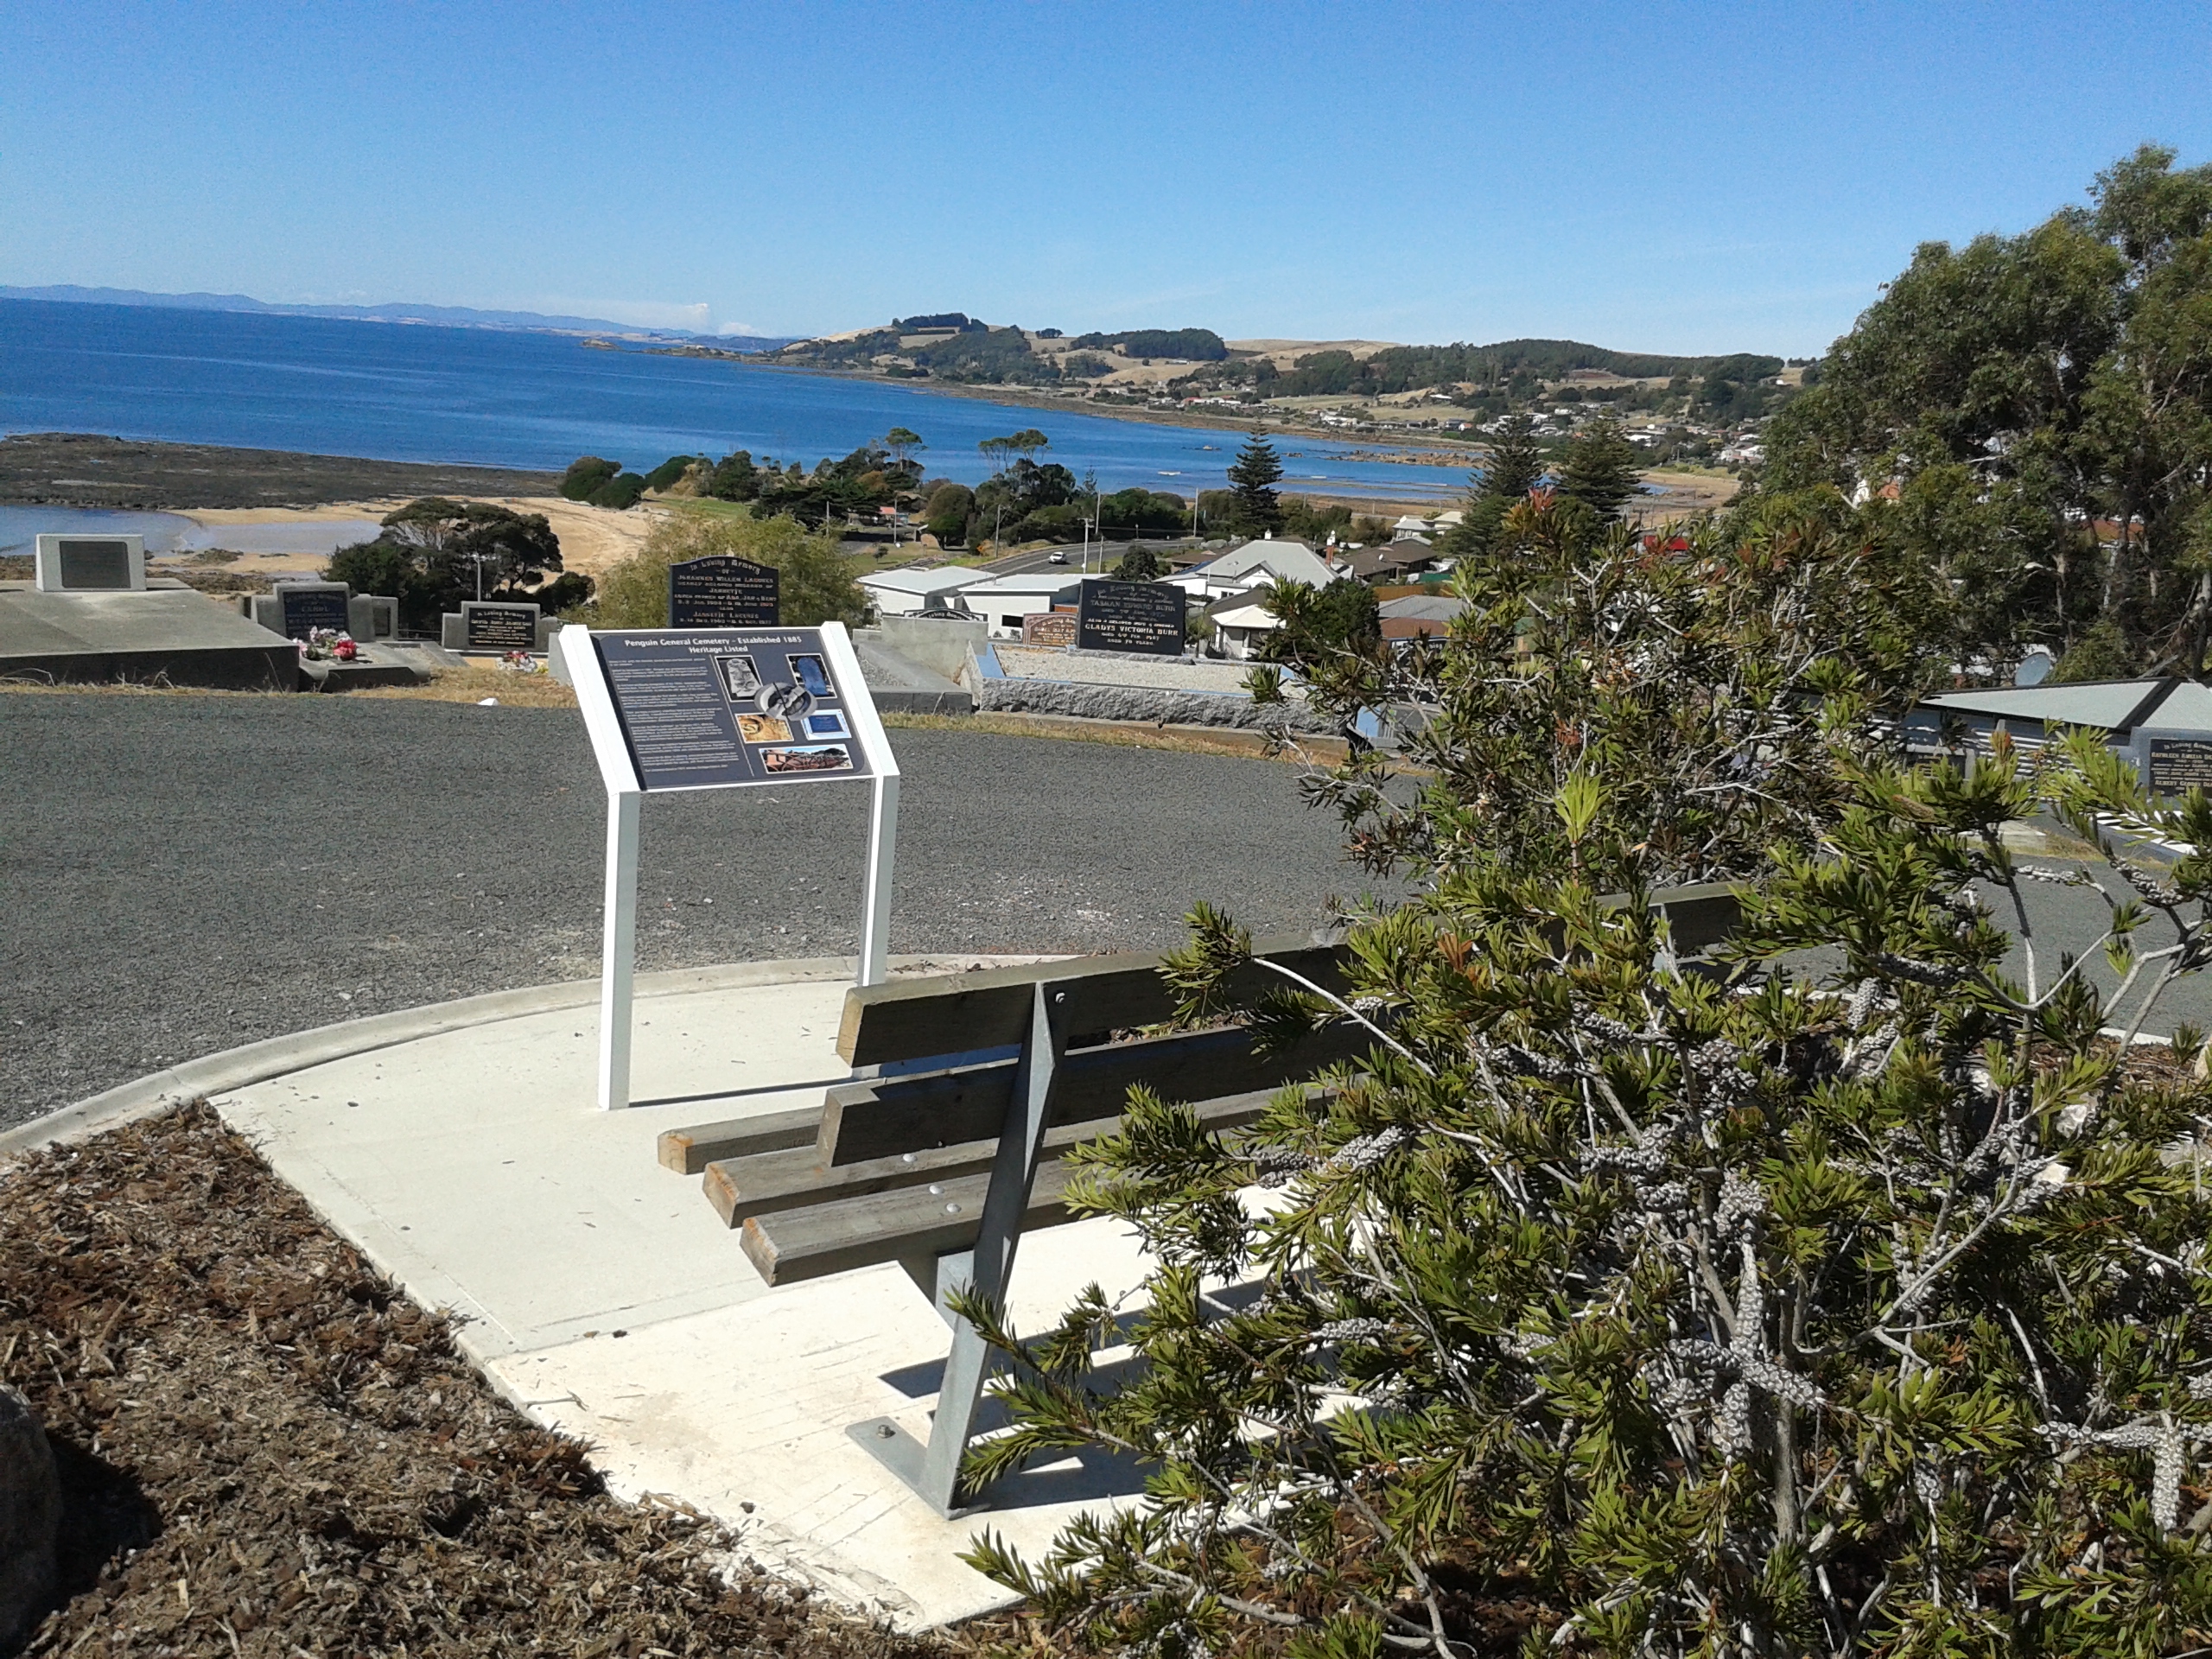
Lapoinya
Lapoinya (pronounced La-porn-ya) is a small agricultural centre on the north-west coast of Tasmania west of Wynyard. The name is Tasmanian aboriginal word for "fern tree", a plant that abounds in those surviving untouched parts of the original temper..
Lapoinya Wikipedia Page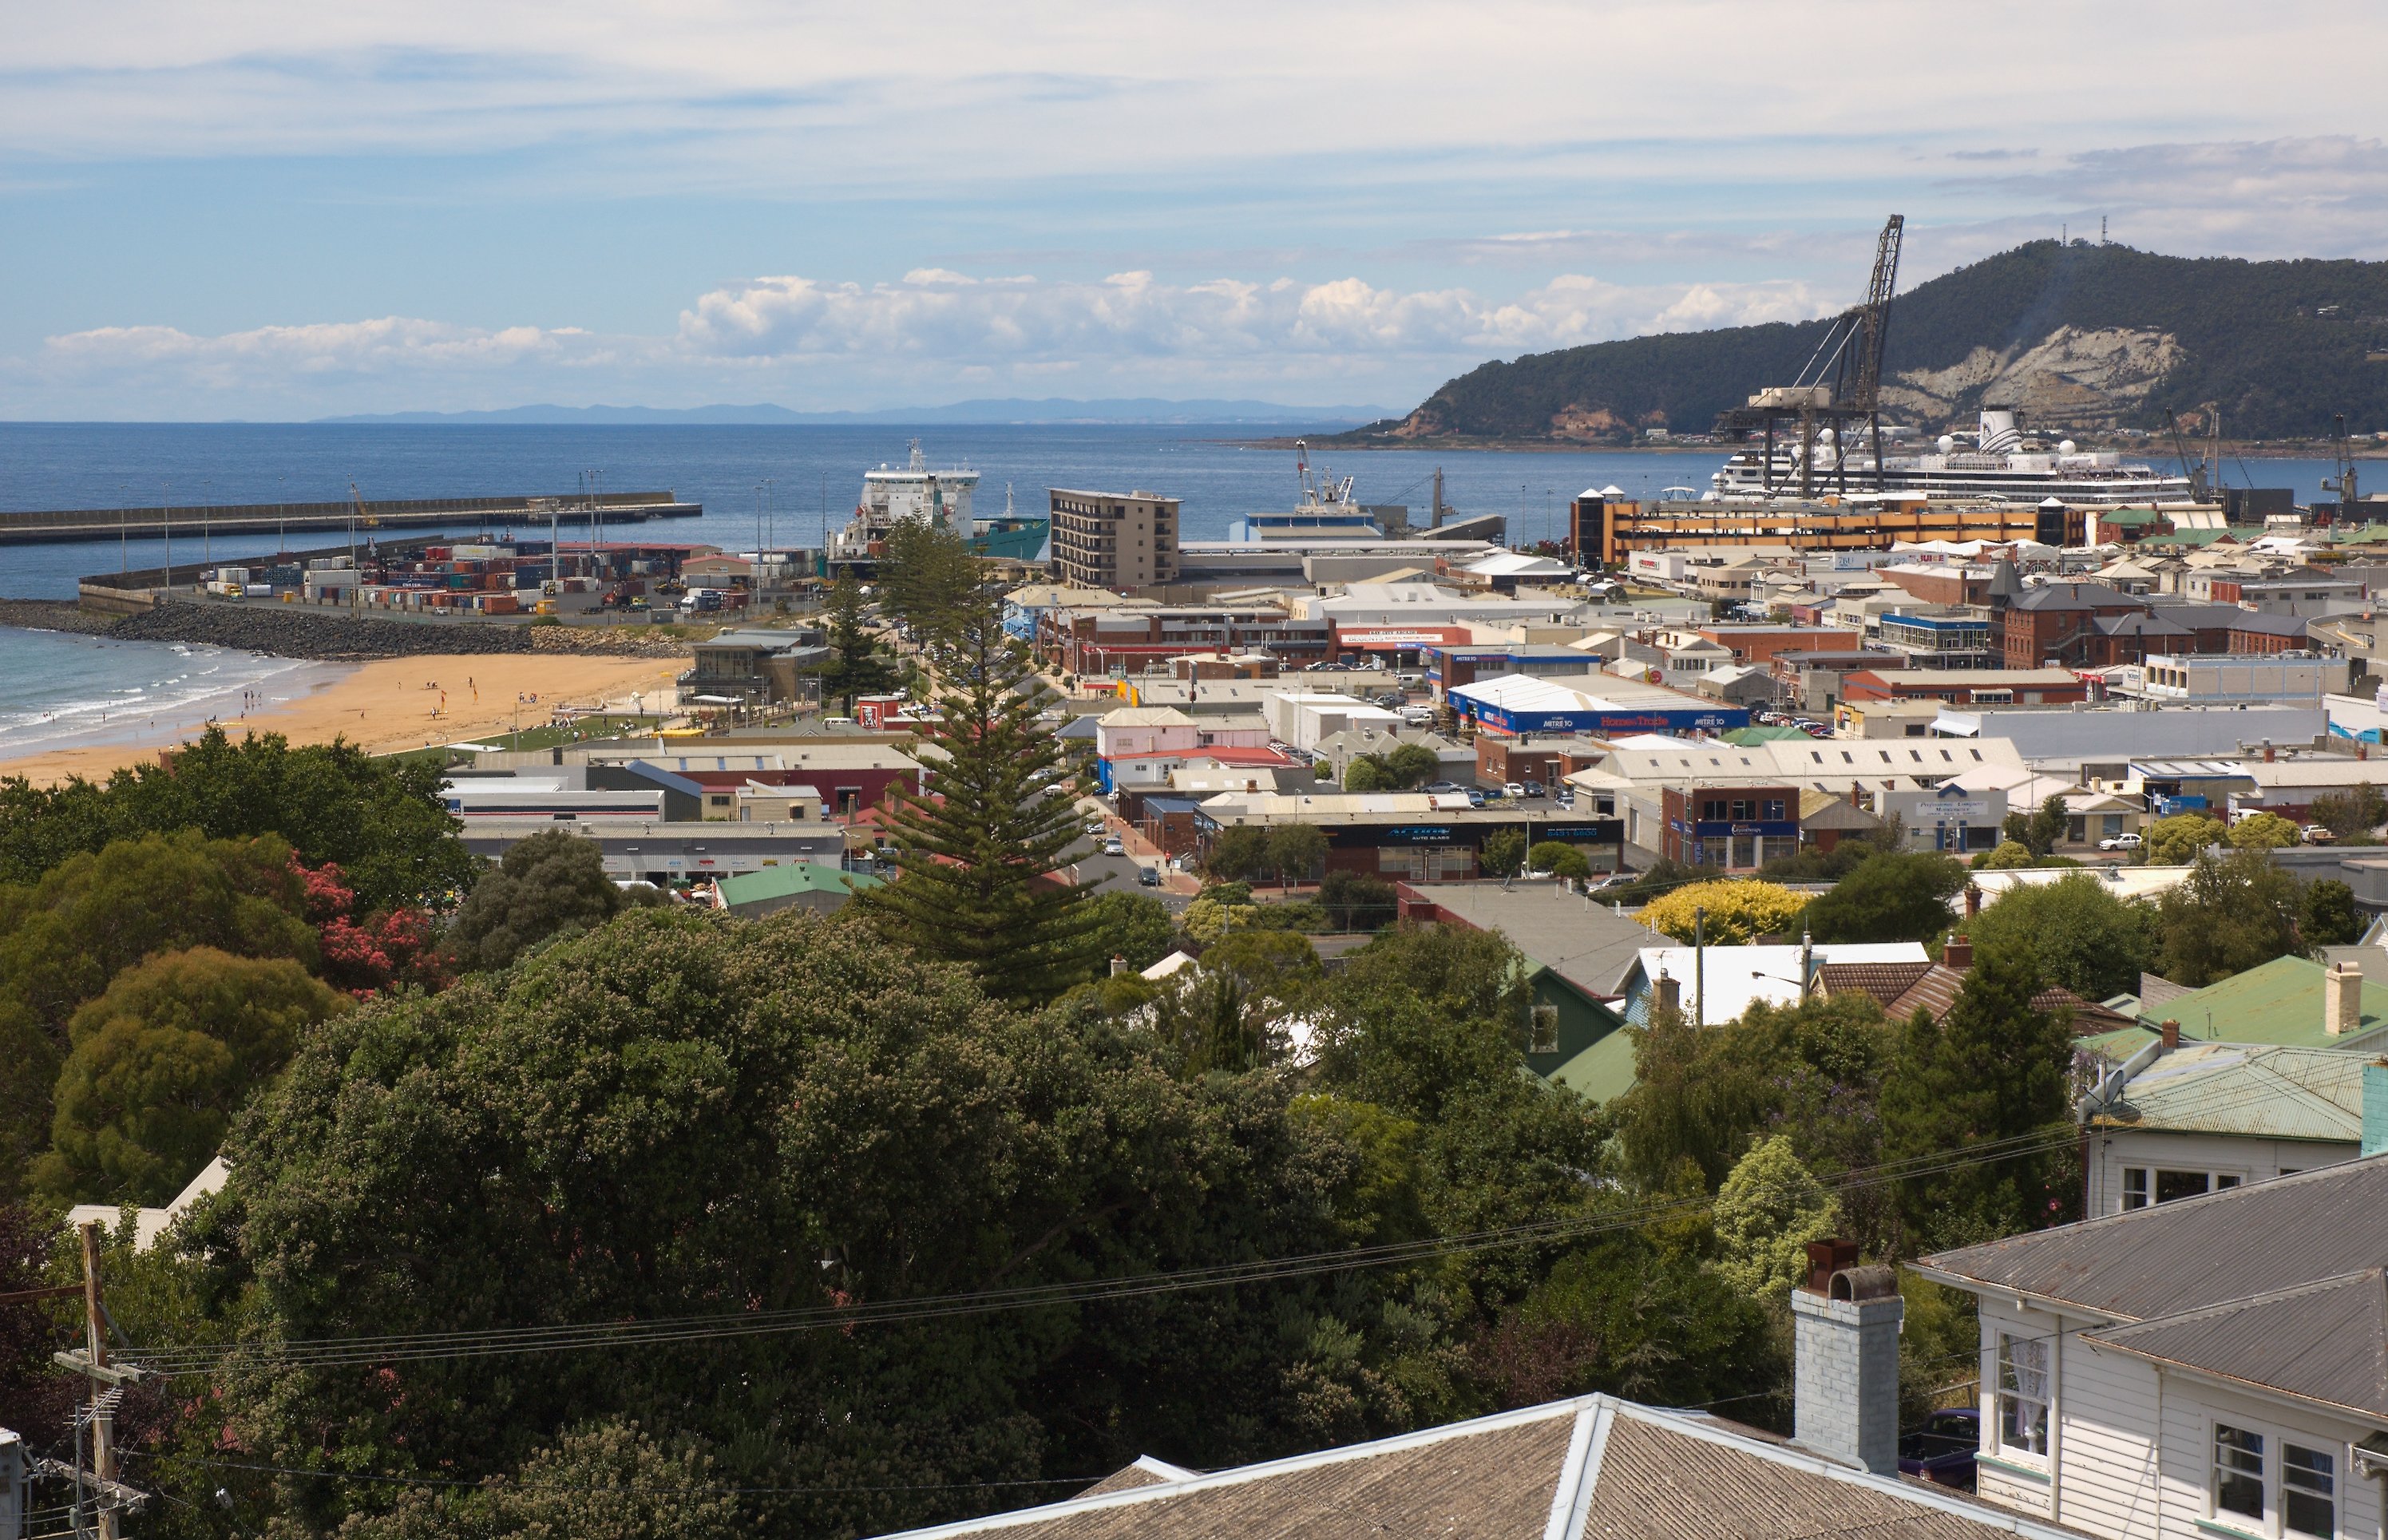

About Our Data
The data on this page is estimated using a number of publicly available tools and resources. It is provided without warranty, and could contain inaccuracies. Use at your own risk.