Categories in Moama
Industries
Business Distribution by Industry in Moama
| Industry Description | Number of Establishments | Average Age of Business |
|---|---|---|
| Other accommodation | 42 | 37 years |
| Restaurants | 21 | — |
| Shopping | 16 | — |
| Car repair | 15 | — |
| Construction of buildings | 15 | — |
| Wholesale of machinery | 12 | — |
| Health and medical | 12 | — |
| Tractors and farm equipment | 12 | — |
| Public parks | 11 | — |
| Campgrounds | 10 | — |
| Specialized design | 10 | — |
| Grocery stores and supermarkets | 9 | — |
Moama Facts
| Area | 9.3 km² |
| Population | 4,209 |
| Male Population | 2,029 (48.2%) |
| Female Population | 2,180 (51.8%) |
| Population change (1975 to 2020) | +63.5% |
| Population change (2000 to 2020) | +29.5% |
| Median Age | 46.1 years (Male: 44.2, Female: 47.6) |
| GDP per capita (PPP) | $36,518 (2022) |
| Local Time | |
| Timezone | Australian Eastern Standard Time |
| Lat & Lng | -36.10413, 144.76080 |
| Postal Codes | 2731 |
Map of Moama
Interactive Map
Moama Population
Years 1975 to 2030
| Data | 1975 | 1990 | 2000 | 2015 | 2020 | 2025* | 2030* |
|---|---|---|---|---|---|---|---|
| Population | 2,575 | 2,913 | 3,249 | 4,182 | 4,209 | 4,094 | 3,966 |
| Population Density | 278.4 / km² | 314.9 / km² | 351.2 / km² | 452.1 / km² | 455 / km² | 442.6 / km² | 428.8 / km² |
Moama Population change from 2000 to 2020
Increase of 29.5% from year 2000 to 2020
| Location | Change since 1975 | Change since 1990 | Change since 2000 |
|---|---|---|---|
| Moama | +63.5% | +44.5% | +29.5% |
| New South Wales | — | — | — |
| Australia | — | — | — |
Moama Median Age
Median Age: 46.1 years
| Location | Median Age | Median Age (Female) | Median Age (Male) |
|---|---|---|---|
| Moama | 46.1 yrs | 47.6 yrs | 44.2 yrs |
| New South Wales | 38.3 yrs | 39.2 yrs | 37.4 yrs |
| Australia | 37.7 yrs | 38.6 yrs | 36.8 yrs |
Moama Population Density
Population Density: 455 / km²
| Location | Population | Area | Density |
|---|---|---|---|
| Moama | 4,209 | 9.3 km² | 455 / km² |
| New South Wales | 7.7 million | 801,634.1 km² | 9.6 / km² |
| Australia | 23.8 million | 7,690,961.5 km² | 3.1 / km² |
Moama Historical and Projected Population
Estimated Population from 1850 to 2100
- JRC (European Commission's Joint Research Centre) work on the GHS built-up grid
- CIESIN (Center for International Earth Science Information Network)
- [Link] Klein Goldewijk, K., Beusen, A., Doelman, J., and Stehfest, E.: Anthropogenic land use estimates for the Holocene – HYDE 3.2, Earth Syst. Sci. Data, 9, 927–953, https://doi.org/10.5194/essd-9-927-2017, 2017.
Area Codes
Percentage Area Codes used by businesses in Moama
Price Distribution
Business distribution by price for Moama
Human Development Index (HDI)
Statistic composite index of life expectancy, education, and per capita income.
Moama Gross Domestic Product (GDP)
GDP per capita, PPP (constant 2017 international $)
| Data | 1990 | 1995 | 2000 | 2005 | 2010 | 2015 | 2020 | 2022 |
|---|---|---|---|---|---|---|---|---|
| GDP per capita | $24,271 | $24,846 | $32,541 | $31,238 | $27,824 | $29,539 | $29,954 | $36,518 |
| Total GDP | $11.8M | $11.7M | $16.2M | $15.3M | $13.7M | $14.7M | $15.5M | $18.8M |
Moama CO2 Emissions
Carbon Dioxide (CO2) Emissions Per Capita in Tonnes Per Year
| Location | CO2 Emissions | CO2 Emissions Per Capita | CO2 Emissions Intensity |
|---|---|---|---|
| Moama | 73,196 tn | 17.39 tn | 7,913.1 tons/km² |
| New South Wales | 133,365,481 tn | 17.39 tn | 166.4 tons/km² |
| Australia | 401,155,564 tn | 16.88 tn | 52.2 tons/km² |
| 2013 CO2 emissions (tonnes/year) | 73,196 tn |
| 2013 CO2 emissions (tonnes/year) per capita | 17.39 tn |
| 2013 CO2 emissions intensity (tonnes/km²/year) | 7,913.1 tons/km² |
Natural Hazards Risk
Relative risk out of 10
| Hazard | Risk Level |
|---|---|
| Drought | Low (2) |
| Earthquake | Medium (4) |
* Risk, particularly concerning flood or landslide, may not be for the entire area.
- Dilley, M., R.S. Chen, U. Deichmann, A.L. Lerner-Lam, M. Arnold, J. Agwe, P. Buys, O. Kjekstad, B. Lyon, and G. Yetman. 2005. Natural Disaster Hotspots: A Global Risk Analysis. Washington, D.C.: World Bank. https://doi.org/10.1596/0-8213-5930-4.
- Center for Hazards and Risk Research - CHRR - Columbia University, Center for International Earth Science Information Network - CIESIN - Columbia University, and International Research Institute for Climate and Society - IRI - Columbia University. 2005. Global Drought Hazard Frequency and Distribution. Palisades, NY: NASA Socioeconomic Data and Applications Center (SEDAC). https://doi.org/10.7927/H4VX0DFT.
- Center for Hazards and Risk Research - CHRR - Columbia University, Center for International Earth Science Information Network - CIESIN - Columbia University. 2005. Global Earthquake Hazard Distribution - Peak Ground Acceleration. Palisades, NY: NASA Socioeconomic Data and Applications Center (SEDAC). https://doi.org/10.7927/H4BZ63ZS.
Recent Nearby Earthquakes
Magnitude 3.0 and greater
| Date▼ | Time↕ | Magnitude↕ | Distance↕ | Depth↕ | Location↕ | Link |
|---|---|---|---|---|---|---|
| 7/23/18 | 1:48 PM | 3 | 49.1 km | 10,000 m | 49km WNW of Echuca, Australia | usgs.gov |
| 5/26/10 | 10:09 AM | 3 | 29 km | 10,000 m | Victoria, Australia | usgs.gov |
| 12/29/03 | 1:31 PM | 3.6 | 79.5 km | 11,000 m | New South Wales, Australia | usgs.gov |
| 1/22/02 | 9:18 AM | 3.3 | 28 km | 10,000 m | Victoria, Australia | usgs.gov |
| 6/22/00 | 6:13 PM | 3.3 | 85 km | 10,000 m | Victoria, Australia | usgs.gov |
| 6/8/91 | 7:55 PM | 3.1 | 99.3 km | 10,000 m | Victoria, Australia | usgs.gov |
| 5/3/91 | 5:28 PM | 3.4 | 99.4 km | 33,000 m | Victoria, Australia | usgs.gov |
| 8/25/89 | 3:09 PM | 3.1 | 21.4 km | 10,000 m | Victoria, Australia | usgs.gov |
| 7/15/89 | 3:06 AM | 3.3 | 47.4 km | 10,000 m | New South Wales, Australia | usgs.gov |
| 1/20/89 | 5:41 PM | 3.4 | 60.9 km | 10,000 m | New South Wales, Australia | usgs.gov |
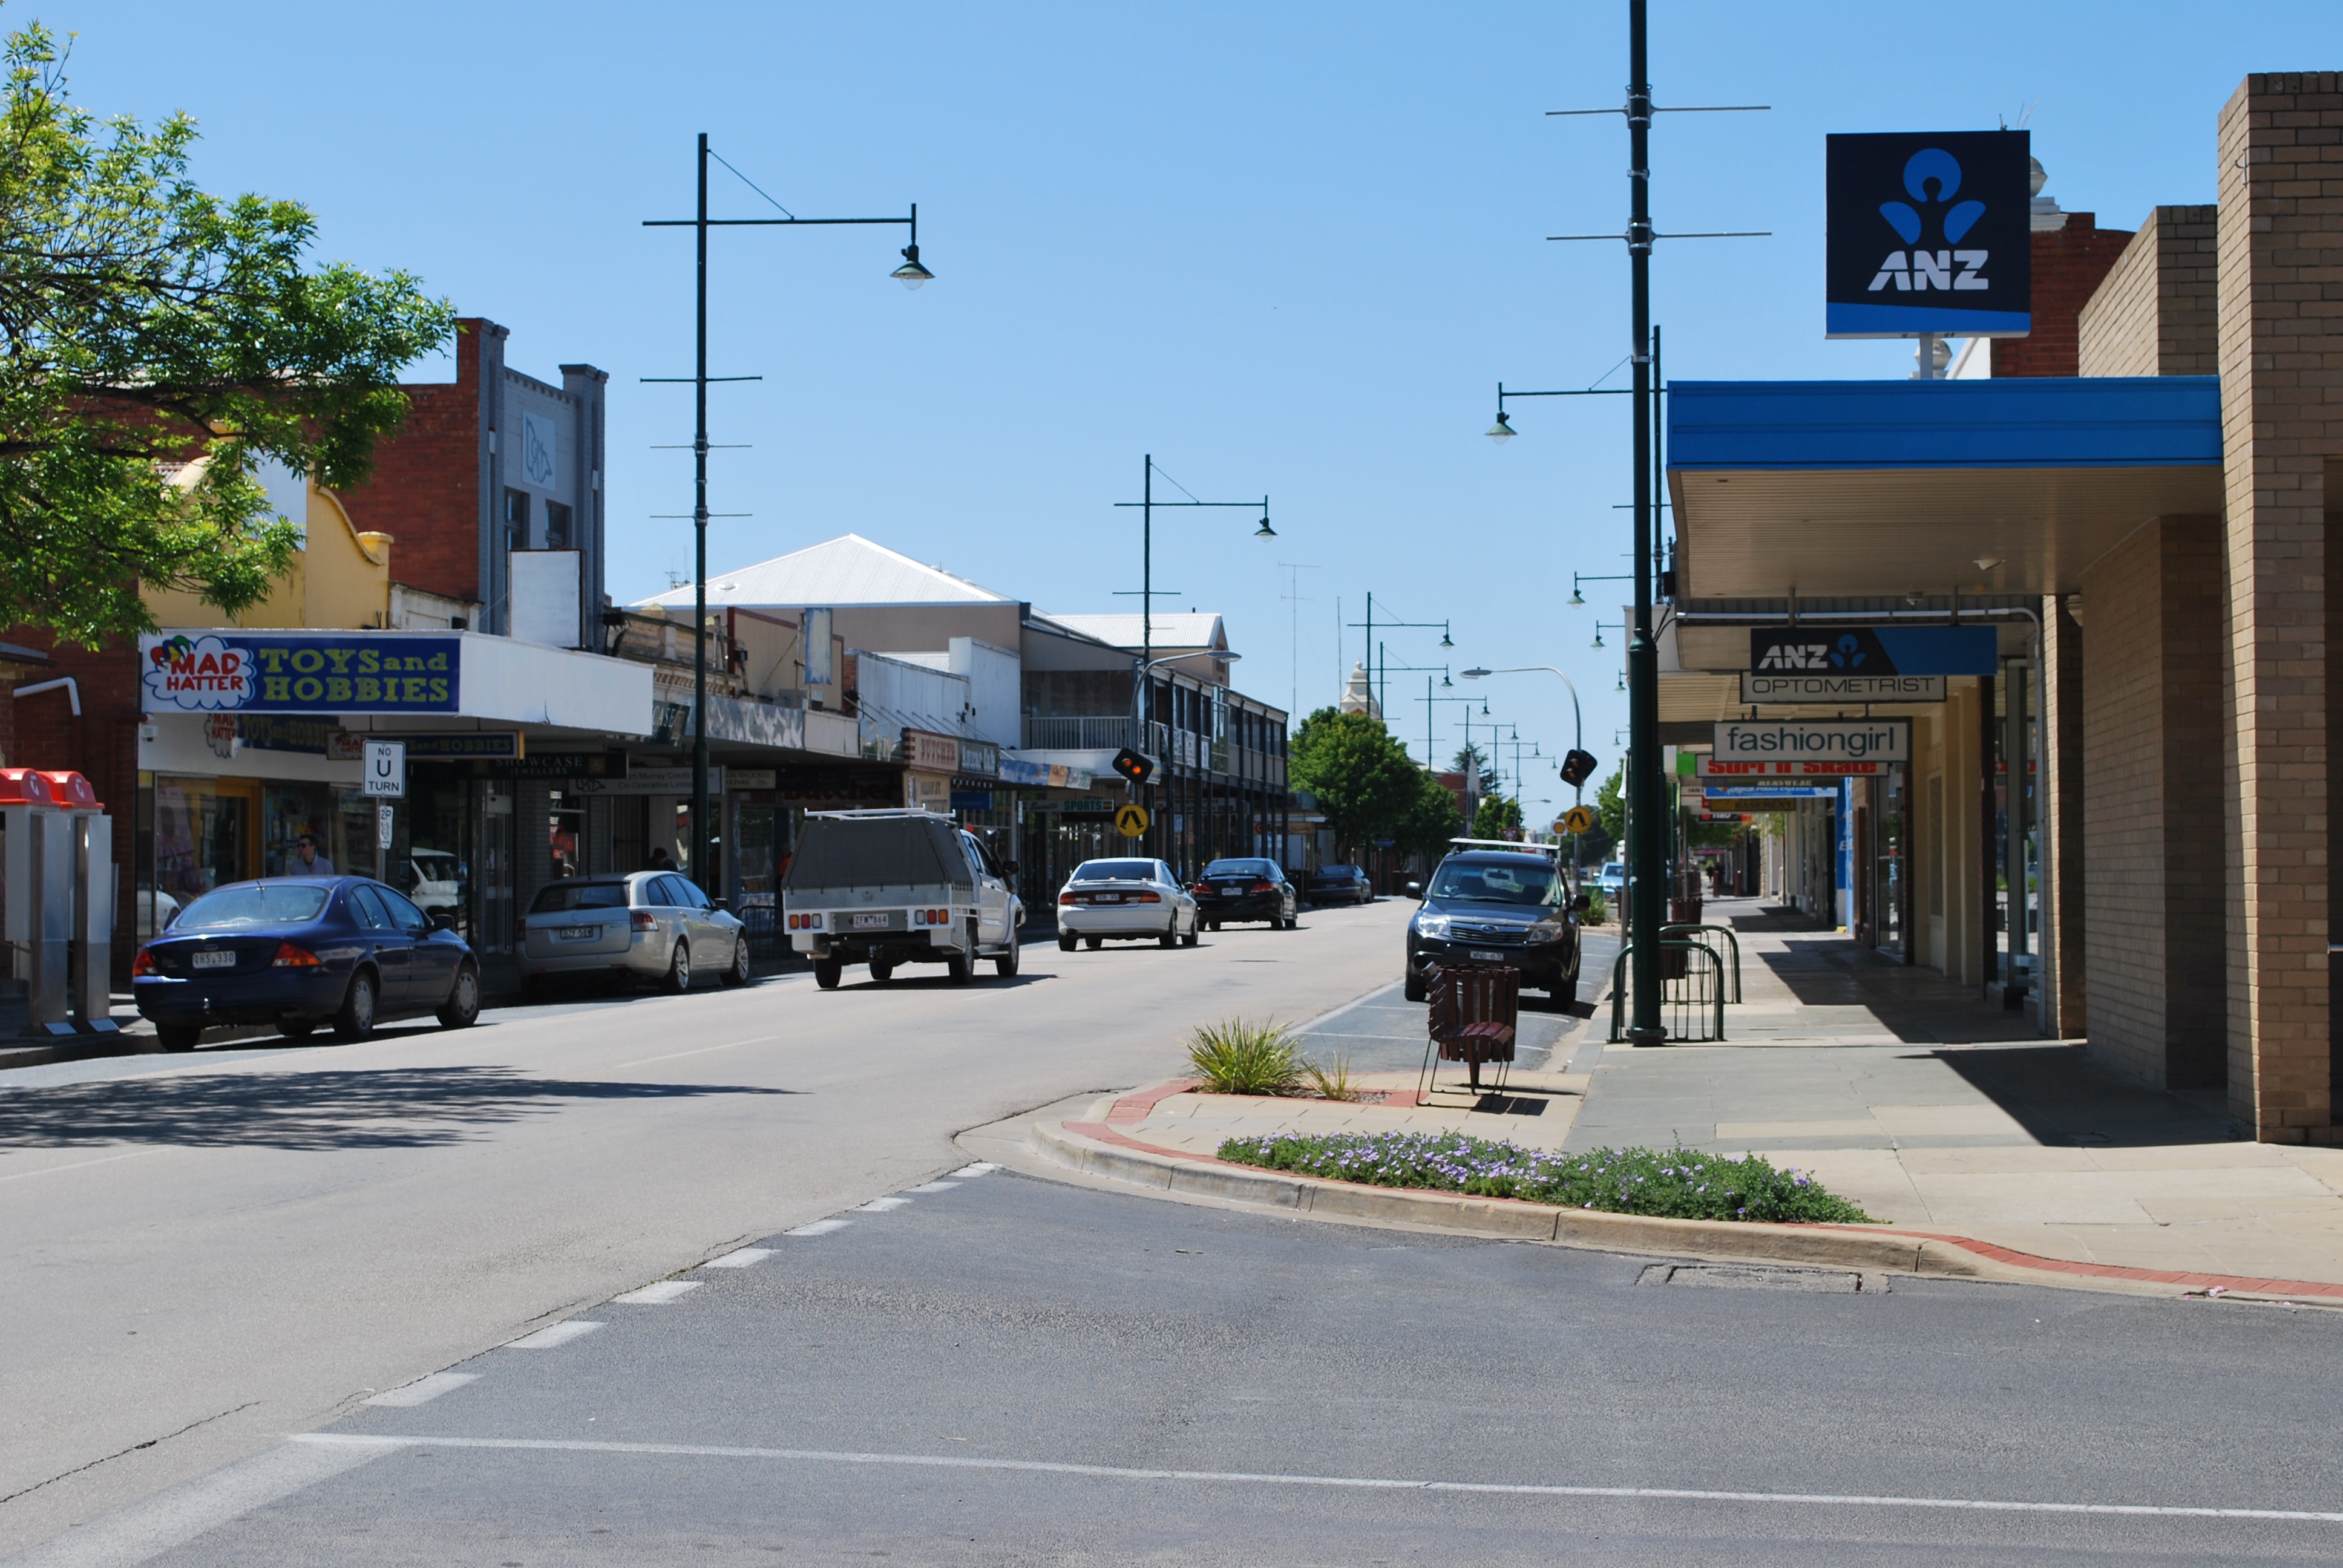
Moama
Moama (/moʊˈɑːmə/ or /moʊˈæmə/) is a town in the Riverina district of southern New South Wales, Australia, in the Murray Shire local government area. The town is directly across the Murray River from the larger town of Echuca in the neighbouring stat..
Moama Wikipedia Page


About Our Data
The data on this page is estimated using a number of publicly available tools and resources. It is provided without warranty, and could contain inaccuracies. Use at your own risk.