Mount Fox Facts
| Area | 118.8 km² |
| Median Age | 43.6 years (Male: 41.6, Female: 45.1) |
| Local Time | |
| Timezone | Australian Eastern Standard Time |
| Lat & Lng | -18.81667, 145.83333 |
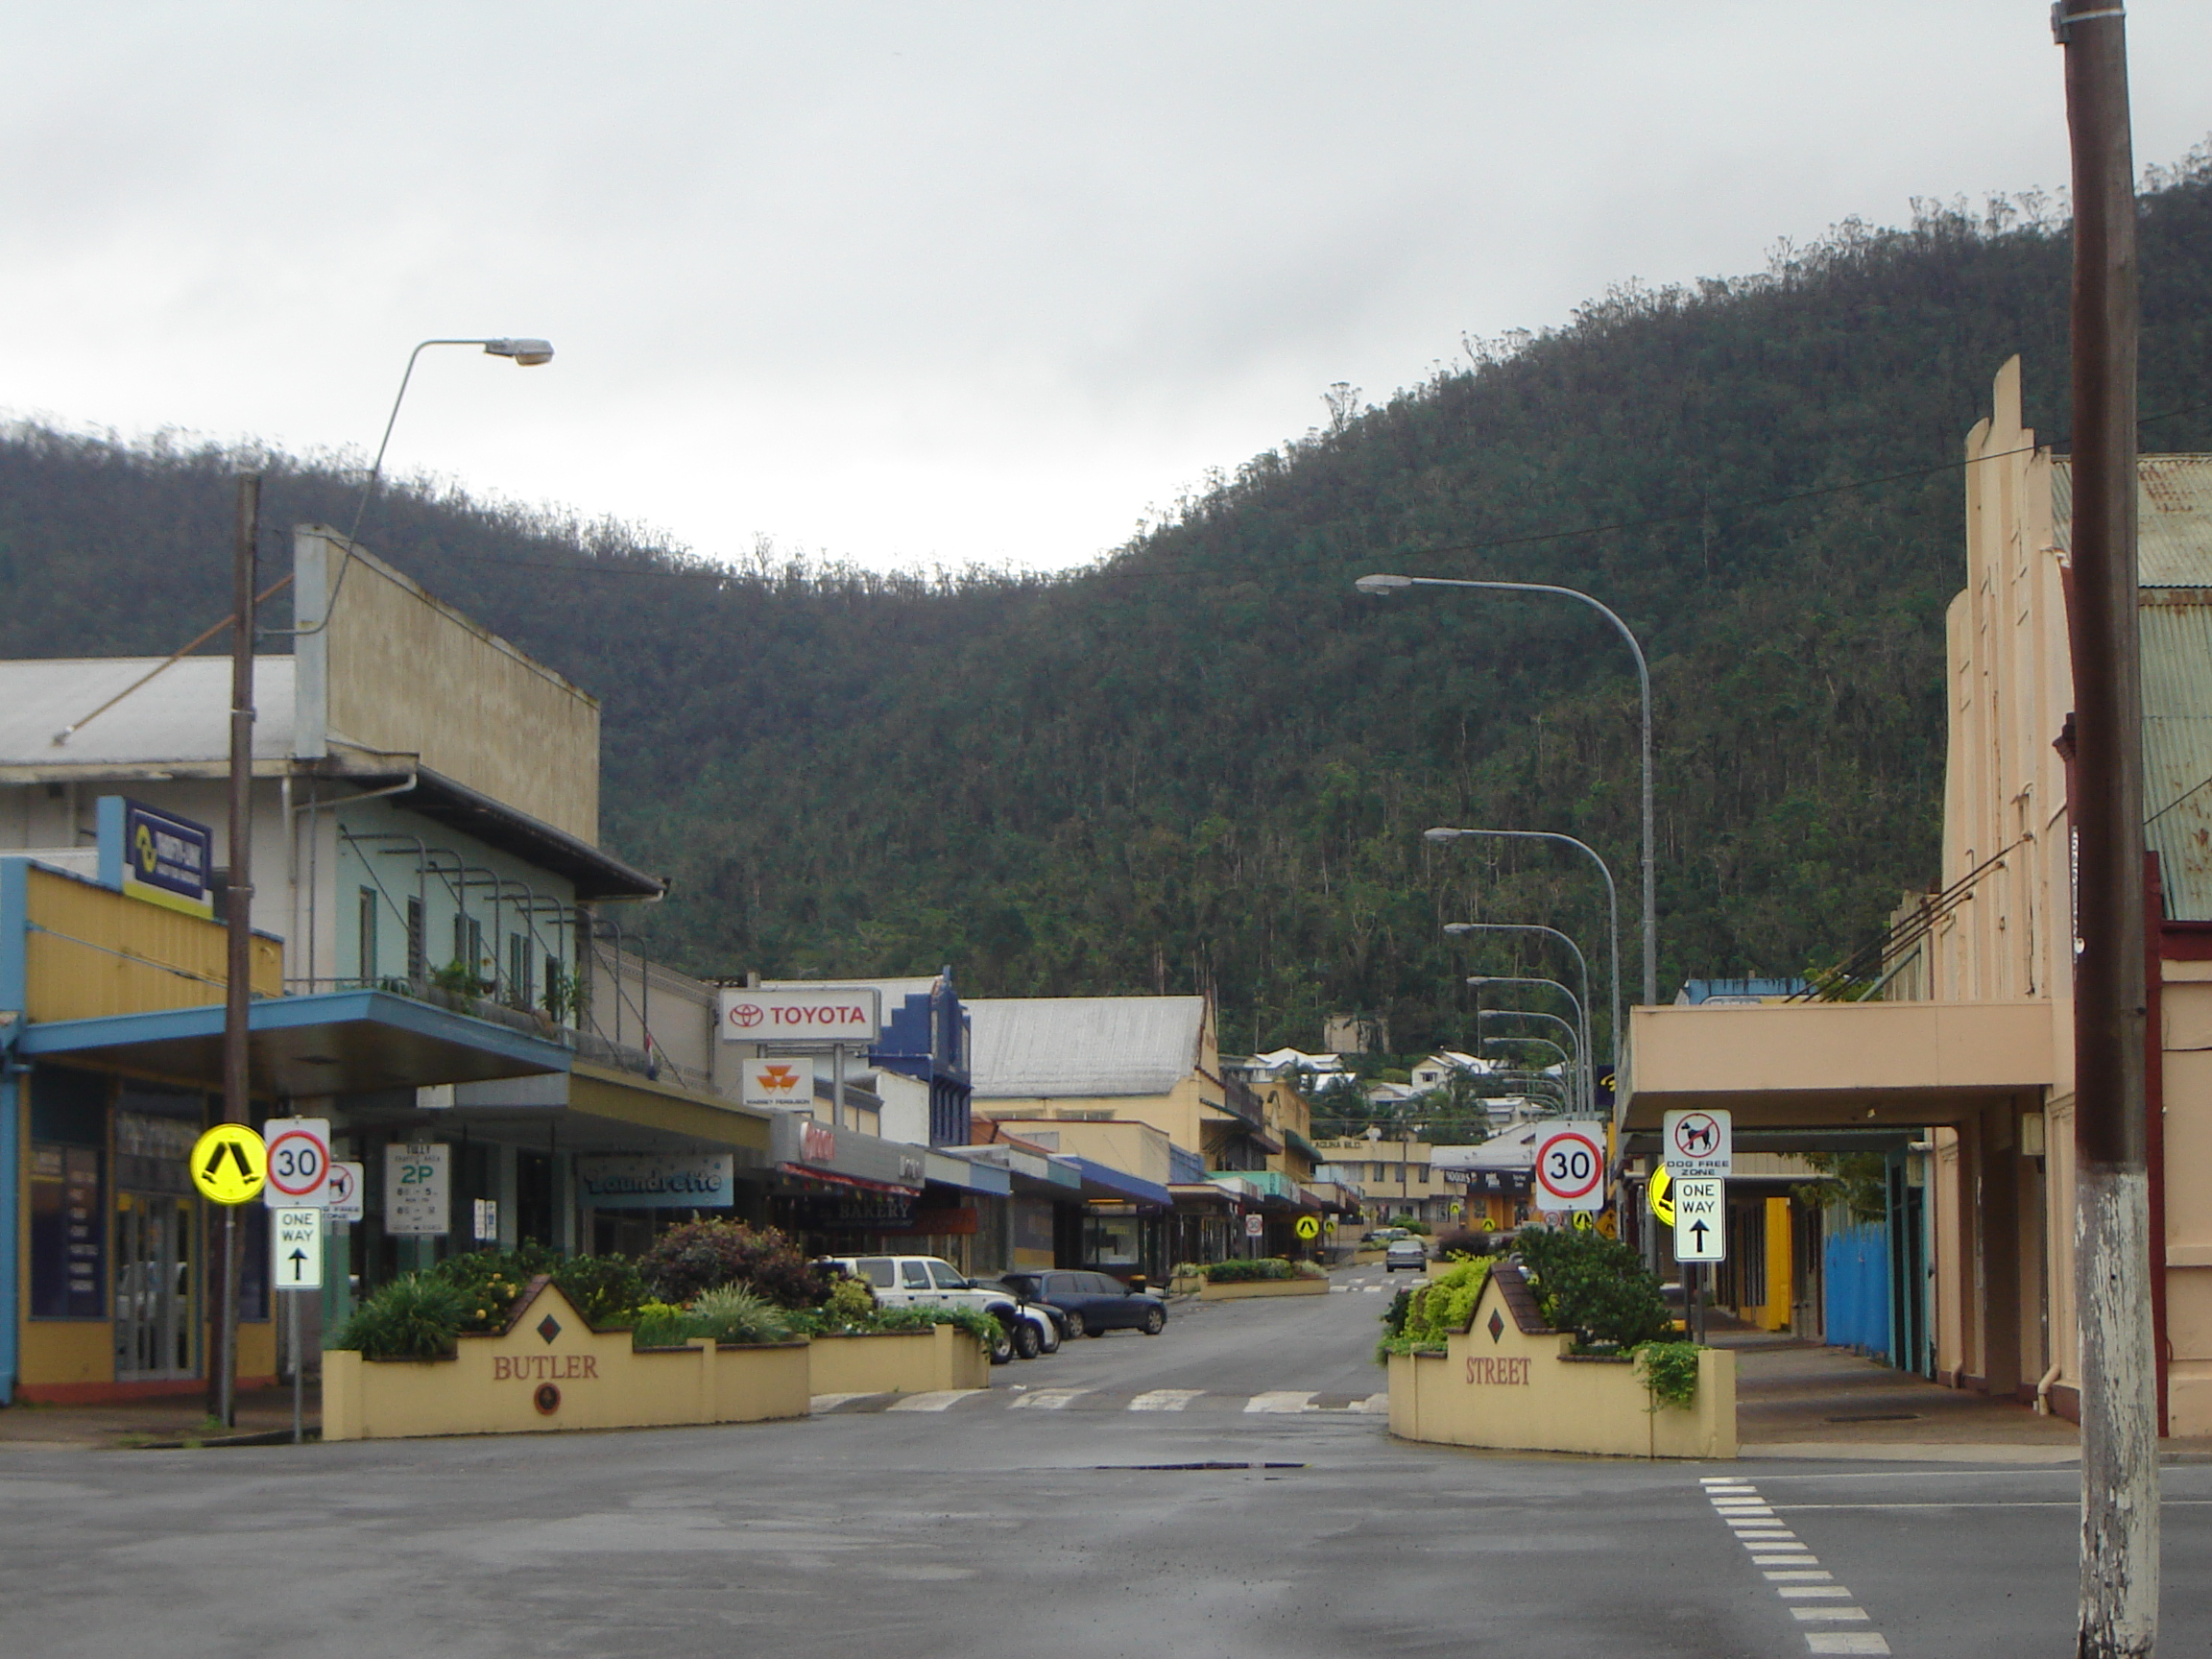
Map of Mount Fox
Interactive Map
Mount Fox Population
Years 1975 to 2015
| Data | 1975 | 1990 | 2000 | 2015 |
|---|---|---|---|---|
| Population | 1 | 0 | 0 | 0 |
| Population Density | 0 / km² | 0 / km² | 0 / km² | 0 / km² |
Mount Fox Population change from 2000 to 2000
| Location | Change since 1975 | Change since 1990 |
|---|---|---|
| Mount Fox | — | — |
| Queensland | +37.6% | +11.8% |
| Australia | +37.6% | +11.8% |
Mount Fox Median Age
Median Age: 43.6 years
| Location | Median Age | Median Age (Female) | Median Age (Male) |
|---|---|---|---|
| Mount Fox | 43.6 yrs | 45.1 yrs | 41.6 yrs |
| Queensland | 36.8 yrs | 37.5 yrs | 36.1 yrs |
| Australia | 37.7 yrs | 38.6 yrs | 36.8 yrs |
Queensland Population Density
Population Density: 2.7 / km²
| Location | Population | Area | Density |
|---|---|---|---|
| Queensland | 4.8 million | 1,730,083.5 km² | 2.7 / km² |
| Australia | 23.8 million | 7,690,961.5 km² | 3.1 / km² |
Mount Fox Historical and Projected Population
Estimated Population from 0 to 2015
- JRC (European Commission's Joint Research Centre) work on the GHS built-up grid
- CIESIN (Center for International Earth Science Information Network)
- [Link] Klein Goldewijk, K., Beusen, A., Doelman, J., and Stehfest, E.: Anthropogenic land use estimates for the Holocene – HYDE 3.2, Earth Syst. Sci. Data, 9, 927–953, https://doi.org/10.5194/essd-9-927-2017, 2017.
Human Development Index (HDI)
Statistic composite index of life expectancy, education, and per capita income.
Queensland CO2 Emissions
Carbon Dioxide (CO2) Emissions Per Capita in Tonnes Per Year
| Location | CO2 Emissions | CO2 Emissions Per Capita | CO2 Emissions Intensity |
|---|---|---|---|
| Queensland | 83,884,578 tn | 17.64 tn | 48.5 tons/km² |
| Australia | 401,155,564 tn | 16.88 tn | 52.2 tons/km² |
| 2013 CO2 emissions (tonnes/year) | 83,884,578 tn |
| 2013 CO2 emissions (tonnes/year) per capita | 17.64 tn |
| 2013 CO2 emissions intensity (tonnes/km²/year) | 48.5 tons/km² |
Natural Hazards Risk
Relative risk out of 10
| Hazard | Risk Level |
|---|---|
| Drought | High (9) |
| Earthquake | Low (2) |
| Cyclone | Medium (5) |
* Risk, particularly concerning flood or landslide, may not be for the entire area.
- Dilley, M., R.S. Chen, U. Deichmann, A.L. Lerner-Lam, M. Arnold, J. Agwe, P. Buys, O. Kjekstad, B. Lyon, and G. Yetman. 2005. Natural Disaster Hotspots: A Global Risk Analysis. Washington, D.C.: World Bank. https://doi.org/10.1596/0-8213-5930-4.
- Center for Hazards and Risk Research - CHRR - Columbia University, Center for International Earth Science Information Network - CIESIN - Columbia University, International Bank for Reconstruction and Development - The World Bank, and United Nations Environment Programme Global Resource Information Database Geneva - UNEP/GRID-Geneva. 2005. Global Cyclone Hazard Frequency and Distribution. Palisades, NY: NASA Socioeconomic Data and Applications Center (SEDAC). https://doi.org/10.7927/H4CZ353K.
- Center for Hazards and Risk Research - CHRR - Columbia University, Center for International Earth Science Information Network - CIESIN - Columbia University, and International Research Institute for Climate and Society - IRI - Columbia University. 2005. Global Drought Hazard Frequency and Distribution. Palisades, NY: NASA Socioeconomic Data and Applications Center (SEDAC). https://doi.org/10.7927/H4VX0DFT.
- Center for Hazards and Risk Research - CHRR - Columbia University, Center for International Earth Science Information Network - CIESIN - Columbia University. 2005. Global Earthquake Hazard Distribution - Peak Ground Acceleration. Palisades, NY: NASA Socioeconomic Data and Applications Center (SEDAC). https://doi.org/10.7927/H4BZ63ZS.
Mount Fox (Queensland)
Mount Fox is a 560,000-year-old cinder cone located 50 km west of Ingham, Queensland, Australia. Mount Fox has a shallow crater and a lava flow that extends away from the southern base of the cone. The cone lies on basaltic lava flows that are 23.6 m..
Mount Fox (Queensland) Wikipedia Page")

About Our Data
The data on this page is estimated using a number of publicly available tools and resources. It is provided without warranty, and could contain inaccuracies. Use at your own risk.