Categories in Muttaburra
Muttaburra Facts
| Area | 31.3 km² |
| Population | 293 |
| Population change (1975 to 2020) | +29200.0% |
| Population change (2000 to 2020) | +19.1% |
| Local Time | |
| Timezone | Australian Eastern Standard Time |
| Lat & Lng | -22.60000, 144.55000 |
Map of Muttaburra
Interactive Map
Muttaburra Population
Years 1975 to 2020
| Data | 1975 | 1990 | 2000 | 2015 | 2020 |
|---|---|---|---|---|---|
| Population | 1 | 199 | 246 | 264 | 293 |
| Population Density | 0 / km² | 6.4 / km² | 7.9 / km² | 8.4 / km² | 9.4 / km² |
Sources: JRC (European Commission's Joint Research Centre) work on the GHS built-up grid
Muttaburra Population change from 2000 to 2015
Increase of 7.3% from year 2000 to 2015
| Location | Change since 1975 | Change since 1990 | Change since 2000 |
|---|---|---|---|
| Muttaburra | +26300% | +32.7% | +7.3% |
| Queensland | +72.7% | +40.3% | +25.5% |
| Australia | +72.6% | +40.3% | +25.5% |
Sources: JRC (European Commission's Joint Research Centre) work on the GHS built-up grid
Muttaburra Population Density
Population Density: 9.4 / km²
| Location | Population | Area | Density |
|---|---|---|---|
| Muttaburra | 293 | 31.3 km² | 9.4 / km² |
| Queensland | 4.8 million | 1,730,083.5 km² | 2.7 / km² |
| Australia | 23.8 million | 7,690,961.5 km² | 3.1 / km² |
Sources: JRC (European Commission's Joint Research Centre) work on the GHS built-up grid
Muttaburra Historical and Projected Population
Estimated Population from 1975 to 2100
Sources:
- JRC (European Commission's Joint Research Centre) work on the GHS built-up grid
- CIESIN (Center for International Earth Science Information Network)
- [Link] Klein Goldewijk, K., Beusen, A., Doelman, J., and Stehfest, E.: Anthropogenic land use estimates for the Holocene – HYDE 3.2, Earth Syst. Sci. Data, 9, 927–953, https://doi.org/10.5194/essd-9-927-2017, 2017.
Human Development Index (HDI)
Statistic composite index of life expectancy, education, and per capita income.
Source: [Link] Kummu, M., Taka, M. &Guillaume, J. Gridded global datasets for Gross Domestic Product and Human Development Index over 1990–2015. Sci Data 5, 180004 (2018) doi:10.1038/sdata.2018.4
Muttaburra CO2 Emissions
Carbon Dioxide (CO2) Emissions Per Capita in Tonnes Per Year
| Location | CO2 Emissions | CO2 Emissions Per Capita | CO2 Emissions Intensity |
|---|---|---|---|
| Muttaburra | 5,232 tn | 17.86 tn | 167.4 tons/km² |
| Queensland | 83,884,578 tn | 17.64 tn | 48.5 tons/km² |
| Australia | 401,155,564 tn | 16.88 tn | 52.2 tons/km² |
Sources: [Link] Moran, D., Kanemoto K; Jiborn, M., Wood, R., Többen, J., and Seto, K.C. (2018) Carbon footprints of 13,000 cities. Environmental Research Letters DOI: 10.1088/1748-9326/aac72a
Muttaburra CO2 Emissions
| 2013 CO2 emissions (tonnes/year) | 5,232 tn |
| 2013 CO2 emissions (tonnes/year) per capita | 17.86 tn |
| 2013 CO2 emissions intensity (tonnes/km²/year) | 167.4 tons/km² |
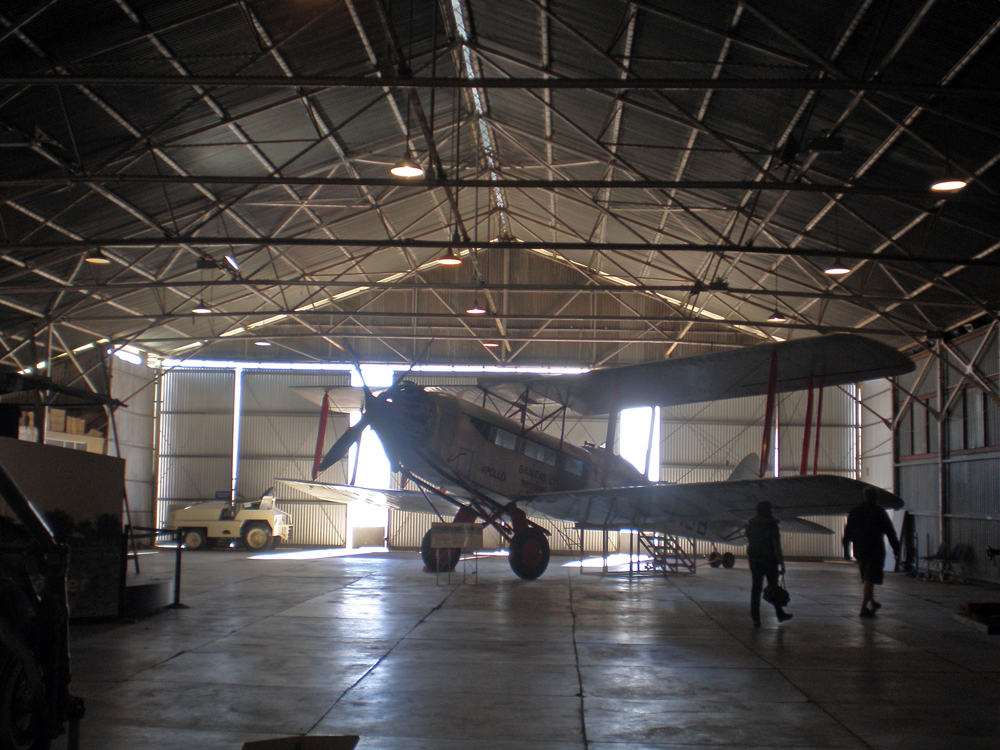
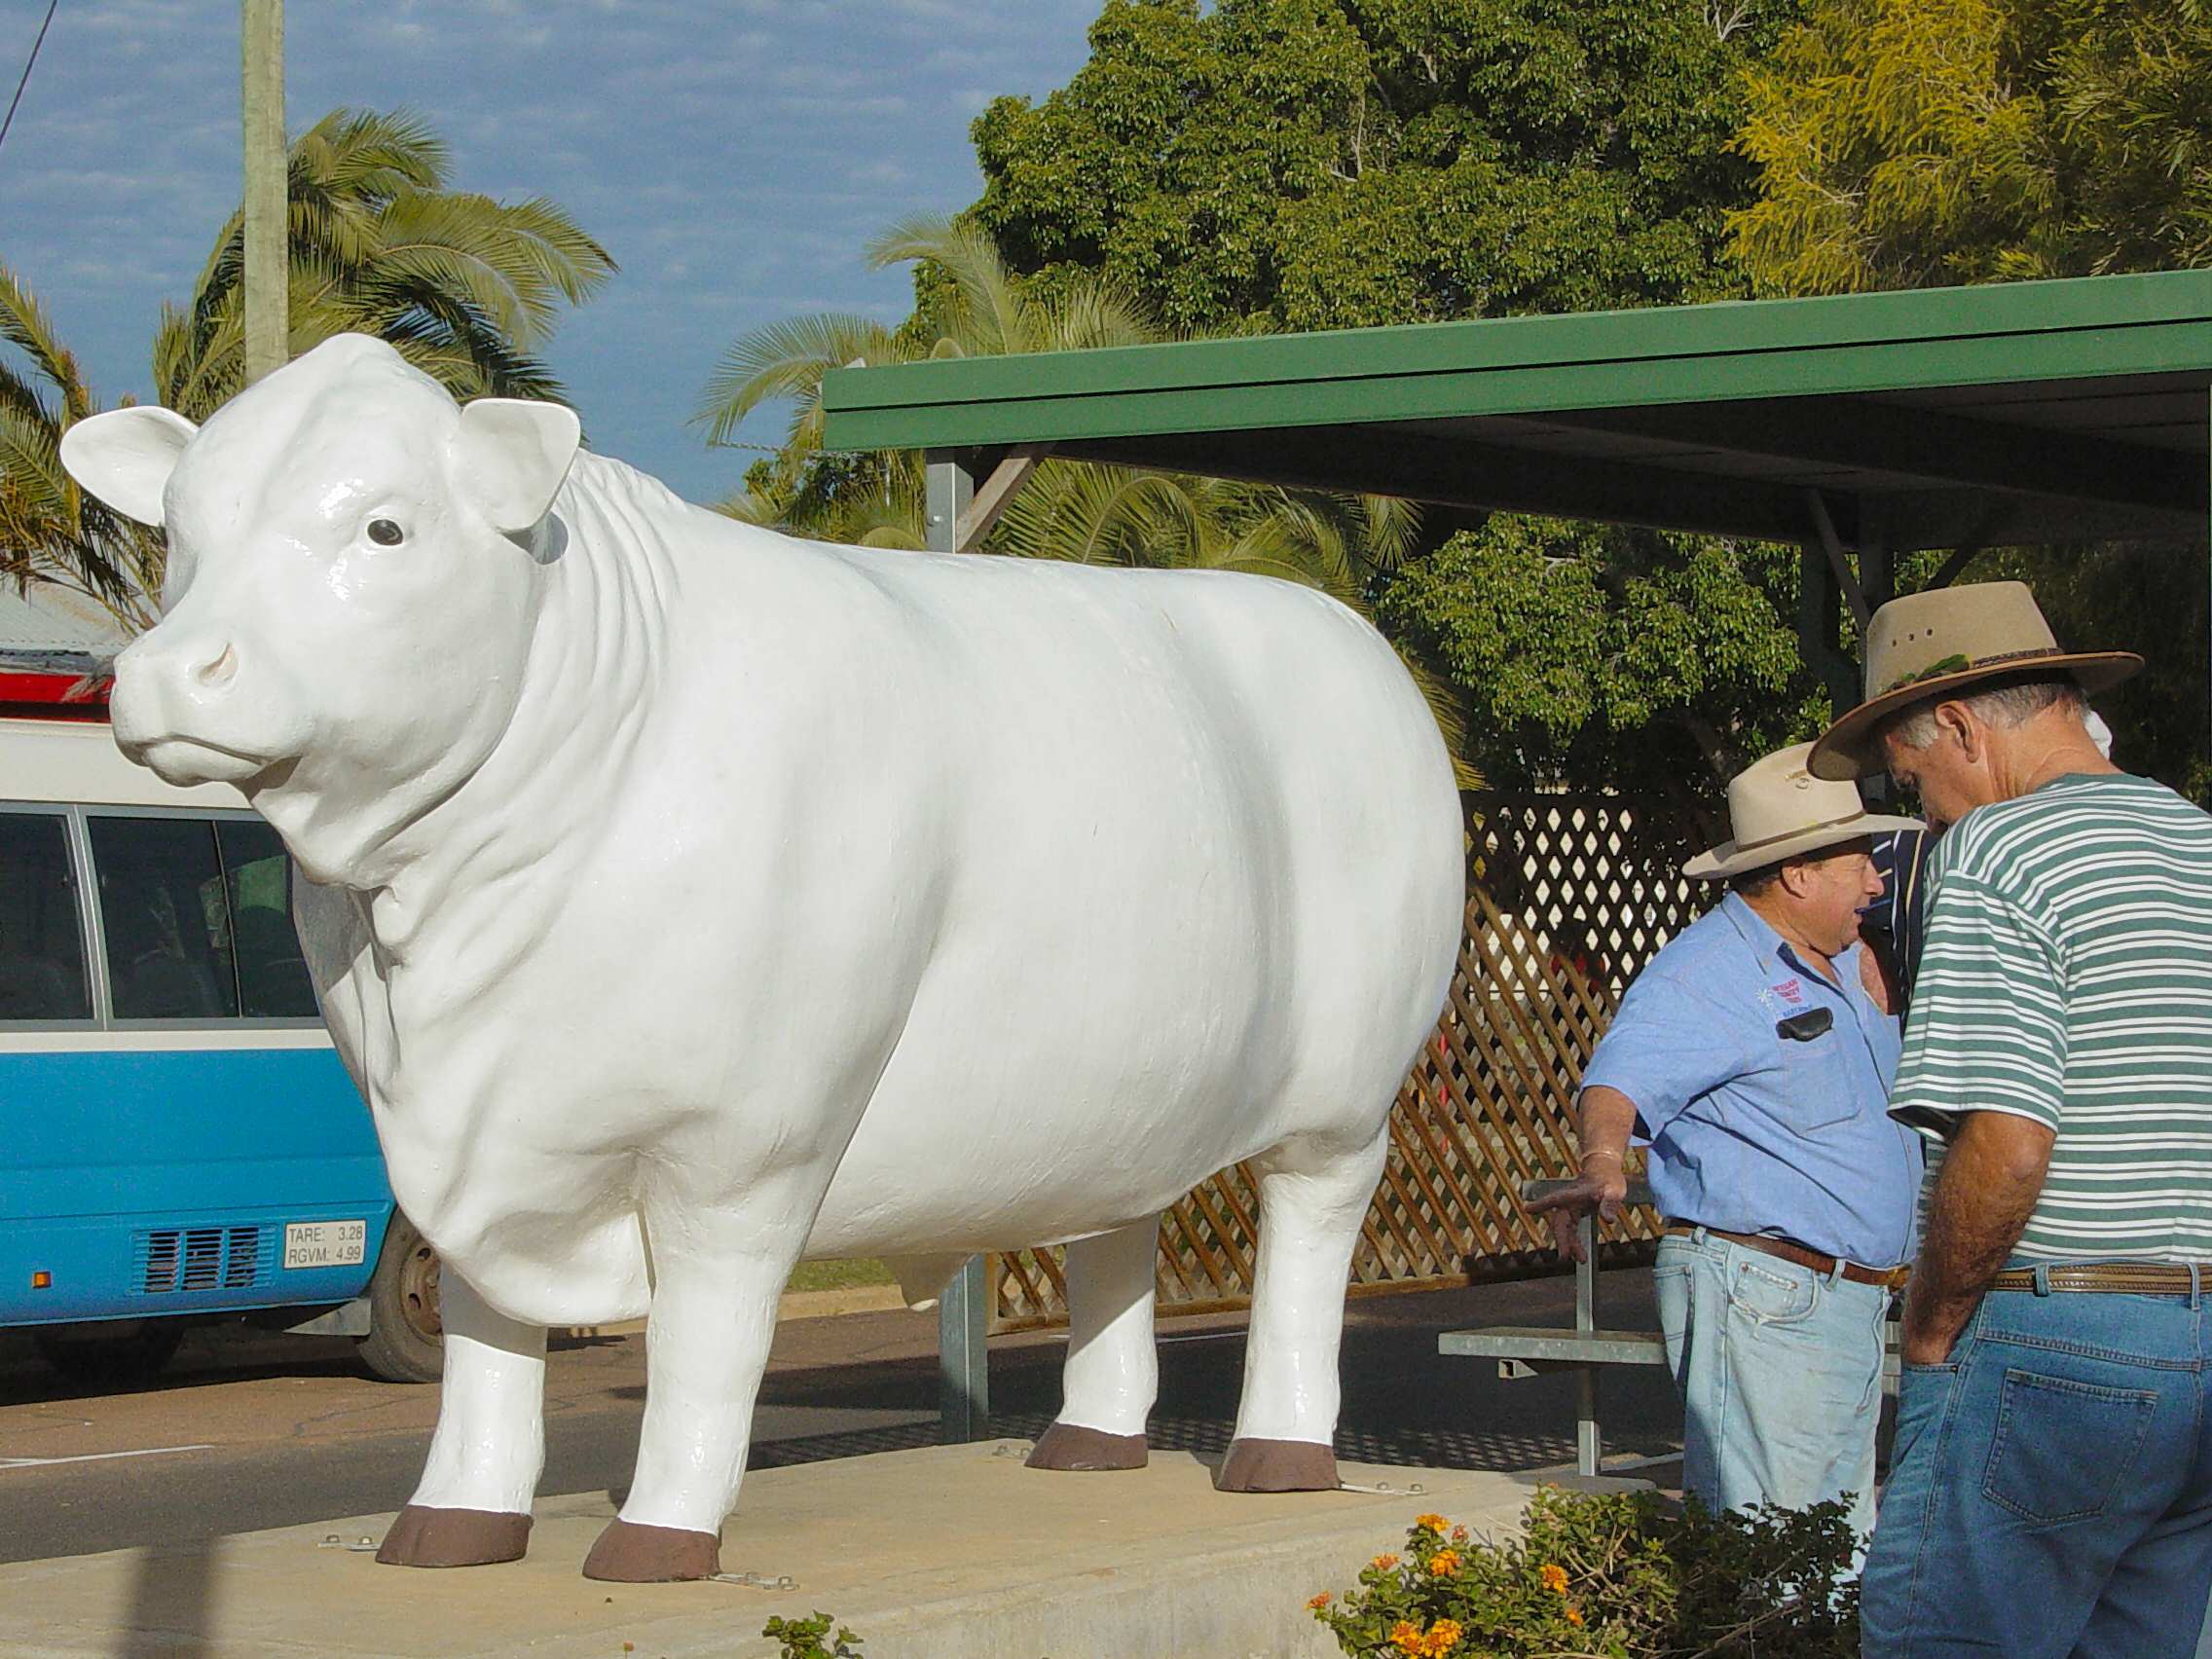
Muttaburra
Muttaburra /ˈmʌtəbʌrə/ is a small grazing town located in Central West Queensland, Australia. The town is located on the banks of the Thomson River, approximately 120 kilometres (75 mi) north of the town of Longreach and 84 kilometres (52 mi) north o..
Muttaburra Wikipedia Page

About Our Data
The data on this page is estimated using a number of publicly available tools and resources. It is provided without warranty, and could contain inaccuracies. Use at your own risk.