Industries
Business Distribution by Industry in Natimuk
| Industry Description | Number of Establishments |
|---|---|
| Public parks | 5 |
Natimuk Facts
| Area | 2.1 km² |
| Population | 544 |
| Male Population | 254 (46.7%) |
| Female Population | 290 (53.3%) |
| Population change (1975 to 2020) | +64.4% |
| Population change (2000 to 2020) | +33.7% |
| Median Age | 52.2 years (Male: 50.8, Female: 53.8) |
| Local Time | |
| Timezone | Australian Eastern Standard Time |
| Lat & Lng | -36.74028, 141.94516 |
Map of Natimuk
Interactive Map
Natimuk Population
Years 1975 to 2020
| Data | 1975 | 1990 | 2000 | 2015 | 2020 |
|---|---|---|---|---|---|
| Population | 331 | 379 | 407 | 501 | 544 |
| Population Density | 155.8 / km² | 178.4 / km² | 191.5 / km² | 235.8 / km² | 256 / km² |
Natimuk Population change from 2000 to 2015
Increase of 23.1% from year 2000 to 2015
| Location | Change since 1975 | Change since 1990 | Change since 2000 |
|---|---|---|---|
| Natimuk | +51.4% | +32.2% | +23.1% |
| Victoria (Australia) | +72.6% | +40.2% | +25.5% |
| Australia | +72.6% | +40.3% | +25.5% |
Natimuk Median Age
Median Age: 52.2 years
| Location | Median Age | Median Age (Female) | Median Age (Male) |
|---|---|---|---|
| Natimuk | 52.2 yrs | 53.8 yrs | 50.8 yrs |
| Victoria (Australia) | 37.6 yrs | 38.6 yrs | 36.6 yrs |
| Australia | 37.7 yrs | 38.6 yrs | 36.8 yrs |
Natimuk Population Density
Population Density: 256 / km²
| Location | Population | Area | Density |
|---|---|---|---|
| Natimuk | 544 | 2.125 km² | 256 / km² |
| Victoria (Australia) | 5.9 million | 227,400.2 km² | 26.1 / km² |
| Australia | 23.8 million | 7,690,961.5 km² | 3.1 / km² |
Natimuk Historical and Projected Population
Estimated Population from 1850 to 2100
- JRC (European Commission's Joint Research Centre) work on the GHS built-up grid
- CIESIN (Center for International Earth Science Information Network)
- [Link] Klein Goldewijk, K., Beusen, A., Doelman, J., and Stehfest, E.: Anthropogenic land use estimates for the Holocene – HYDE 3.2, Earth Syst. Sci. Data, 9, 927–953, https://doi.org/10.5194/essd-9-927-2017, 2017.
Price Distribution
Business distribution by price for Natimuk
Human Development Index (HDI)
Statistic composite index of life expectancy, education, and per capita income.
Natimuk CO2 Emissions
Carbon Dioxide (CO2) Emissions Per Capita in Tonnes Per Year
| Location | CO2 Emissions | CO2 Emissions Per Capita | CO2 Emissions Intensity |
|---|---|---|---|
| Natimuk | 9,520 tn | 17.5 tn | 4,480.1 tons/km² |
| Victoria (Australia) | 101,123,087 tn | 17.02 tn | 444.7 tons/km² |
| Australia | 401,155,564 tn | 16.88 tn | 52.2 tons/km² |
| 2013 CO2 emissions (tonnes/year) | 9,520 tn |
| 2013 CO2 emissions (tonnes/year) per capita | 17.5 tn |
| 2013 CO2 emissions intensity (tonnes/km²/year) | 4,480.1 tons/km² |
Natural Hazards Risk
Relative risk out of 10
| Hazard | Risk Level |
|---|---|
| Drought | Medium (4) |
| Earthquake | Low (2) |
* Risk, particularly concerning flood or landslide, may not be for the entire area.
- Dilley, M., R.S. Chen, U. Deichmann, A.L. Lerner-Lam, M. Arnold, J. Agwe, P. Buys, O. Kjekstad, B. Lyon, and G. Yetman. 2005. Natural Disaster Hotspots: A Global Risk Analysis. Washington, D.C.: World Bank. https://doi.org/10.1596/0-8213-5930-4.
- Center for Hazards and Risk Research - CHRR - Columbia University, Center for International Earth Science Information Network - CIESIN - Columbia University, and International Research Institute for Climate and Society - IRI - Columbia University. 2005. Global Drought Hazard Frequency and Distribution. Palisades, NY: NASA Socioeconomic Data and Applications Center (SEDAC). https://doi.org/10.7927/H4VX0DFT.
- Center for Hazards and Risk Research - CHRR - Columbia University, Center for International Earth Science Information Network - CIESIN - Columbia University. 2005. Global Earthquake Hazard Distribution - Peak Ground Acceleration. Palisades, NY: NASA Socioeconomic Data and Applications Center (SEDAC). https://doi.org/10.7927/H4BZ63ZS.
Recent Nearby Earthquakes
Magnitude 3.0 and greater
| Date▼ | Time↕ | Magnitude↕ | Distance↕ | Depth↕ | Location↕ | Link |
|---|---|---|---|---|---|---|
| 6/1/11 | 3:29 AM | 3.8 | 93.5 km | 2,000 m | near the southeast coast of Australia | usgs.gov |
| 12/22/87 | 3:06 PM | 4.6 | 89.5 km | 10,000 m | Victoria, Australia | usgs.gov |
| 6/25/85 | 9:55 PM | 3.3 | 51.9 km | 33,000 m | near the southeast coast of Australia | usgs.gov |
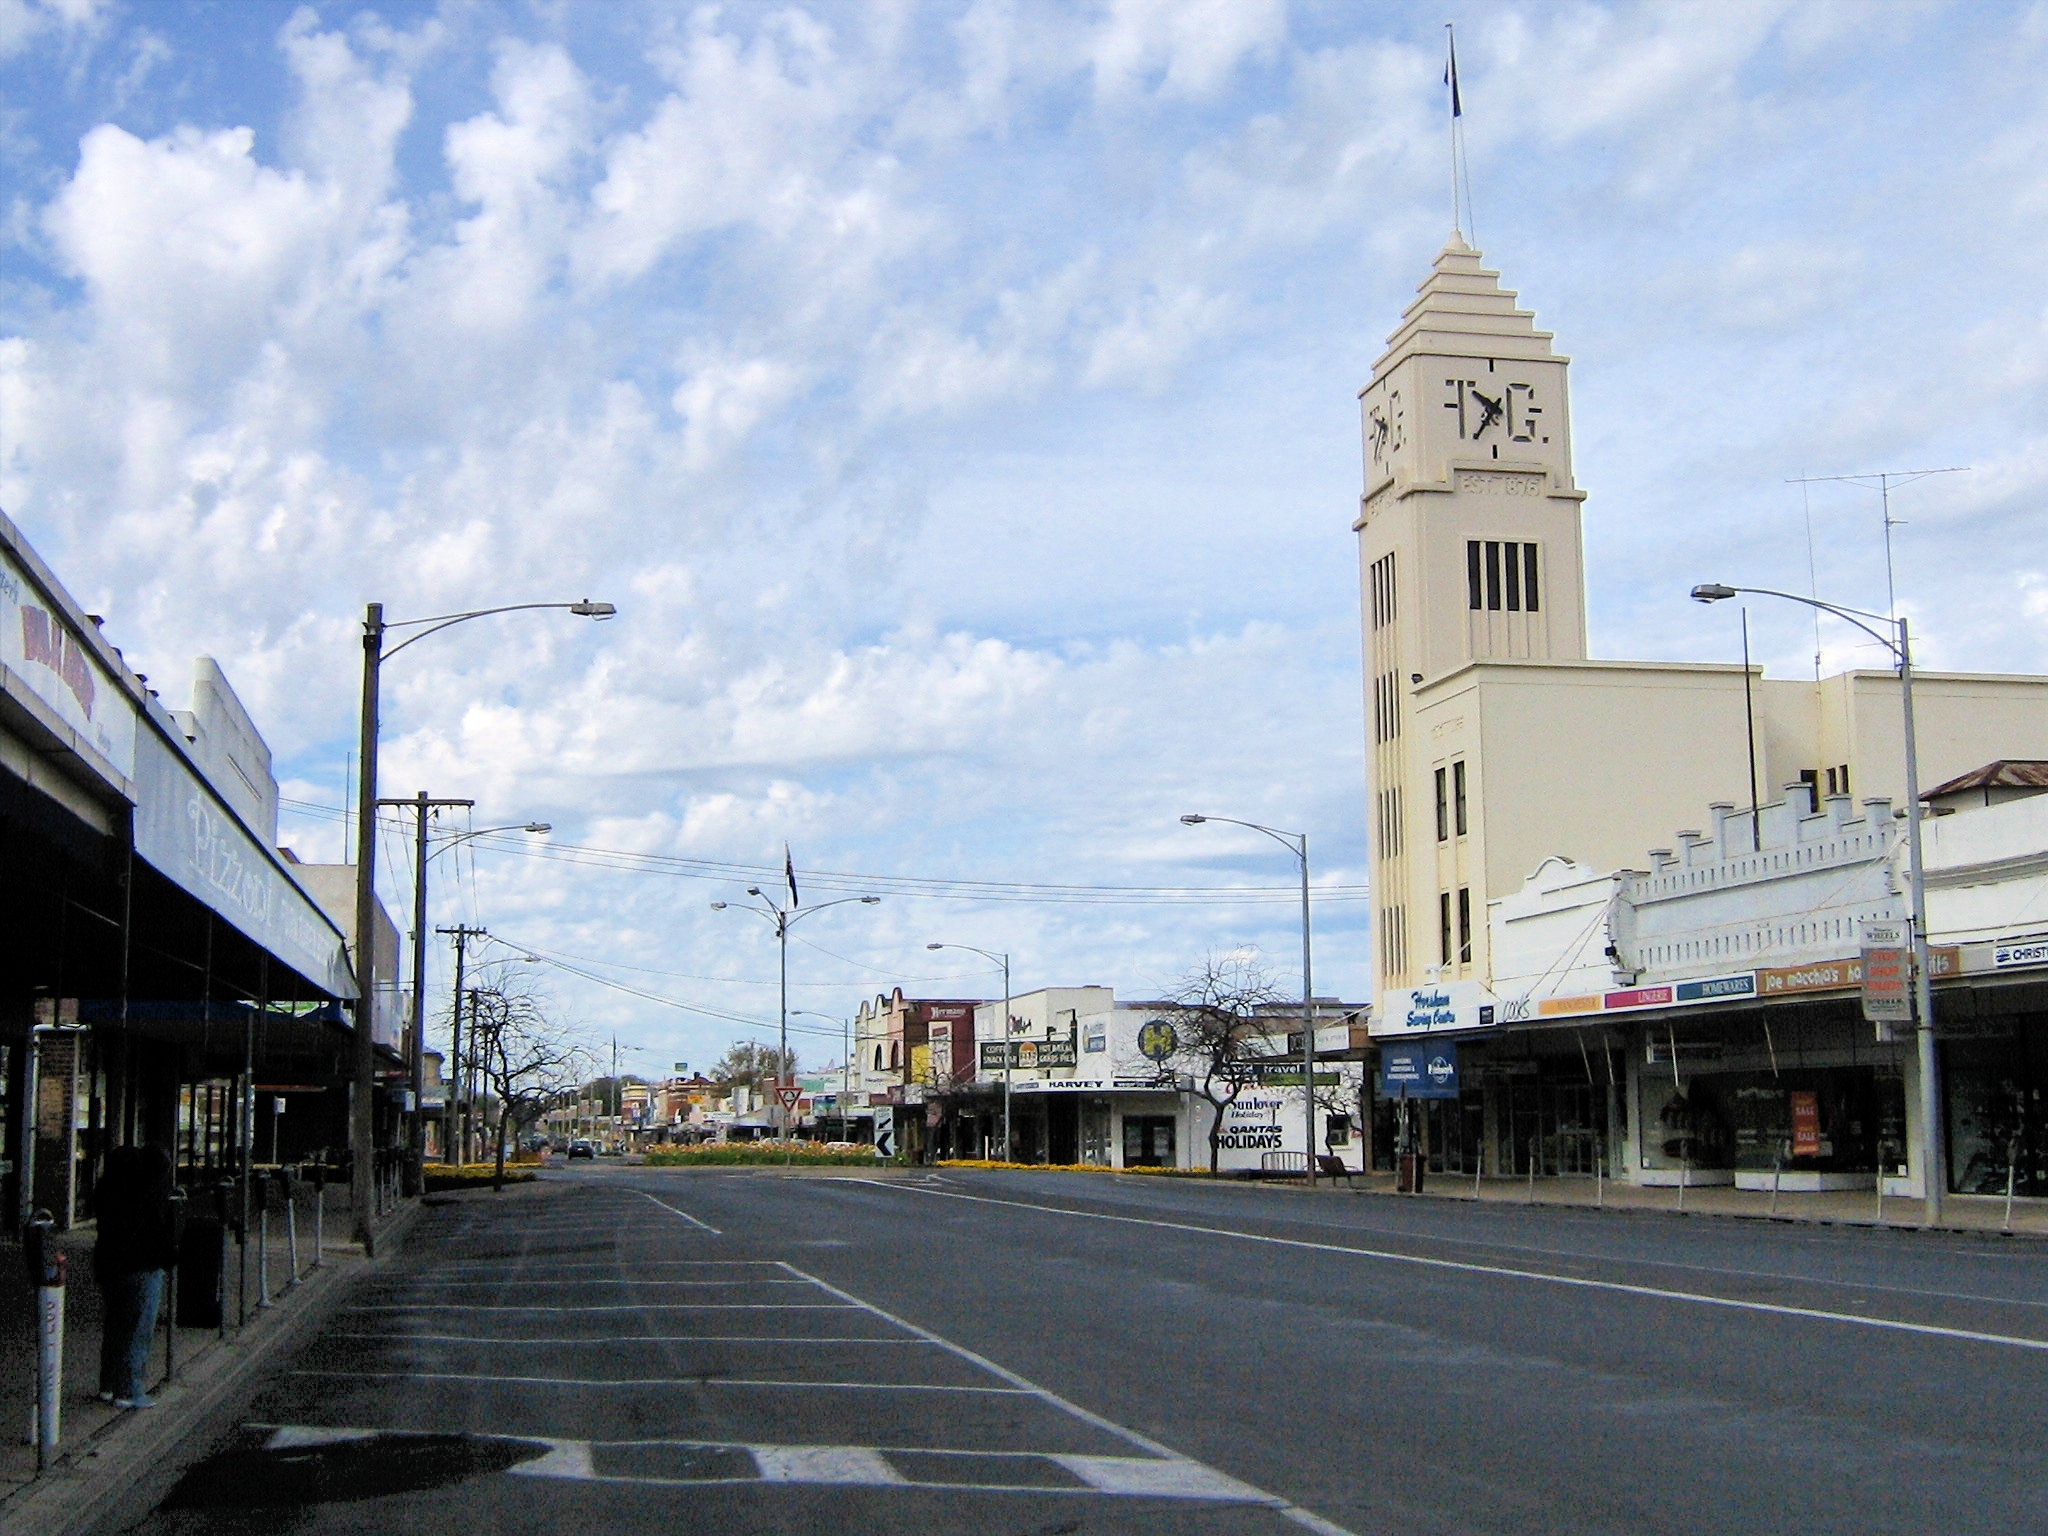
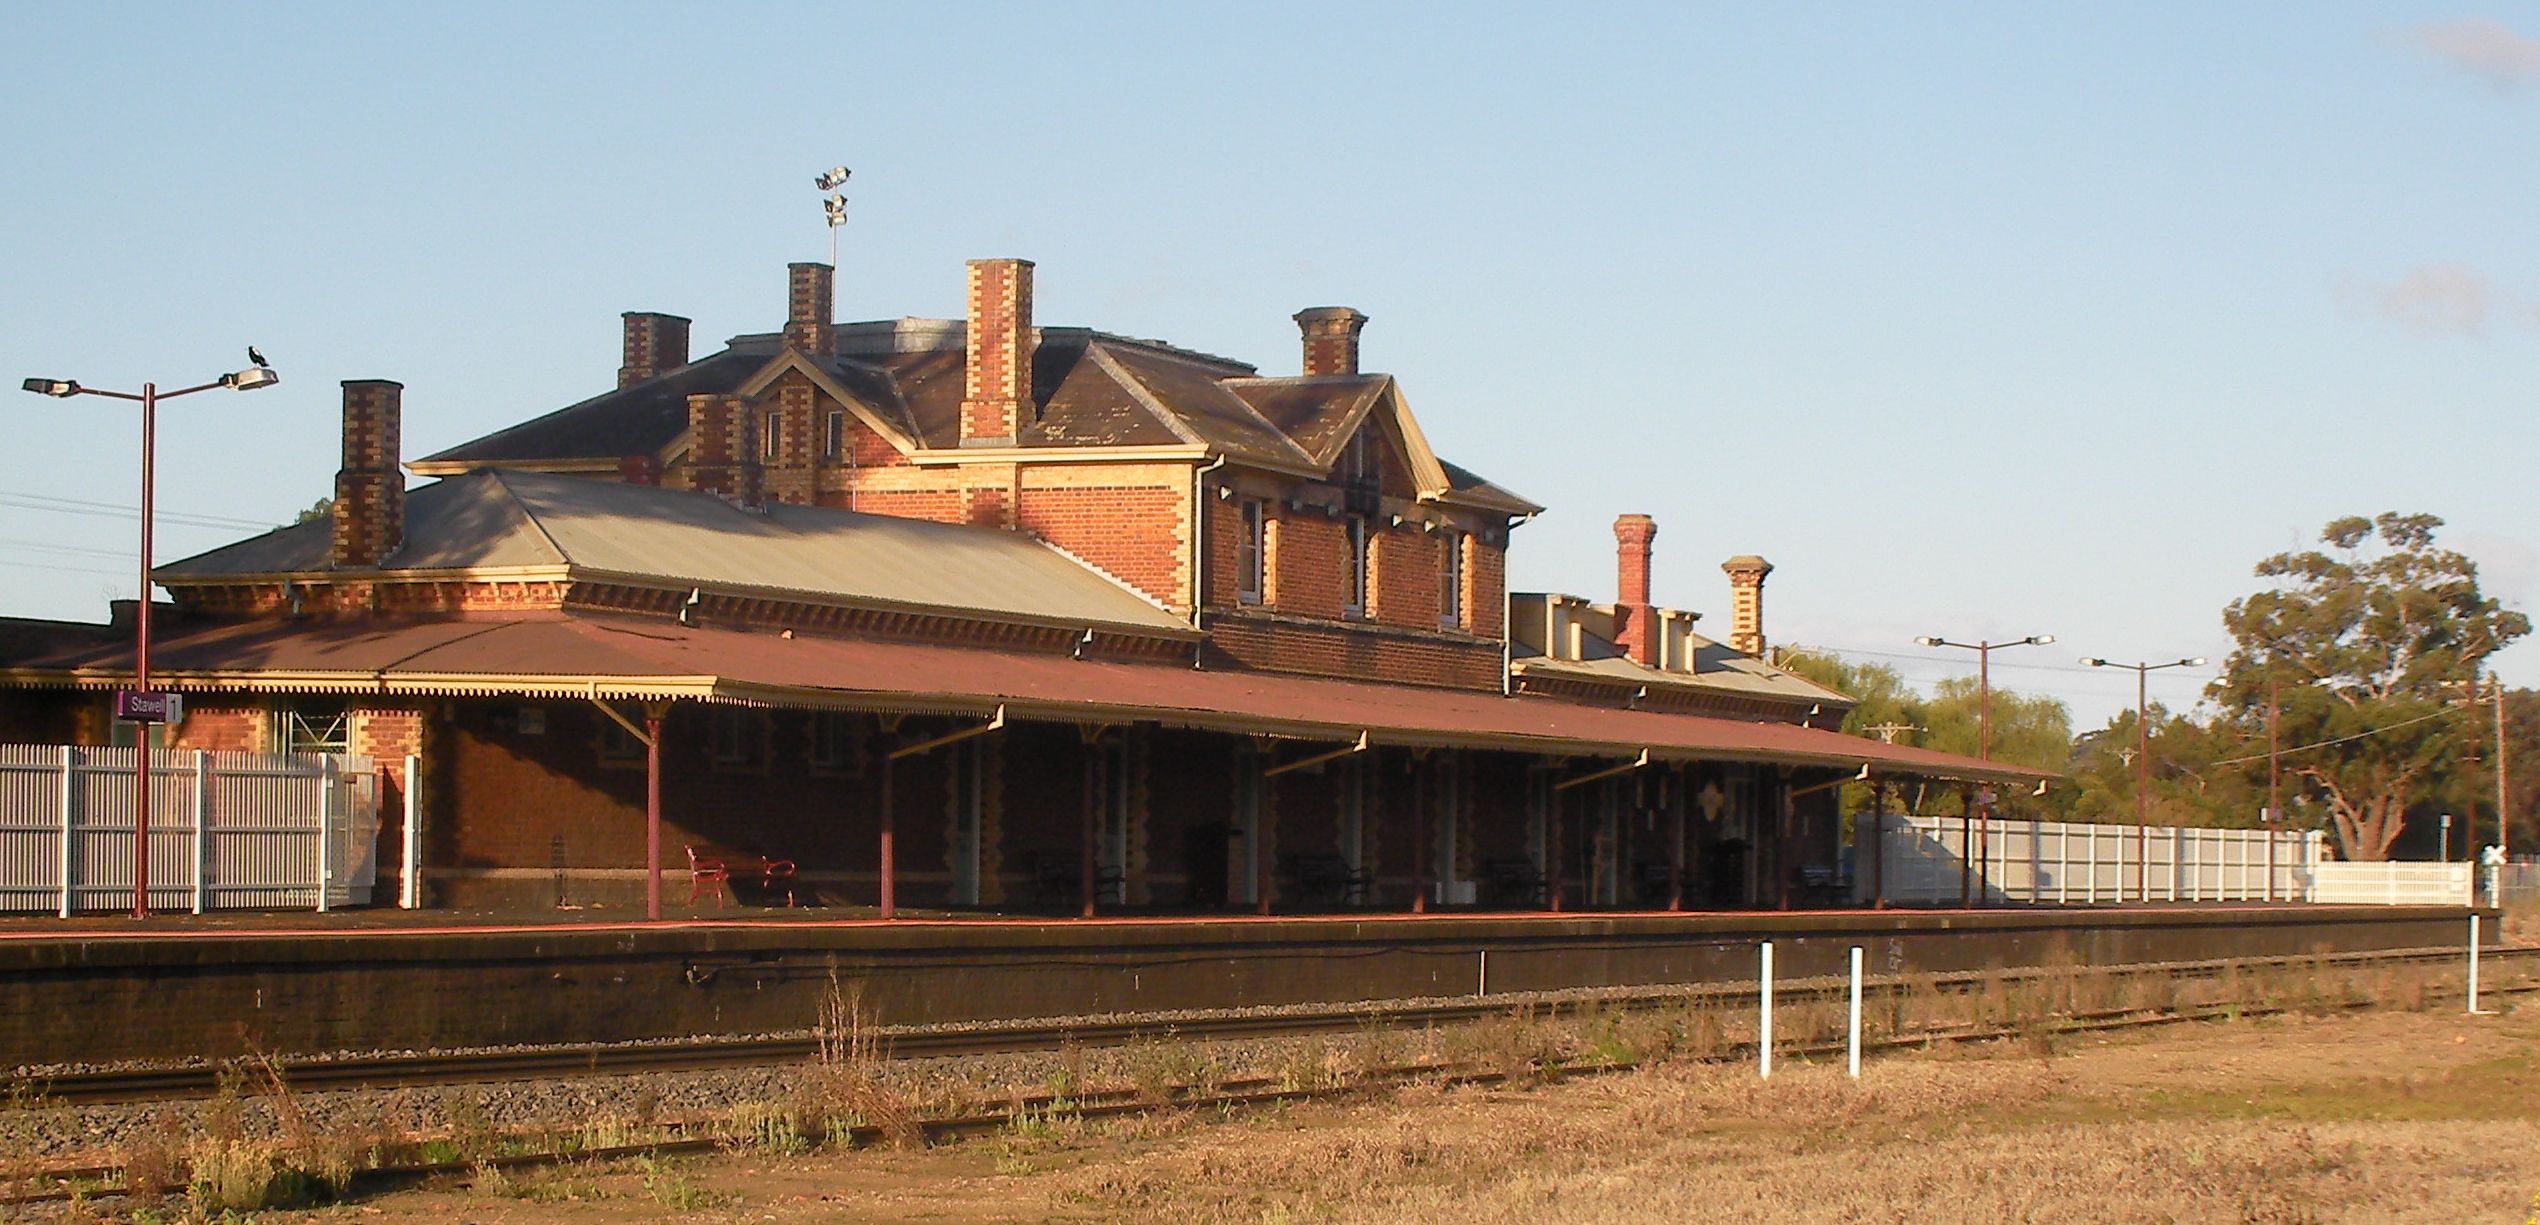
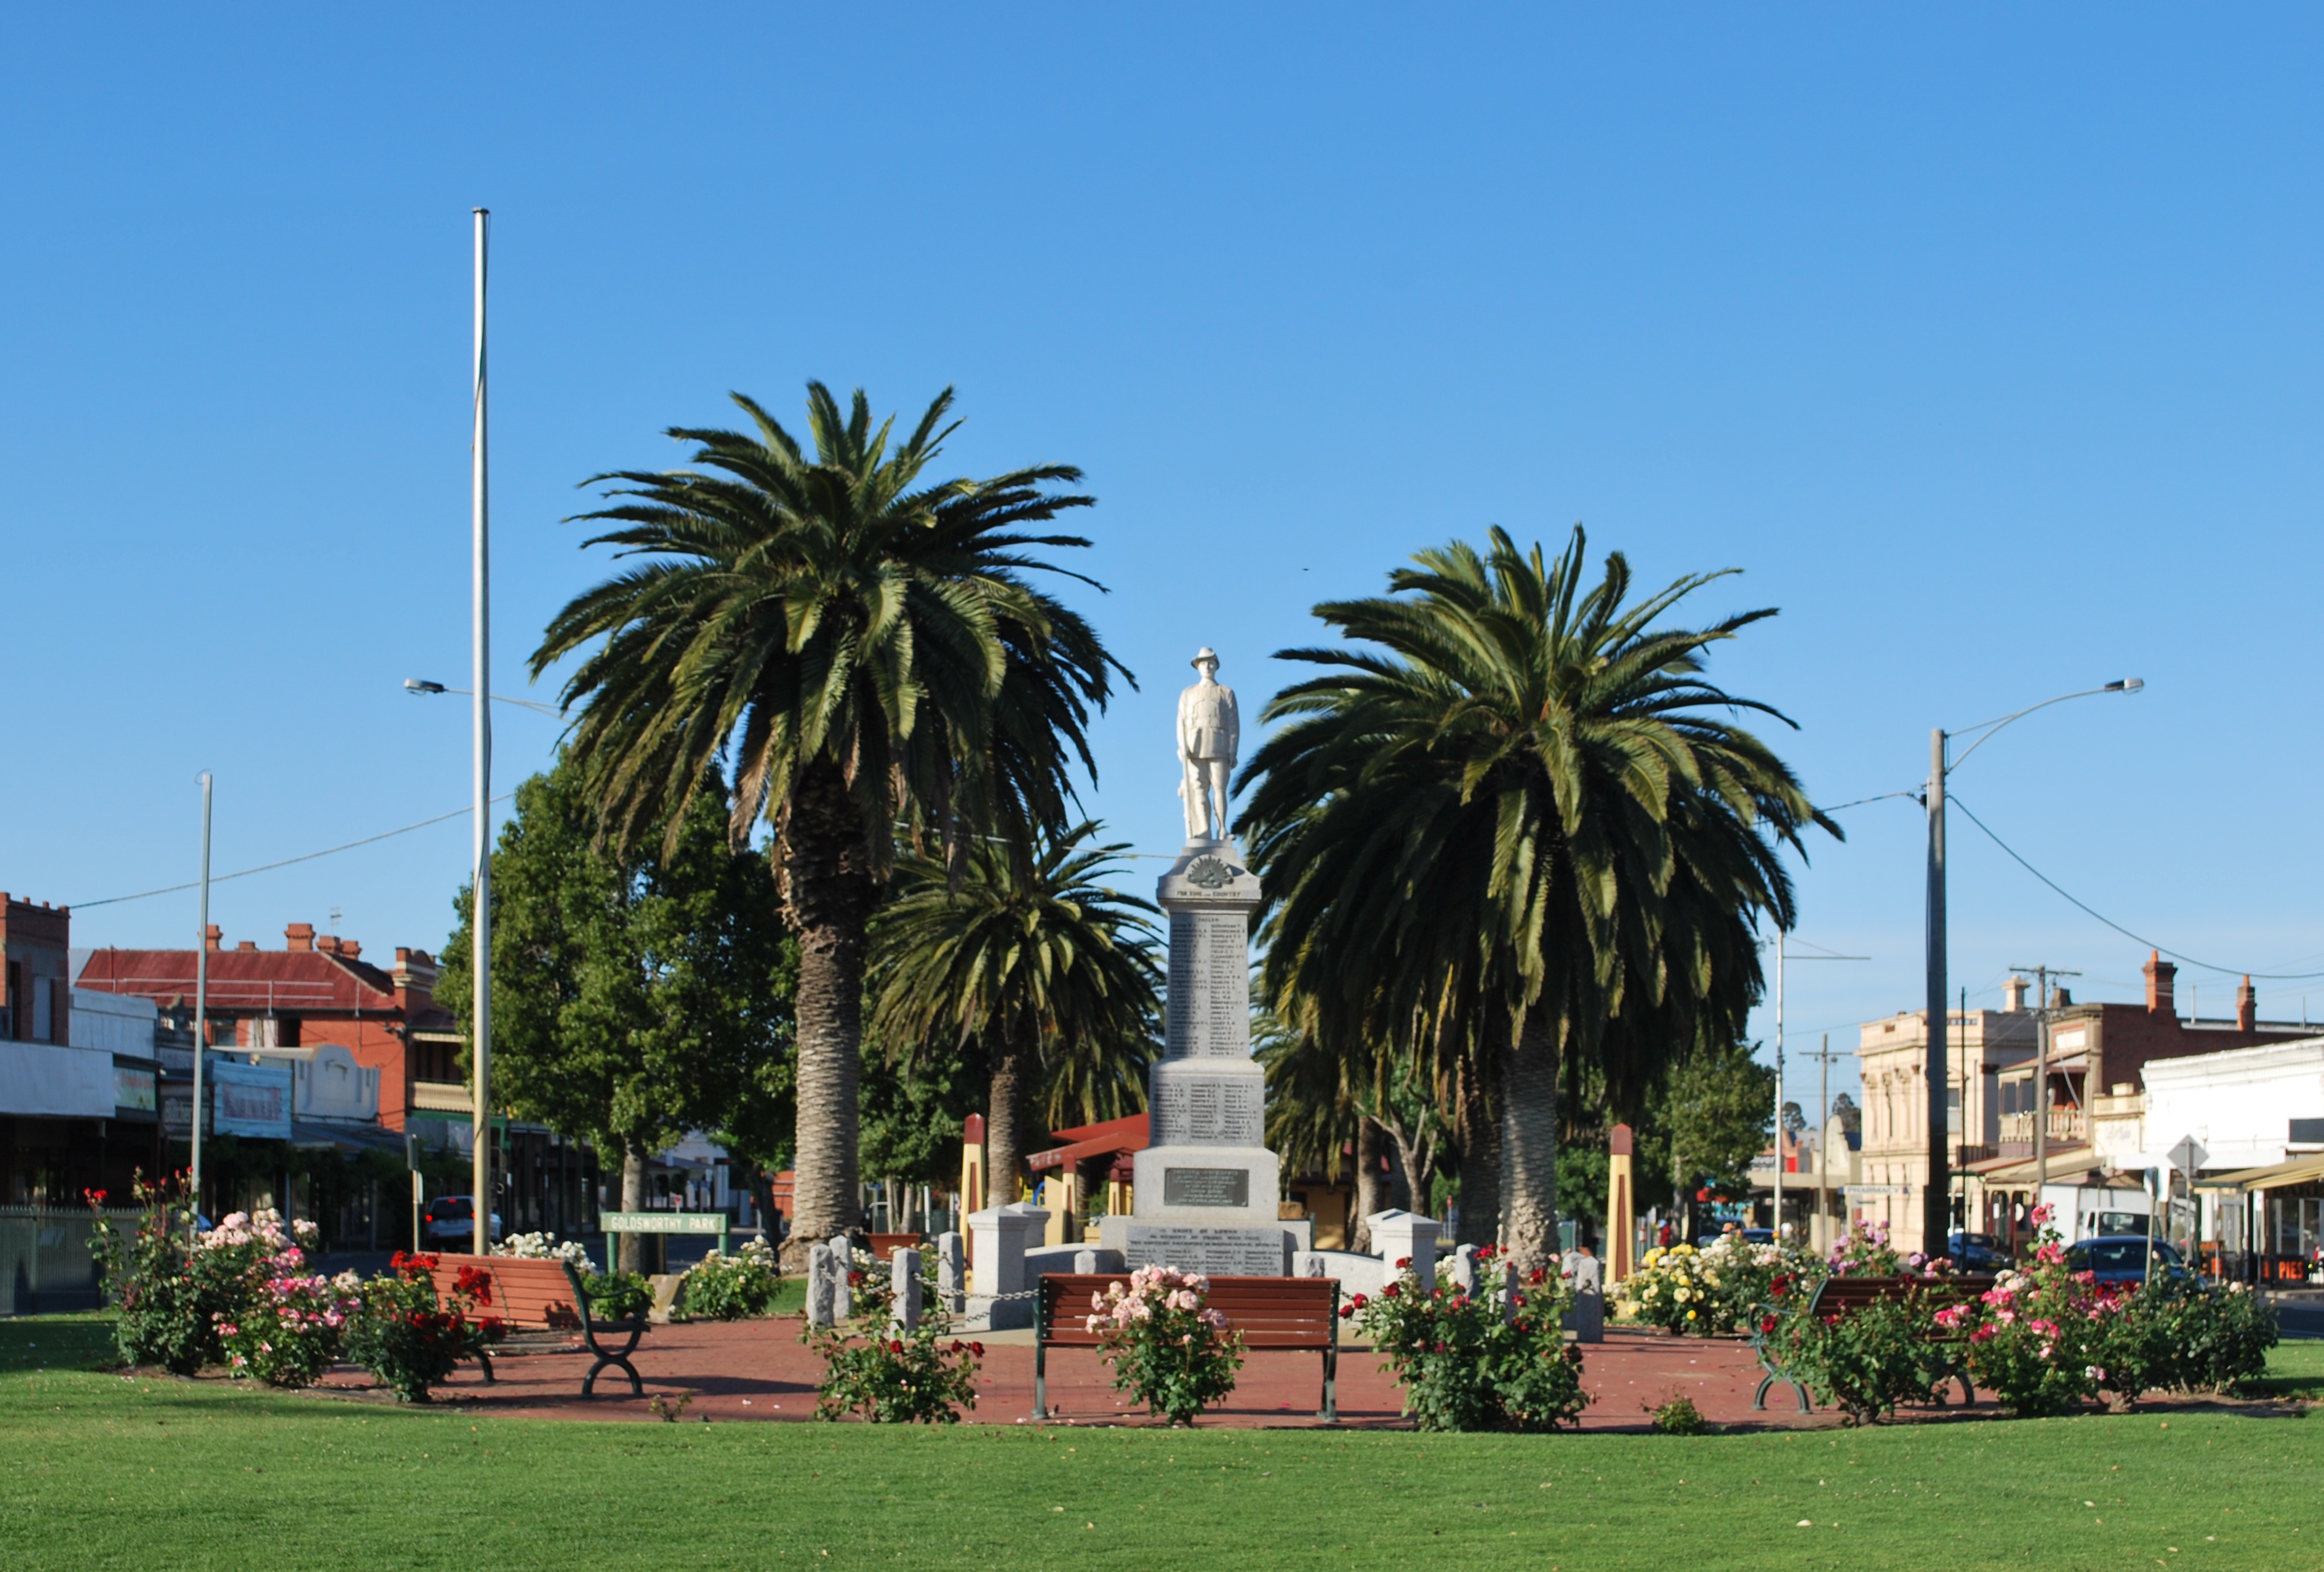
Natimuk
Natimuk is a town in Western Victoria, Australia. It is located about 300 km northwest of Melbourne. A further 10 km west of Natimuk is one of Australia's best climbing areas, Mount Arapiles. At the 2006 census, Natimuk had a population of 449.
Natimuk Wikipedia Page
About Our Data
The data on this page is estimated using a number of publicly available tools and resources. It is provided without warranty, and could contain inaccuracies. Use at your own risk.