Categories in Tabulam
Industries
Business Distribution by Industry in Tabulam
| Industry Description | Number of Establishments | Average Google Rating |
|---|---|---|
| Other accommodation | 5 | 4.7 |
Tabulam Facts
| Area | 347.0 km² |
| Population | 692 |
| Male Population | 370 (53.5%) |
| Female Population | 322 (46.5%) |
| Population change (1975 to 2020) | +93.8% |
| Population change (2000 to 2020) | +34.4% |
| Median Age | 40.7 years (Male: 45.3, Female: 36) |
| Local Time | |
| Timezone | Australian Eastern Standard Time |
| Lat & Lng | -28.89282, 152.56521 |
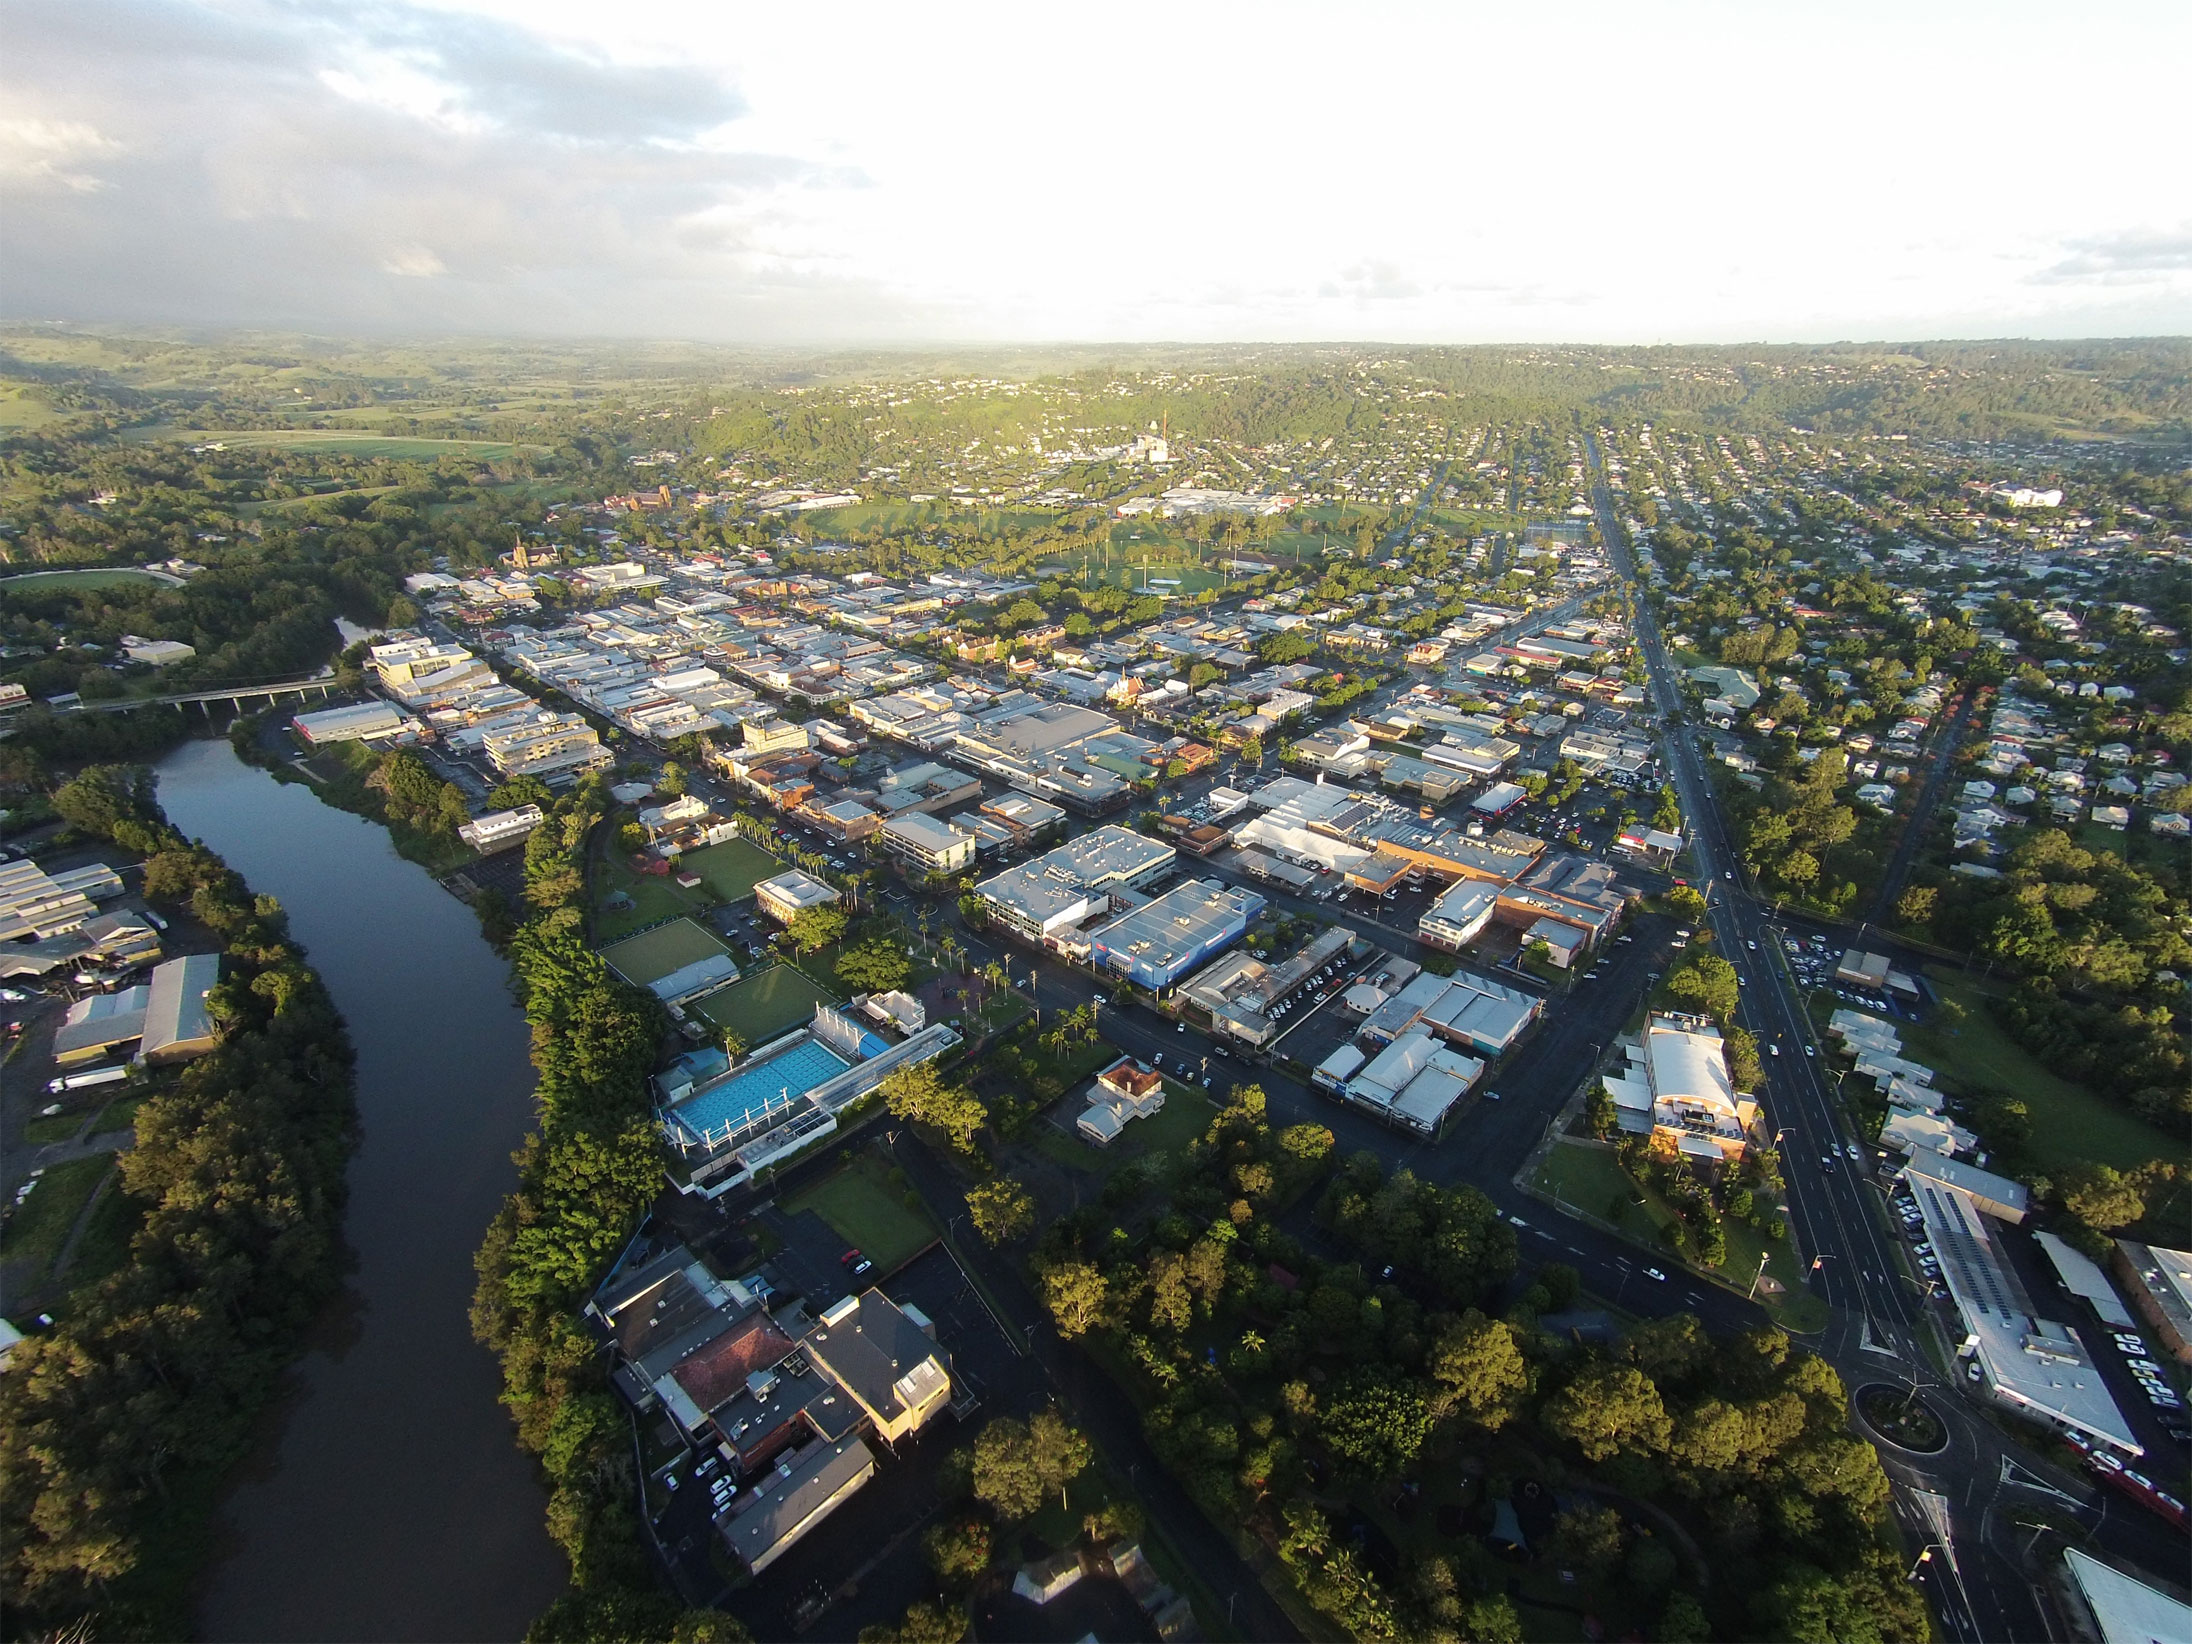
Map of Tabulam
Interactive Map
Tabulam Population
Years 1975 to 2020
| Data | 1975 | 1990 | 2000 | 2015 | 2020 |
|---|---|---|---|---|---|
| Population | 357 | 456 | 515 | 642 | 692 |
| Population Density | 1 / km² | 1.3 / km² | 1.5 / km² | 1.9 / km² | 2 / km² |
Tabulam Population change from 2000 to 2015
Increase of 24.7% from year 2000 to 2015
| Location | Change since 1975 | Change since 1990 | Change since 2000 |
|---|---|---|---|
| Tabulam | +79.8% | +40.8% | +24.7% |
| New South Wales | +72.6% | +40.2% | +25.4% |
| Australia | +72.6% | +40.3% | +25.5% |
Tabulam Median Age
Median Age: 40.7 years
| Location | Median Age | Median Age (Female) | Median Age (Male) |
|---|---|---|---|
| Tabulam | 40.7 yrs | 36 yrs | 45.3 yrs |
| New South Wales | 38.3 yrs | 39.2 yrs | 37.4 yrs |
| Australia | 37.7 yrs | 38.6 yrs | 36.8 yrs |
Tabulam Population Density
Population Density: 2 / km²
| Location | Population | Area | Density |
|---|---|---|---|
| Tabulam | 692 | 347 km² | 2 / km² |
| New South Wales | 7.7 million | 801,634.1 km² | 9.6 / km² |
| Australia | 23.8 million | 7,690,961.5 km² | 3.1 / km² |
Tabulam Historical and Projected Population
Estimated Population from 1830 to 2100
- JRC (European Commission's Joint Research Centre) work on the GHS built-up grid
- CIESIN (Center for International Earth Science Information Network)
- [Link] Klein Goldewijk, K., Beusen, A., Doelman, J., and Stehfest, E.: Anthropogenic land use estimates for the Holocene – HYDE 3.2, Earth Syst. Sci. Data, 9, 927–953, https://doi.org/10.5194/essd-9-927-2017, 2017.
Human Development Index (HDI)
Statistic composite index of life expectancy, education, and per capita income.
Tabulam CO2 Emissions
Carbon Dioxide (CO2) Emissions Per Capita in Tonnes Per Year
| Location | CO2 Emissions | CO2 Emissions Per Capita | CO2 Emissions Intensity |
|---|---|---|---|
| Tabulam | 11,084 tn | 16.02 tn | 31.9 tons/km² |
| New South Wales | 133,365,481 tn | 17.39 tn | 166.4 tons/km² |
| Australia | 401,155,564 tn | 16.88 tn | 52.2 tons/km² |
| 2013 CO2 emissions (tonnes/year) | 11,084 tn |
| 2013 CO2 emissions (tonnes/year) per capita | 16.02 tn |
| 2013 CO2 emissions intensity (tonnes/km²/year) | 31.9 tons/km² |
Natural Hazards Risk
Relative risk out of 10
| Hazard | Risk Level |
|---|---|
| Earthquake | Low (2) |
* Risk, particularly concerning flood or landslide, may not be for the entire area.
- Dilley, M., R.S. Chen, U. Deichmann, A.L. Lerner-Lam, M. Arnold, J. Agwe, P. Buys, O. Kjekstad, B. Lyon, and G. Yetman. 2005. Natural Disaster Hotspots: A Global Risk Analysis. Washington, D.C.: World Bank. https://doi.org/10.1596/0-8213-5930-4.
- Center for Hazards and Risk Research - CHRR - Columbia University, Center for International Earth Science Information Network - CIESIN - Columbia University. 2005. Global Earthquake Hazard Distribution - Peak Ground Acceleration. Palisades, NY: NASA Socioeconomic Data and Applications Center (SEDAC). https://doi.org/10.7927/H4BZ63ZS.
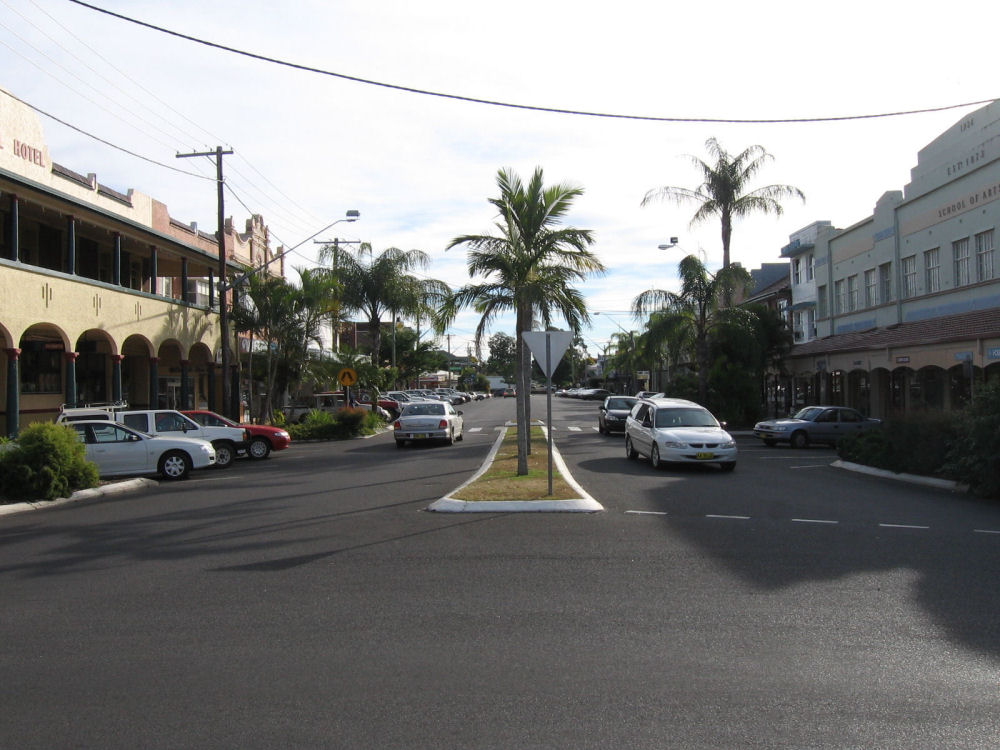
Tabulam
Tabulam is a rural village in the far north-east of New South Wales, Australia, 800 kilometres from the state capital, Sydney. Tabulam is located on the Bruxner Highway (Highway 44) between Tenterfield and Casino and on the Clarence River. Tabulam is..
Tabulam Wikipedia Page

About Our Data
The data on this page is estimated using a number of publicly available tools and resources. It is provided without warranty, and could contain inaccuracies. Use at your own risk.