Categories in Rumonge
Rumonge Facts
| Area | 878.4 km² |
| Population | 262,725 |
| Male Population | 132,544 (50.4%) |
| Female Population | 130,181 (49.6%) |
| Population change (1975 to 2020) | +1325.5% |
| Population change (2000 to 2020) | +179.2% |
| Median Age | 16.4 years (Male: 16.9, Female: 15.9) |
| GDP per capita (PPP) | $480 (2022) |
| Local Time | |
| Timezone | Central Africa Time |
| Lat & Lng | -3.97360, 29.43860 |
Map of Rumonge
Interactive Map
Rumonge Population
Years 1975 to 2030
| Data | 1975 | 1990 | 2000 | 2015 | 2020 | 2025* | 2030* |
|---|---|---|---|---|---|---|---|
| Population | 18,430 | 53,899 | 94,107 | 247,898 | 262,725 | 305,529 | 350,984 |
| Population Density | 21 / km² | 61.4 / km² | 107.1 / km² | 282.2 / km² | 299.1 / km² | 347.8 / km² | 399.6 / km² |
Rumonge Population change from 2000 to 2020
Increase of 179.2% from year 2000 to 2020
| Location | Change since 1975 | Change since 1990 | Change since 2000 |
|---|---|---|---|
| Rumonge | +1325.5% | +387.4% | +179.2% |
| Bururi Province | — | — | — |
| Burundi | — | — | — |
Rumonge Median Age
Median Age: 16.4 years
| Location | Median Age | Median Age (Female) | Median Age (Male) |
|---|---|---|---|
| Rumonge | 16.4 yrs | 15.9 yrs | 16.9 yrs |
| Bururi Province | 17.7 yrs | 18 yrs | 17.5 yrs |
| Burundi | 17.1 yrs | 16.9 yrs | 17.3 yrs |
Rumonge Population Density
Population Density: 299 / km²
| Location | Population | Area | Density |
|---|---|---|---|
| Rumonge | 262,725 | 878.4 km² | 299 / km² |
| Bururi Province | 431,656 | 1,598.5 km² | 270 / km² |
| Burundi | 11.2 million | 26,825.9 km² | 416 / km² |
Rumonge Historical and Projected Population
Estimated Population from 1910 to 2100
- JRC (European Commission's Joint Research Centre) work on the GHS built-up grid
- CIESIN (Center for International Earth Science Information Network)
- [Link] Klein Goldewijk, K., Beusen, A., Doelman, J., and Stehfest, E.: Anthropogenic land use estimates for the Holocene – HYDE 3.2, Earth Syst. Sci. Data, 9, 927–953, https://doi.org/10.5194/essd-9-927-2017, 2017.
Human Development Index (HDI)
Statistic composite index of life expectancy, education, and per capita income.
Rumonge Gross Domestic Product (GDP)
GDP per capita, PPP (constant 2017 international $)
| Data | 1990 | 1995 | 2000 | 2005 | 2010 | 2015 | 2020 | 2022 |
|---|---|---|---|---|---|---|---|---|
| GDP per capita | $944 | $743 | $698 | $640 | $613 | $529 | $470 | $480 |
| Total GDP | $48.3M | $40.9M | $51.3M | $59.2M | $83.4M | $88.7M | $94.4M | $113.2M |
Rumonge CO2 Emissions
Carbon Dioxide (CO2) Emissions Per Capita in Tonnes Per Year
| Location | CO2 Emissions | CO2 Emissions Per Capita | CO2 Emissions Intensity |
|---|---|---|---|
| Rumonge | 16,807 tn | 0.06 tn | 19.1 tons/km² |
| Bururi Province | 26,937 tn | 0.06 tn | 16.9 tons/km² |
| Burundi | 724,365 tn | 0.06 tn | 27 tons/km² |
| 2013 CO2 emissions (tonnes/year) | 16,807 tn |
| 2013 CO2 emissions (tonnes/year) per capita | 0.06 tn |
| 2013 CO2 emissions intensity (tonnes/km²/year) | 19.1 tons/km² |
Natural Hazards Risk
Relative risk out of 10
| Hazard | Risk Level |
|---|---|
| Flood | Medium (4) |
| Earthquake | Medium (4) |
* Risk, particularly concerning flood or landslide, may not be for the entire area.
- Dilley, M., R.S. Chen, U. Deichmann, A.L. Lerner-Lam, M. Arnold, J. Agwe, P. Buys, O. Kjekstad, B. Lyon, and G. Yetman. 2005. Natural Disaster Hotspots: A Global Risk Analysis. Washington, D.C.: World Bank. https://doi.org/10.1596/0-8213-5930-4.
- Center for Hazards and Risk Research - CHRR - Columbia University, Center for International Earth Science Information Network - CIESIN - Columbia University. 2005. Global Flood Hazard Frequency and Distribution. Palisades, NY: NASA Socioeconomic Data and Applications Center (SEDAC). https://doi.org/10.7927/H4668B3D.
- Center for Hazards and Risk Research - CHRR - Columbia University, Center for International Earth Science Information Network - CIESIN - Columbia University. 2005. Global Earthquake Hazard Distribution - Peak Ground Acceleration. Palisades, NY: NASA Socioeconomic Data and Applications Center (SEDAC). https://doi.org/10.7927/H4BZ63ZS.
Recent Nearby Earthquakes
Magnitude 3.0 and greater
| Date▼ | Time↕ | Magnitude↕ | Distance↕ | Depth↕ | Location↕ | Link |
|---|---|---|---|---|---|---|
| 5/21/15 | 1:19 PM | 4.4 | 72.1 km | 10,000 m | 12km S of Gitega, Burundi | usgs.gov |
| 7/12/14 | 10:02 PM | 4.3 | 22.9 km | 11,530 m | 22km NW of Rumonge, Burundi | usgs.gov |
| 9/18/13 | 1:12 AM | 4 | 58.7 km | 15,650 m | 44km NW of Mwandiga, Tanzania | usgs.gov |
| 3/10/13 | 3:00 AM | 4.5 | 54.2 km | 10,000 m | 54km SW of Rumonge, Burundi | usgs.gov |
| 5/12/12 | 8:26 AM | 4.4 | 67.1 km | 10,000 m | Lake Tanganyika region, Democratic Republic of the Congo | usgs.gov |
| 4/3/11 | 4:37 AM | 4.7 | 41.6 km | 10,000 m | Burundi | usgs.gov |
| 9/25/10 | 6:15 AM | 3.8 | 70.7 km | 10,000 m | Burundi | usgs.gov |
| 11/3/08 | 9:48 PM | 3.9 | 77.2 km | 10,000 m | Lake Tanganyika region | usgs.gov |
| 6/19/08 | 7:25 AM | 4.7 | 71.4 km | 10,000 m | Lake Tanganyika region | usgs.gov |
| 7/3/06 | 6:05 PM | 4.4 | 89 km | 10,000 m | Burundi region | usgs.gov |
Rumonge
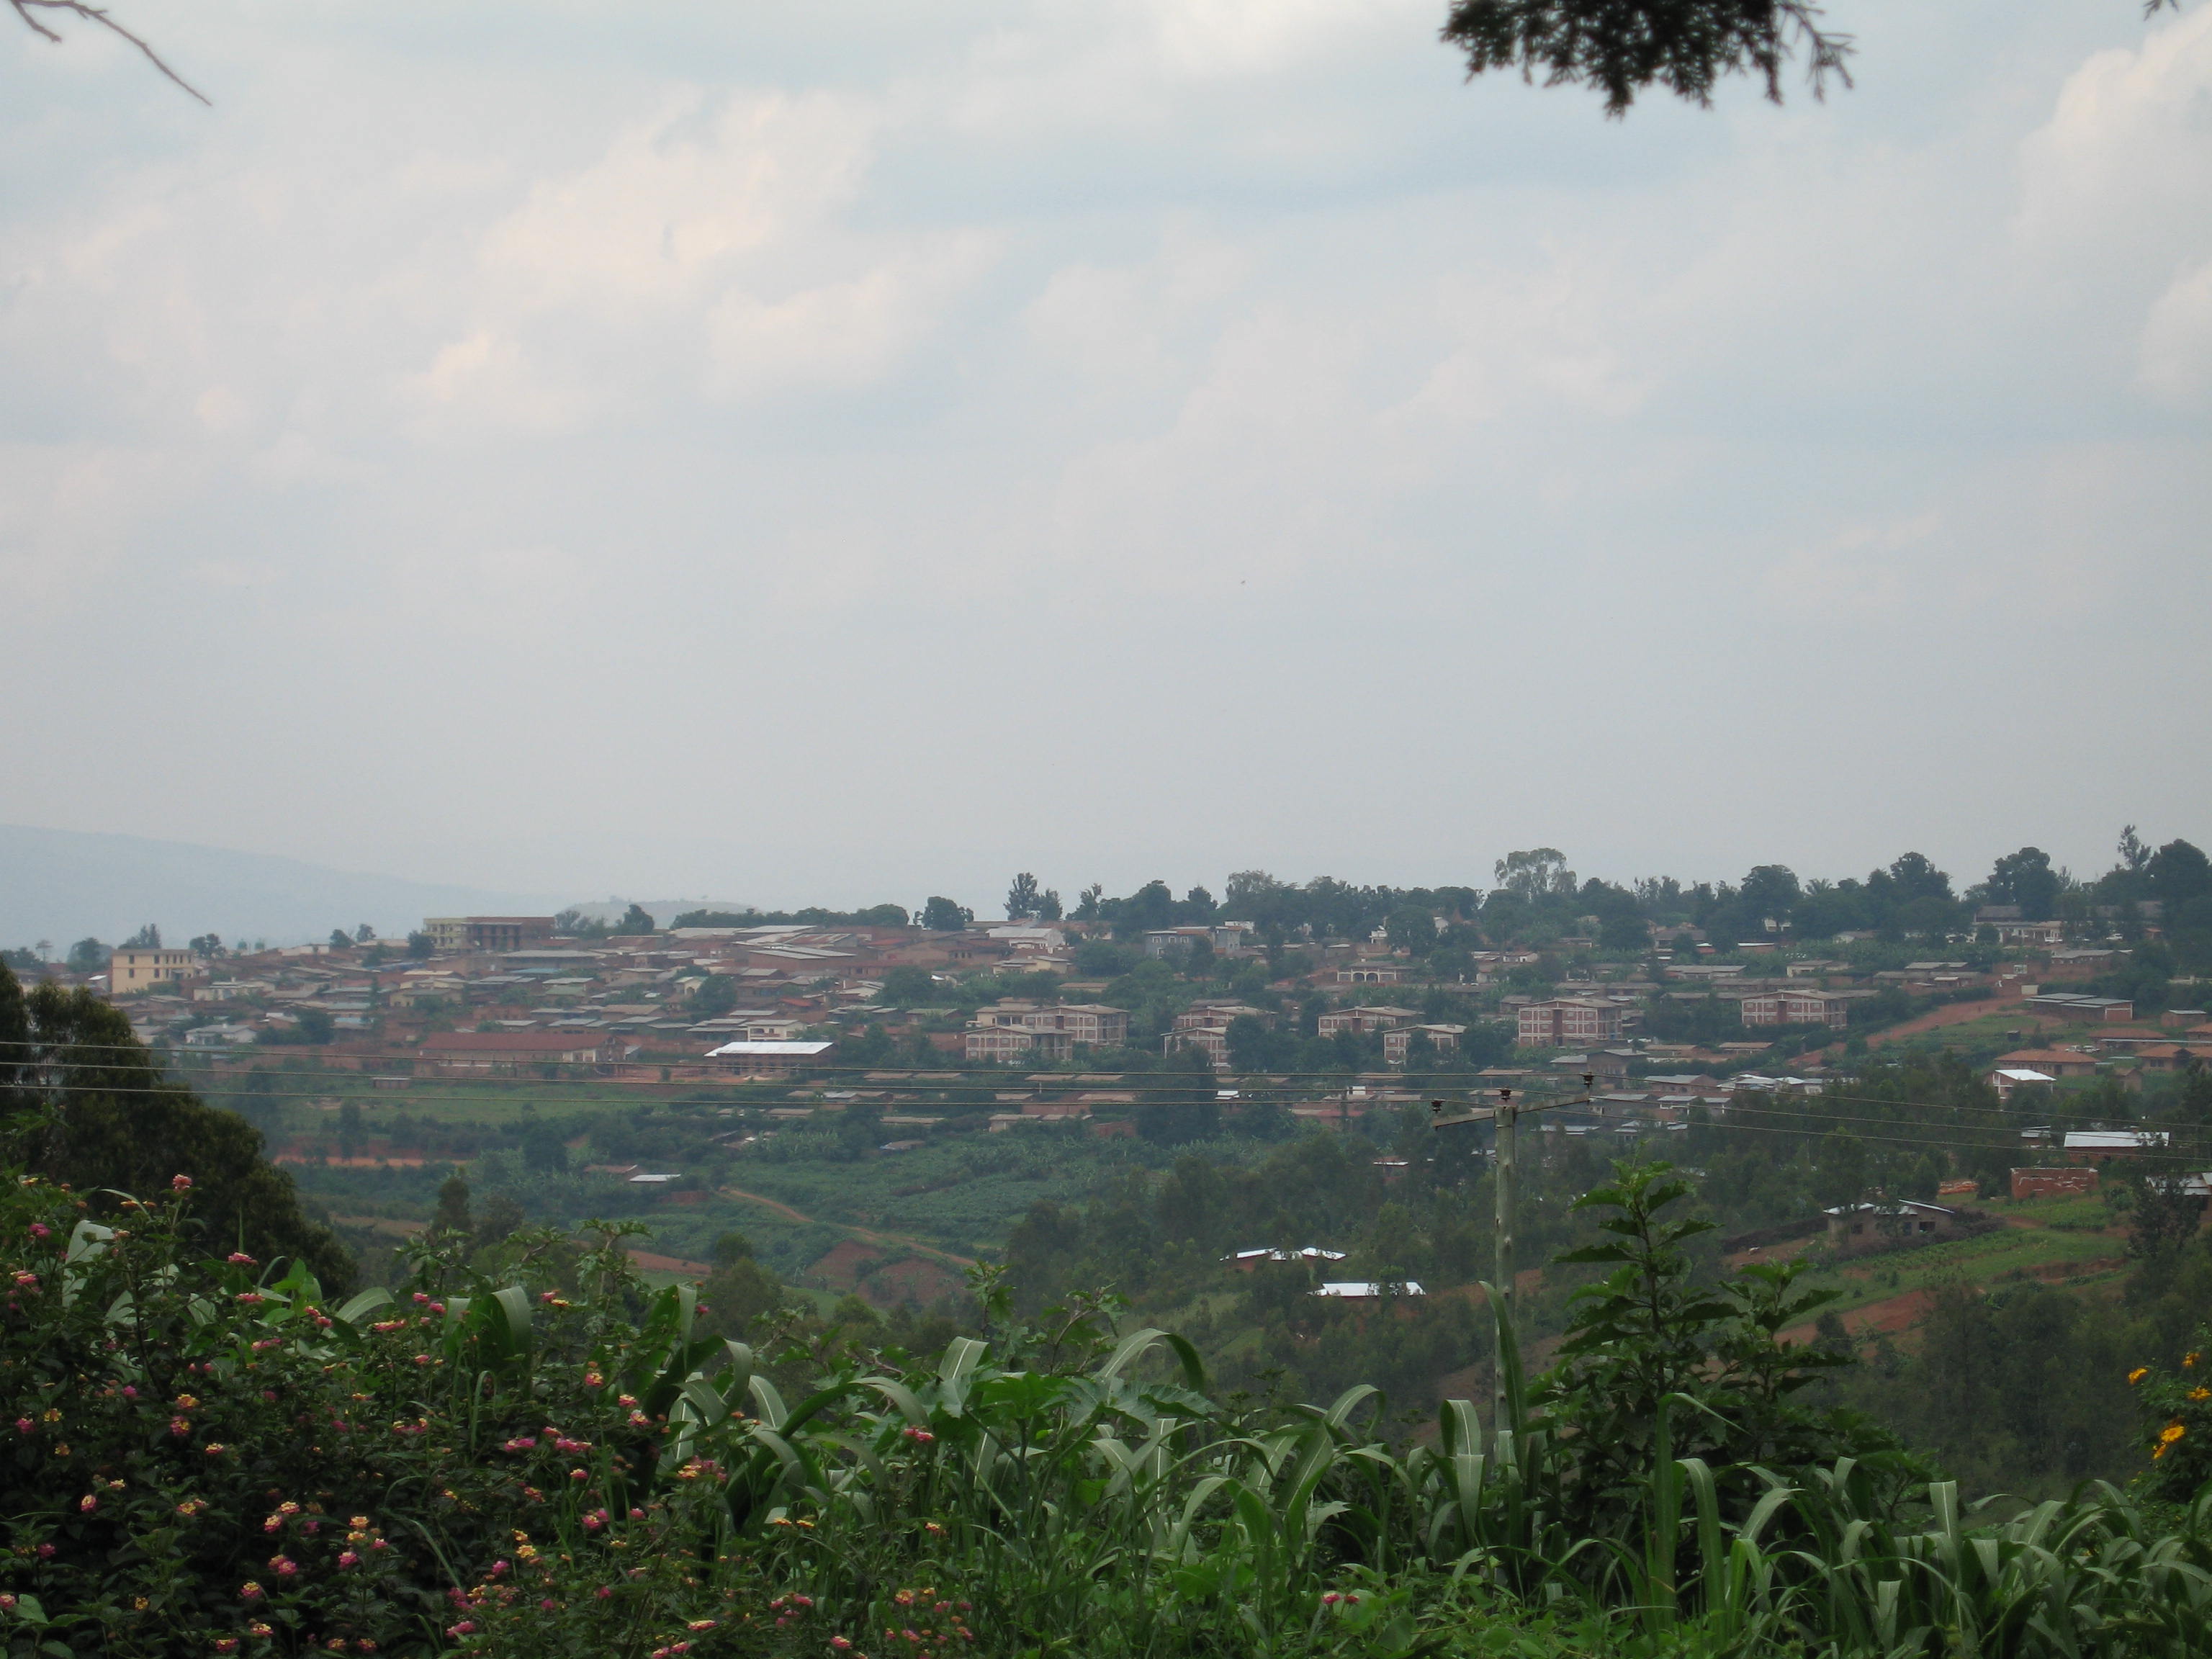
Rumonge is the capital of Rumonge Province, Burundi, and is located on the shores of Lake Tanganyika. The 2008 census recorded a population of 35,931 in Rumonge, making it Burundi's fourth largest city. It had a big Arab (Sharji/Azri) presence before..
Rumonge Wikipedia Page

About Our Data
The data on this page is estimated using a number of publicly available tools and resources. It is provided without warranty, and could contain inaccuracies. Use at your own risk.