Categories in Uyuni
Industries
Business Distribution by Industry in Uyuni
| Industry Description | Number of Establishments | Average Google Rating |
|---|---|---|
| Hotels and motels | 26 | 3.9 |
| Other accommodation | 18 | 3.7 |
| Travel agencies | 14 | 4 |
| Restaurants | 11 | 3.8 |
| Hostels | 7 | 3.3 |
Uyuni Facts
| Area | 9298.9 km² |
| Population | 39,119 |
| Male Population | 19,128 (48.9%) |
| Female Population | 19,991 (51.1%) |
| Population change (1975 to 2020) | +632.4% |
| Population change (2000 to 2020) | +110.2% |
| Median Age | 23.5 years (Male: 22.4, Female: 24.6) |
| Area Codes | 2 |
| Local Time | |
| Timezone | Bolivia Time |
| Lat & Lng | -20.45967, -66.82503 |
Map of Uyuni
Interactive Map
Uyuni Population
Years 1975 to 2020
| Data | 1975 | 1990 | 2000 | 2015 | 2020 |
|---|---|---|---|---|---|
| Population | 5,341 | 11,646 | 18,610 | 36,320 | 39,119 |
| Population Density | 0.6 / km² | 1.3 / km² | 2 / km² | 3.9 / km² | 4.2 / km² |
Uyuni Population change from 2000 to 2015
Increase of 95.2% from year 2000 to 2015
| Location | Change since 1975 | Change since 1990 | Change since 2000 |
|---|---|---|---|
| Uyuni | +580% | +211.9% | +95.2% |
| Potosí Department | +93.5% | +44.8% | +21.8% |
| Bolivia | +113.9% | +56.1% | +28.5% |
Uyuni Median Age
Median Age: 23.5 years
| Location | Median Age | Median Age (Female) | Median Age (Male) |
|---|---|---|---|
| Uyuni | 23.5 yrs | 24.6 yrs | 22.4 yrs |
| Potosí Department | 23.1 yrs | 24 yrs | 22.3 yrs |
| Bolivia | 23.9 yrs | 24.4 yrs | 23.5 yrs |
Uyuni Population Density
Population Density: 4.2 / km²
| Location | Population | Area | Density |
|---|---|---|---|
| Uyuni | 39,119 | 9,298.9 km² | 4.2 / km² |
| Potosí Department | 869,574 | 119,569.3 km² | 7.3 / km² |
| Bolivia | 10.8 million | 1,083,759.7 km² | 9.9 / km² |
Uyuni Historical and Projected Population
Estimated Population from 0 to 2100
- JRC (European Commission's Joint Research Centre) work on the GHS built-up grid
- CIESIN (Center for International Earth Science Information Network)
- [Link] Klein Goldewijk, K., Beusen, A., Doelman, J., and Stehfest, E.: Anthropogenic land use estimates for the Holocene – HYDE 3.2, Earth Syst. Sci. Data, 9, 927–953, https://doi.org/10.5194/essd-9-927-2017, 2017.
Area Codes
Percentage Area Codes used by businesses in Uyuni
Price Distribution
Business distribution by price for Uyuni
Human Development Index (HDI)
Statistic composite index of life expectancy, education, and per capita income.
Uyuni CO2 Emissions
Carbon Dioxide (CO2) Emissions Per Capita in Tonnes Per Year
| Location | CO2 Emissions | CO2 Emissions Per Capita | CO2 Emissions Intensity |
|---|---|---|---|
| Uyuni | 53,082 tn | 1.36 tn | 5.7 tons/km² |
| Potosí Department | 1,187,246 tn | 1.37 tn | 9.9 tons/km² |
| Bolivia | 16,583,283 tn | 1.54 tn | 15.3 tons/km² |
| 2013 CO2 emissions (tonnes/year) | 53,082 tn |
| 2013 CO2 emissions (tonnes/year) per capita | 1.36 tn |
| 2013 CO2 emissions intensity (tonnes/km²/year) | 5.7 tons/km² |
Natural Hazards Risk
Relative risk out of 10
| Hazard | Risk Level |
|---|---|
| Drought | Medium (7) |
| Earthquake | Medium (6) |
* Risk, particularly concerning flood or landslide, may not be for the entire area.
- Dilley, M., R.S. Chen, U. Deichmann, A.L. Lerner-Lam, M. Arnold, J. Agwe, P. Buys, O. Kjekstad, B. Lyon, and G. Yetman. 2005. Natural Disaster Hotspots: A Global Risk Analysis. Washington, D.C.: World Bank. https://doi.org/10.1596/0-8213-5930-4.
- Center for Hazards and Risk Research - CHRR - Columbia University, Center for International Earth Science Information Network - CIESIN - Columbia University, and International Research Institute for Climate and Society - IRI - Columbia University. 2005. Global Drought Hazard Frequency and Distribution. Palisades, NY: NASA Socioeconomic Data and Applications Center (SEDAC). https://doi.org/10.7927/H4VX0DFT.
- Center for Hazards and Risk Research - CHRR - Columbia University, Center for International Earth Science Information Network - CIESIN - Columbia University. 2005. Global Earthquake Hazard Distribution - Peak Ground Acceleration. Palisades, NY: NASA Socioeconomic Data and Applications Center (SEDAC). https://doi.org/10.7927/H4BZ63ZS.
Recent Nearby Earthquakes
Magnitude 3.0 and greater
| Date▼ | Time↕ | Magnitude↕ | Distance↕ | Depth↕ | Location↕ | Link |
|---|---|---|---|---|---|---|
| 7/19/19 | 1:18 AM | 4.9 | 59 km | 180,930 m | 58km SW of Uyuni, Bolivia | usgs.gov |
| 7/17/19 | 7:51 AM | 4.2 | 14.7 km | 256,350 m | 14km SSW of Colchani, Bolivia | usgs.gov |
| 5/7/19 | 1:04 PM | 4.4 | 33.3 km | 239,170 m | 33km NE of Uyuni, Bolivia | usgs.gov |
| 3/16/19 | 1:31 AM | 4.4 | 30.9 km | 230,350 m | 30km SSE of Uyuni, Bolivia | usgs.gov |
| 12/26/18 | 1:01 AM | 4.2 | 60 km | 217,150 m | 59km SSW of Uyuni, Bolivia | usgs.gov |
| 10/30/18 | 5:00 PM | 4.1 | 60.8 km | 240,210 m | 60km SSW of Uyuni, Bolivia | usgs.gov |
| 10/27/18 | 12:13 PM | 4.8 | 26.1 km | 245,070 m | 26km SE of Uyuni, Bolivia | usgs.gov |
| 5/5/18 | 12:53 PM | 4 | 20.8 km | 310,490 m | 20km E of Uyuni, Bolivia | usgs.gov |
| 3/23/18 | 12:39 AM | 4.6 | 11.7 km | 258,649 m | 9km SSE of Colchani, Bolivia | usgs.gov |
| 3/14/18 | 5:49 AM | 4.3 | 47 km | 202,440 m | 30km W of Colchani, Bolivia | usgs.gov |
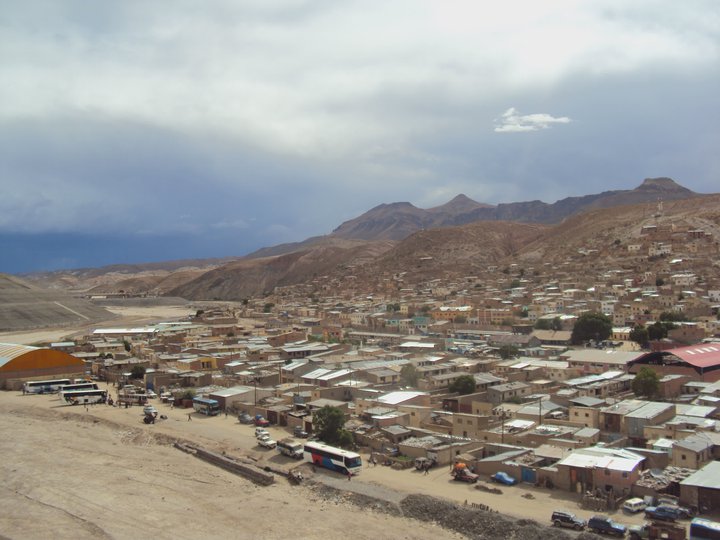
Uyuni
Uyuni (Aymara, uyu pen (enclosure), yard, cemetery, -ni a suffix to indicate ownership, "the one that has got a pen", "the one with a pen") is a city in the southwest of Bolivia. There is little agriculture in the area because water supplies are scar..
Uyuni Wikipedia Page


About Our Data
The data on this page is estimated using a number of publicly available tools and resources. It is provided without warranty, and could contain inaccuracies. Use at your own risk.