Categories in Avanhandava
Industries
Business Distribution by Industry in Avanhandava
| Industry Description | Number of Establishments | Average Age of Business |
|---|---|---|
| Shopping | 64 | 30 years |
| Restaurants | 46 | — |
| Grocery stores and supermarkets | 27 | — |
| Freight/commercial transport | 19 | — |
| Clothing stores | 19 | — |
| Public administration | 18 | — |
| Churches | 16 | — |
| All membership organizations | 15 | — |
| Gas station | 14 | — |
| Pharmacies and drug stores | 14 | — |
| Education | 14 | — |
| All food and beverage | 12 | — |
| Bakeries | 12 | — |
| Religion | 11 | — |
| Other membership organizations | 11 | — |
| Shopping other | 10 | — |
| Car parts | 10 | — |
| Telecommunications | 10 | — |
| Furniture stores | 10 | — |
| Bars, pubs and taverns | 9 | — |
| Buses and trains | 9 | — |
| Construction of buildings | 9 | — |
Avanhandava Facts
| Area | 3.5 km² |
| Population | 11,438 |
| Male Population | 5,623 (49.2%) |
| Female Population | 5,815 (50.8%) |
| Population change (1975 to 2020) | +256.0% |
| Population change (2000 to 2020) | +48.0% |
| Median Age | 31.6 years (Male: 30.2, Female: 33.3) |
| Neighborhoods | Centro, Zona Rural, 648, Vila Industrial, Parque Alto da Boa Vista |
| Local Time | |
| Timezone | Brasilia Standard Time |
| Lat & Lng | -21.46083, -49.94972 |
| Postal Codes | 16360 |
Map of Avanhandava
Interactive Map
Avanhandava Population
Years 1975 to 2020
| Data | 1975 | 1990 | 2000 | 2015 | 2020 |
|---|---|---|---|---|---|
| Population | 3,213 | 5,724 | 7,726 | 11,074 | 11,438 |
| Population Density | 918 / km² | 1,635.4 / km² | 2,207.4 / km² | 3,164 / km² | 3,268 / km² |
Avanhandava Population change from 2000 to 2015
Increase of 43.3% from year 2000 to 2015
| Location | Change since 1975 | Change since 1990 | Change since 2000 |
|---|---|---|---|
| Avanhandava | +244.7% | +93.5% | +43.3% |
| São Paulo (state) | +90.7% | +35.9% | +16.4% |
| Brazil | +91.5% | +38.1% | +18.2% |
Avanhandava Median Age
Median Age: 31.6 years
| Location | Median Age | Median Age (Female) | Median Age (Male) |
|---|---|---|---|
| Avanhandava | 31.6 yrs | 33.3 yrs | 30.2 yrs |
| São Paulo (state) | 31.5 yrs | 32.4 yrs | 30.4 yrs |
| Brazil | 29.5 yrs | 30.3 yrs | 28.7 yrs |
Avanhandava Population Density
Population Density: 3,268 / km²
| Location | Population | Area | Density |
|---|---|---|---|
| Avanhandava | 11,438 | 3.5 km² | 3,268 / km² |
| São Paulo (state) | 44.6 million | 248,223.6 km² | 180 / km² |
| Brazil | 206.1 million | 8,479,487.1 km² | 24.3 / km² |
Avanhandava Historical and Projected Population
Estimated Population from 1890 to 2100
- JRC (European Commission's Joint Research Centre) work on the GHS built-up grid
- CIESIN (Center for International Earth Science Information Network)
- [Link] Klein Goldewijk, K., Beusen, A., Doelman, J., and Stehfest, E.: Anthropogenic land use estimates for the Holocene – HYDE 3.2, Earth Syst. Sci. Data, 9, 927–953, https://doi.org/10.5194/essd-9-927-2017, 2017.
Neighborhoods in Avanhandava
Percentage of businesses by neighborhood in Avanhandava
Price Distribution
Business distribution by price for Avanhandava
Human Development Index (HDI)
Statistic composite index of life expectancy, education, and per capita income.
Avanhandava CO2 Emissions
Carbon Dioxide (CO2) Emissions Per Capita in Tonnes Per Year
| Location | CO2 Emissions | CO2 Emissions Per Capita | CO2 Emissions Intensity |
|---|---|---|---|
| Avanhandava | 33,421 tn | 2.92 tn | 9,548.8 tons/km² |
| São Paulo (state) | 156,280,136 tn | 3.51 tn | 629.6 tons/km² |
| Brazil | 561,829,904 tn | 2.73 tn | 66.3 tons/km² |
| 2013 CO2 emissions (tonnes/year) | 33,421 tn |
| 2013 CO2 emissions (tonnes/year) per capita | 2.92 tn |
| 2013 CO2 emissions intensity (tonnes/km²/year) | 9,548.8 tons/km² |
Natural Hazards Risk
Relative risk out of 10
| Hazard | Risk Level |
|---|---|
| Flood | Medium (7) |
* Risk, particularly concerning flood or landslide, may not be for the entire area.
- Dilley, M., R.S. Chen, U. Deichmann, A.L. Lerner-Lam, M. Arnold, J. Agwe, P. Buys, O. Kjekstad, B. Lyon, and G. Yetman. 2005. Natural Disaster Hotspots: A Global Risk Analysis. Washington, D.C.: World Bank. https://doi.org/10.1596/0-8213-5930-4.
- Center for Hazards and Risk Research - CHRR - Columbia University, Center for International Earth Science Information Network - CIESIN - Columbia University. 2005. Global Flood Hazard Frequency and Distribution. Palisades, NY: NASA Socioeconomic Data and Applications Center (SEDAC). https://doi.org/10.7927/H4668B3D.
Recent Nearby Earthquakes
Magnitude 3.0 and greater
| Date▼ | Time↕ | Magnitude↕ | Distance↕ | Depth↕ | Location↕ | Link |
|---|---|---|---|---|---|---|
| 7/26/18 | 4:04 AM | 3.5 | 24.4 km | 10,000 m | 16km SW of Penapolis, Brazil | usgs.gov |
Avanhandava
Avanhandava is a municipality in the state of São Paulo in Brazil. The population is 12,719 (2015 est.) in an area of 338 km². The elevation is 428 m.
Avanhandava Wikipedia Page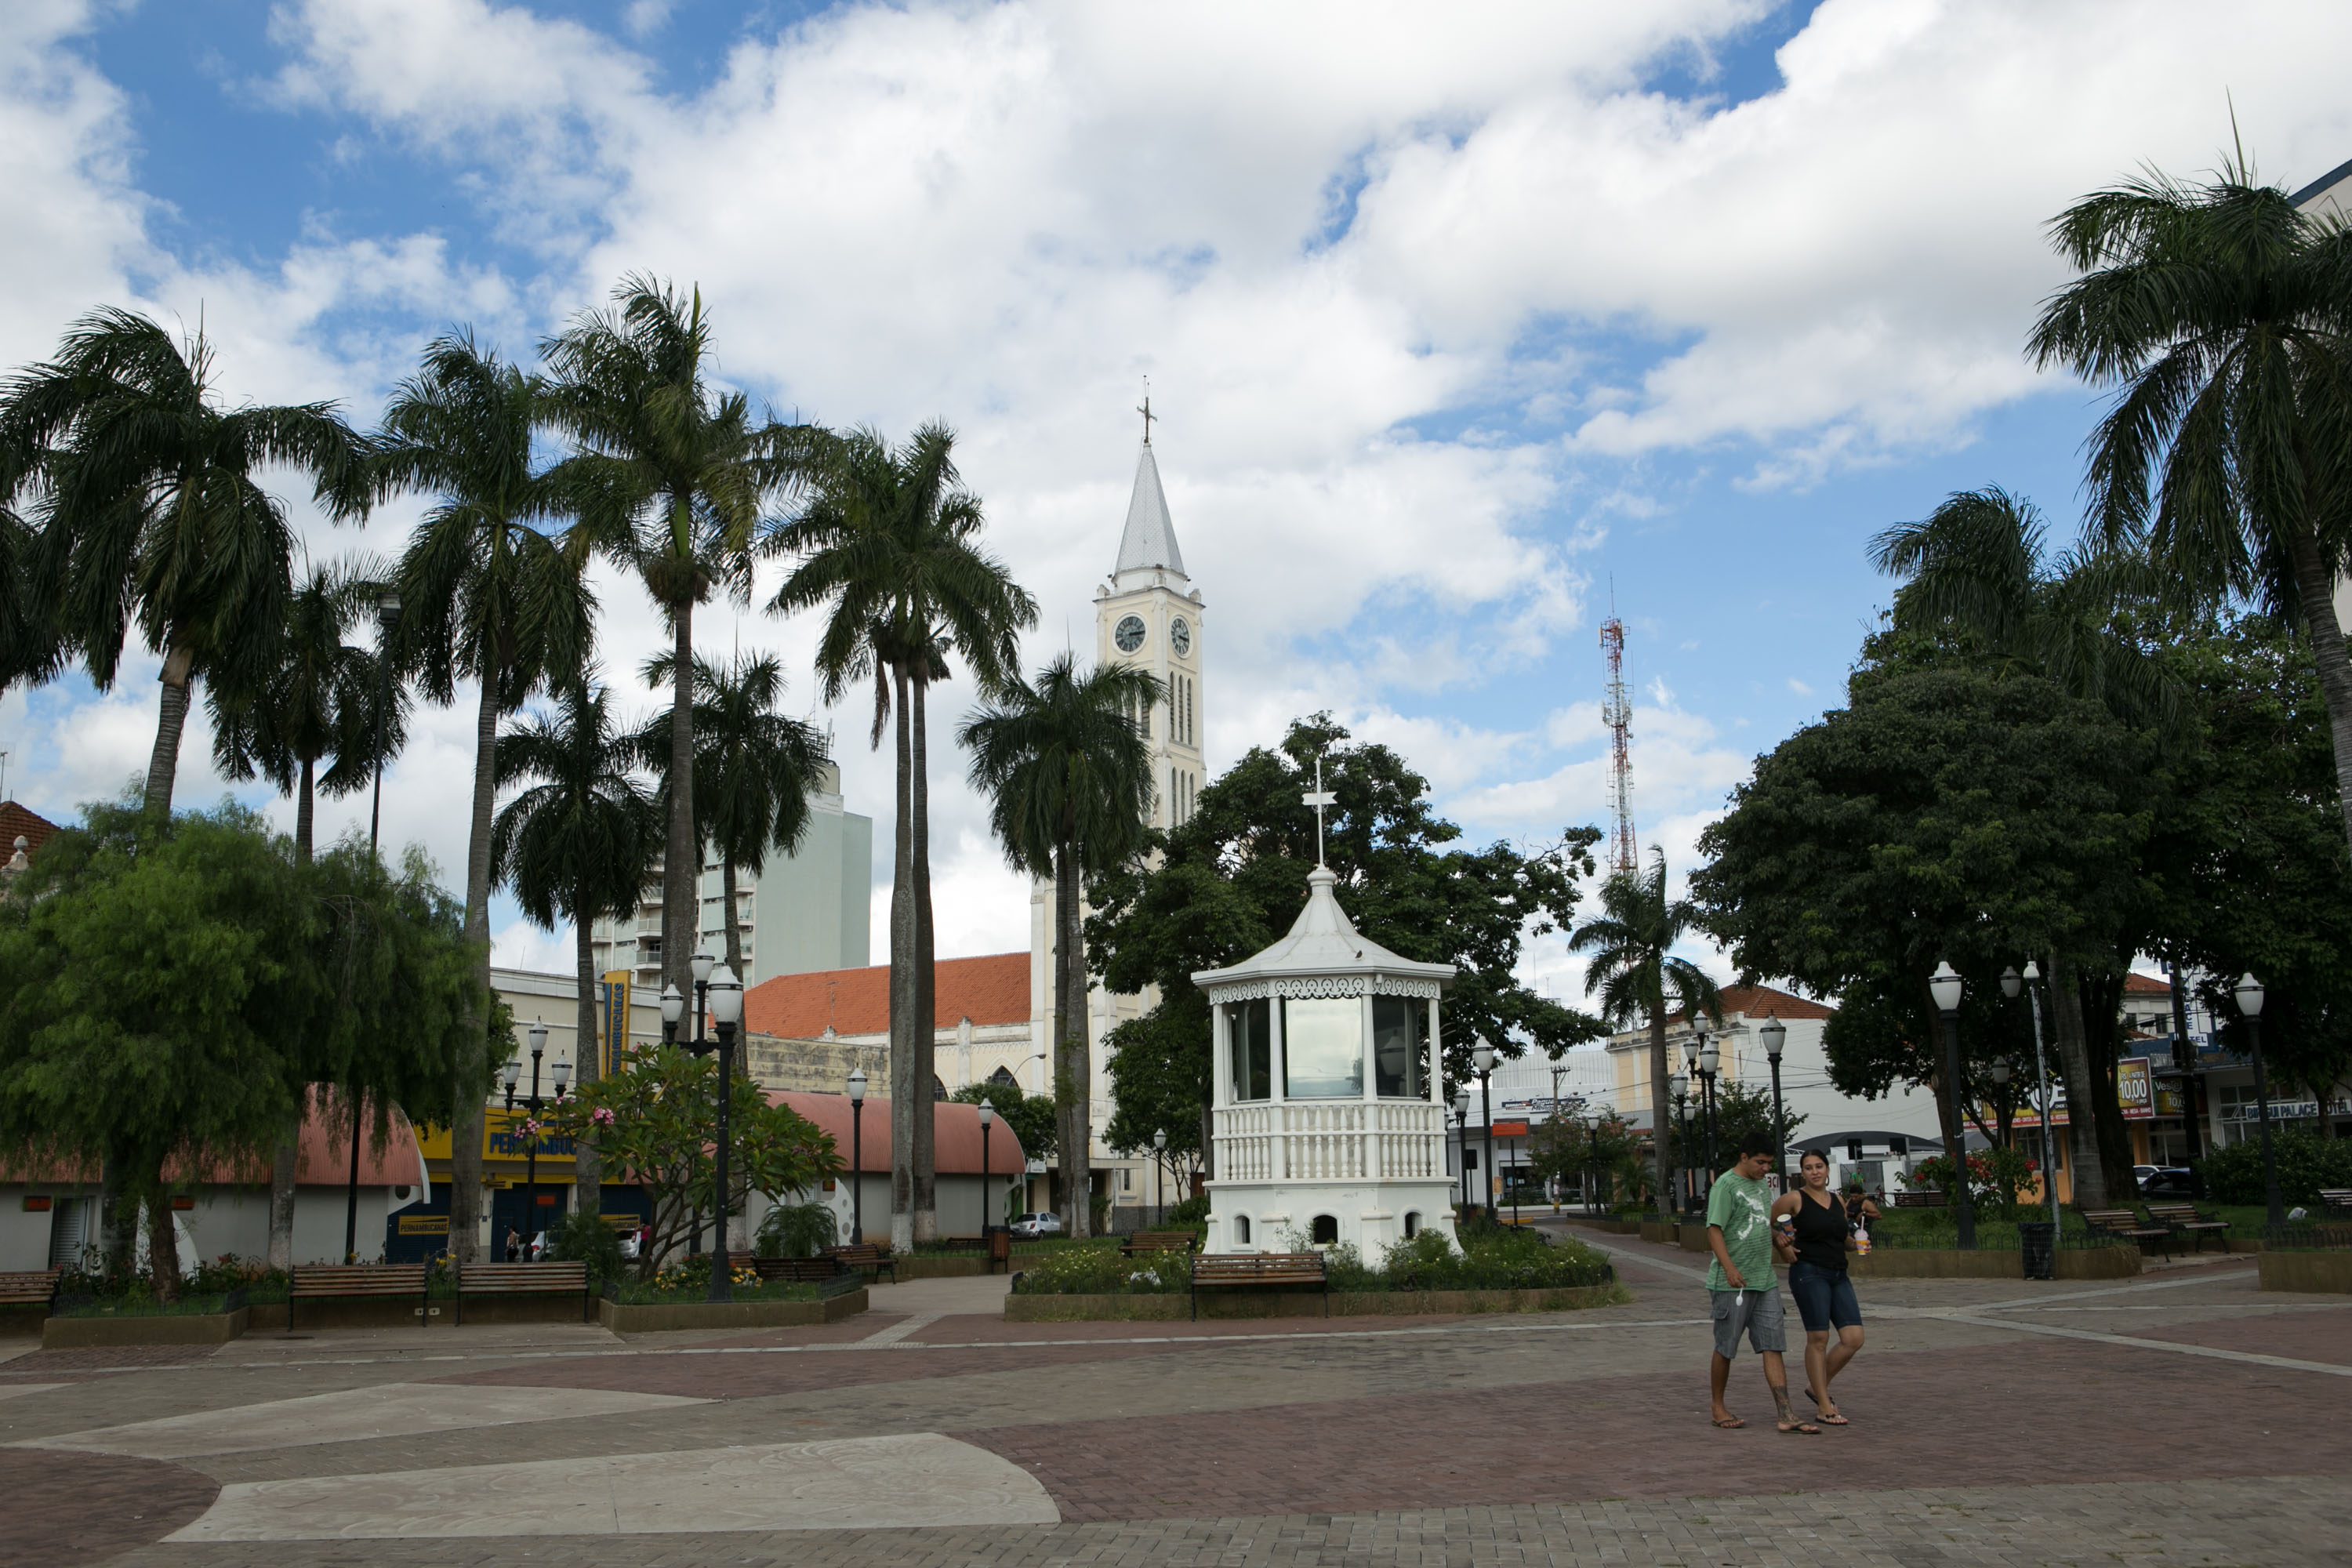
About Our Data
The data on this page is estimated using a number of publicly available tools and resources. It is provided without warranty, and could contain inaccuracies. Use at your own risk.