Industries
Business Distribution by Industry in Canitar
| Industry Description | Number of Establishments |
|---|---|
| Restaurants | 15 |
| Clothing stores | 8 |
| Public administration | 8 |
| Other membership organizations | 6 |
| Shopping | 6 |
| Churches | 6 |
| Education | 6 |
| Bars, pubs and taverns | 6 |
| Grocery stores and supermarkets | 5 |
| Post office | 5 |
Canitar Facts
| Area | 1.8 km² |
| Population | 4,306 |
| Male Population | 2,171 (50.4%) |
| Female Population | 2,135 (49.6%) |
| Population change (1975 to 2020) | +184.0% |
| Population change (2000 to 2020) | +26.1% |
| Median Age | 26.8 years (Male: 26.7, Female: 26.9) |
| GDP per capita (PPP) | $13,742 (2022) |
| Neighborhoods | Distrito Industrial, Centro |
| Local Time | |
| Timezone | Brasilia Standard Time |
| Lat & Lng | -23.00639, -49.78333 |
| Postal Codes | 18990 |
Map of Canitar
Interactive Map
Canitar Population
Years 1975 to 2030
| Data | 1975 | 1990 | 2000 | 2015 | 2020 | 2025* | 2030* |
|---|---|---|---|---|---|---|---|
| Population | 1,516 | 2,583 | 3,414 | 4,742 | 4,306 | 4,408 | 4,488 |
| Population Density | 836.4 / km² | 1,425.1 / km² | 1,883.6 / km² | 2,616.3 / km² | 2,375.7 / km² | 2,432 / km² | 2,476.1 / km² |
Canitar Population change from 2000 to 2020
Increase of 26.1% from year 2000 to 2020
| Location | Change since 1975 | Change since 1990 | Change since 2000 |
|---|---|---|---|
| Canitar | +184% | +66.7% | +26.1% |
| São Paulo (state) | — | — | — |
| Brazil | — | — | — |
Canitar Median Age
Median Age: 26.8 years
| Location | Median Age | Median Age (Female) | Median Age (Male) |
|---|---|---|---|
| Canitar | 26.8 yrs | 26.9 yrs | 26.7 yrs |
| São Paulo (state) | 31.5 yrs | 32.4 yrs | 30.4 yrs |
| Brazil | 29.5 yrs | 30.3 yrs | 28.7 yrs |
Canitar Population Density
Population Density: 2,376 / km²
| Location | Population | Area | Density |
|---|---|---|---|
| Canitar | 4,306 | 1.813 km² | 2,376 / km² |
| São Paulo (state) | 44.6 million | 248,223.6 km² | 180 / km² |
| Brazil | 206.1 million | 8,479,487.1 km² | 24.3 / km² |
Canitar Historical and Projected Population
Estimated Population from 700 to 2100
- JRC (European Commission's Joint Research Centre) work on the GHS built-up grid
- CIESIN (Center for International Earth Science Information Network)
- [Link] Klein Goldewijk, K., Beusen, A., Doelman, J., and Stehfest, E.: Anthropogenic land use estimates for the Holocene – HYDE 3.2, Earth Syst. Sci. Data, 9, 927–953, https://doi.org/10.5194/essd-9-927-2017, 2017.
Human Development Index (HDI)
Statistic composite index of life expectancy, education, and per capita income.
Canitar Gross Domestic Product (GDP)
GDP per capita, PPP (constant 2017 international $)
| Data | 1990 | 1995 | 2000 | 2005 | 2010 | 2015 | 2020 | 2022 |
|---|---|---|---|---|---|---|---|---|
| GDP per capita | $10,177 | $8,480 | $8,331 | $11,042 | $14,616 | $14,489 | $13,244 | $13,742 |
| Total GDP | $9.5M | $8.9M | $9.8M | $13.5M | $18.7M | $19.4M | $17.8M | $18.5M |
Canitar CO2 Emissions
Carbon Dioxide (CO2) Emissions Per Capita in Tonnes Per Year
| Location | CO2 Emissions | CO2 Emissions Per Capita | CO2 Emissions Intensity |
|---|---|---|---|
| Canitar | 12,722 tn | 2.95 tn | 7,019.1 tons/km² |
| São Paulo (state) | 156,280,136 tn | 3.51 tn | 629.6 tons/km² |
| Brazil | 561,829,904 tn | 2.73 tn | 66.3 tons/km² |
| 2013 CO2 emissions (tonnes/year) | 12,722 tn |
| 2013 CO2 emissions (tonnes/year) per capita | 2.95 tn |
| 2013 CO2 emissions intensity (tonnes/km²/year) | 7,019.1 tons/km² |
Natural Hazards Risk
Relative risk out of 10
| Hazard | Risk Level |
|---|---|
| Flood | High (8) |
* Risk, particularly concerning flood or landslide, may not be for the entire area.
- Dilley, M., R.S. Chen, U. Deichmann, A.L. Lerner-Lam, M. Arnold, J. Agwe, P. Buys, O. Kjekstad, B. Lyon, and G. Yetman. 2005. Natural Disaster Hotspots: A Global Risk Analysis. Washington, D.C.: World Bank. https://doi.org/10.1596/0-8213-5930-4.
- Center for Hazards and Risk Research - CHRR - Columbia University, Center for International Earth Science Information Network - CIESIN - Columbia University. 2005. Global Flood Hazard Frequency and Distribution. Palisades, NY: NASA Socioeconomic Data and Applications Center (SEDAC). https://doi.org/10.7927/H4668B3D.
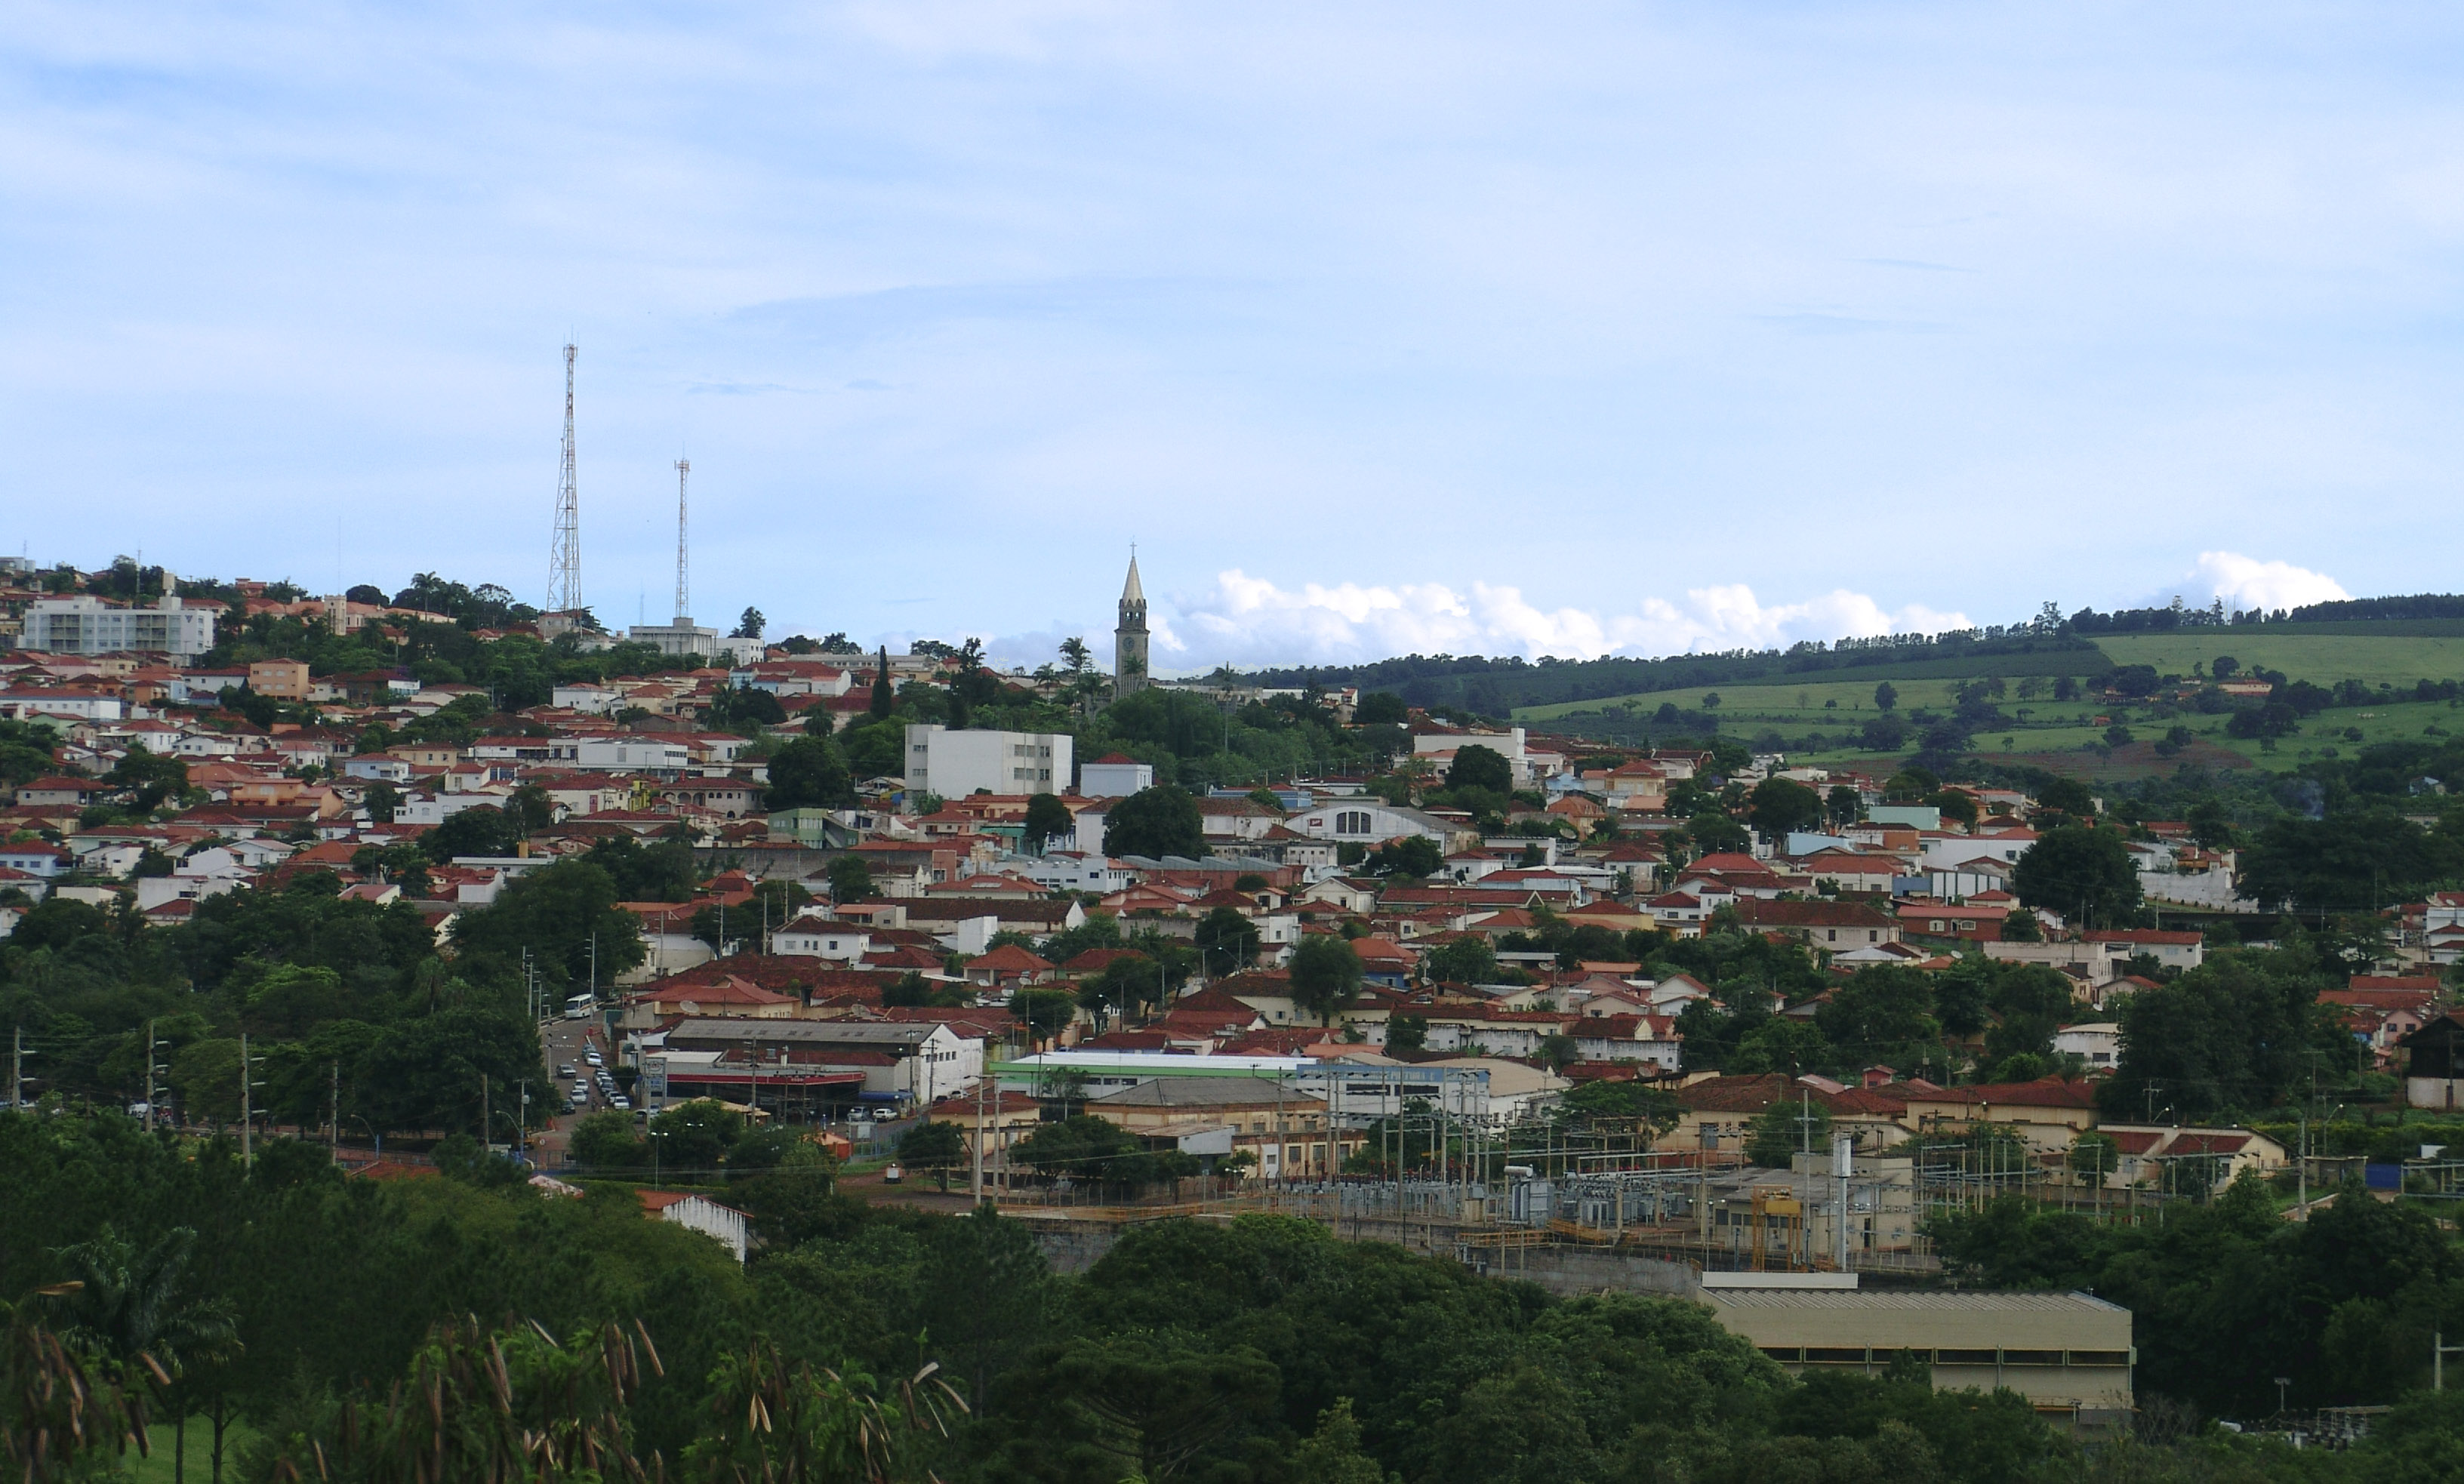
Canitar
Canitar is a municipality in the southwestern part of the state of São Paulo in Brazil. The population is 4,884 (2015 est.) in an area of 57.5 km². It was a district of the municipality of Chavantes until 1991, when it became an independent municipal..
Canitar Wikipedia Page

About Our Data
The data on this page is estimated using a number of publicly available tools and resources. It is provided without warranty, and could contain inaccuracies. Use at your own risk.