Categories in Coqueiral
Industries
Business Distribution by Industry in Coqueiral
| Industry Description | Number of Establishments | Average Google Rating |
|---|---|---|
| Shopping | 28 | 3.8 |
| Education | 9 | 1 |
| Grocery stores and supermarkets | 8 | 3.9 |
| Religion | 7 | 4 |
| All food and beverage | 7 | 3.6 |
| Pharmacies and drug stores | 6 | 4 |
Coqueiral Facts
| Area | 1.9 km² |
| Population | 6,561 |
| Male Population | 3,157 (48.1%) |
| Female Population | 3,404 (51.9%) |
| Population change (1975 to 2020) | +13.7% |
| Population change (2000 to 2020) | -3.0% |
| Median Age | 33 years (Male: 32.3, Female: 33.6) |
| Neighborhoods | Centro, Lajinha, Vila Sonia, São Mateus, Jardim Juliana |
| Local Time | |
| Timezone | Brasilia Standard Time |
| Lat & Lng | -21.18944, -45.44056 |
| Postal Codes | 37235 |
Map of Coqueiral
Interactive Map
Coqueiral Population
Years 1975 to 2020
| Data | 1975 | 1990 | 2000 | 2015 | 2020 |
|---|---|---|---|---|---|
| Population | 5,768 | 6,646 | 6,766 | 6,353 | 6,561 |
| Population Density | 3,076.3 / km² | 3,544.5 / km² | 3,608.5 / km² | 3,388.3 / km² | 3,499.2 / km² |
Coqueiral Population change from 2000 to 2015
Decrease of 6.1% from year 2000 to 2015
| Location | Change since 1975 | Change since 1990 | Change since 2000 |
|---|---|---|---|
| Coqueiral | +10.1% | -4.4% | -6.1% |
| Minas Gerais | +76.6% | +30.1% | +13.6% |
| Brazil | +91.5% | +38.1% | +18.2% |
Coqueiral Median Age
Median Age: 33 years
| Location | Median Age | Median Age (Female) | Median Age (Male) |
|---|---|---|---|
| Coqueiral | 33 yrs | 33.6 yrs | 32.3 yrs |
| Minas Gerais | 30.8 yrs | 31.6 yrs | 30 yrs |
| Brazil | 29.5 yrs | 30.3 yrs | 28.7 yrs |
Coqueiral Population Density
Population Density: 3,499 / km²
| Location | Population | Area | Density |
|---|---|---|---|
| Coqueiral | 6,561 | 1.875 km² | 3,499 / km² |
| Minas Gerais | 21 million | 586,522.1 km² | 35.9 / km² |
| Brazil | 206.1 million | 8,479,487.1 km² | 24.3 / km² |
Coqueiral Historical and Projected Population
Estimated Population from 0 to 2100
- JRC (European Commission's Joint Research Centre) work on the GHS built-up grid
- CIESIN (Center for International Earth Science Information Network)
- [Link] Klein Goldewijk, K., Beusen, A., Doelman, J., and Stehfest, E.: Anthropogenic land use estimates for the Holocene – HYDE 3.2, Earth Syst. Sci. Data, 9, 927–953, https://doi.org/10.5194/essd-9-927-2017, 2017.
Neighborhoods in Coqueiral
Percentage of businesses by neighborhood in Coqueiral
Area Codes
Percentage Area Codes used by businesses in Coqueiral
Price Distribution
Business distribution by price for Coqueiral
Human Development Index (HDI)
Statistic composite index of life expectancy, education, and per capita income.
Coqueiral CO2 Emissions
Carbon Dioxide (CO2) Emissions Per Capita in Tonnes Per Year
| Location | CO2 Emissions | CO2 Emissions Per Capita | CO2 Emissions Intensity |
|---|---|---|---|
| Coqueiral | 17,947 tn | 2.74 tn | 9,571.7 tons/km² |
| Minas Gerais | 61,830,304 tn | 2.94 tn | 105.4 tons/km² |
| Brazil | 561,829,904 tn | 2.73 tn | 66.3 tons/km² |
| 2013 CO2 emissions (tonnes/year) | 17,947 tn |
| 2013 CO2 emissions (tonnes/year) per capita | 2.74 tn |
| 2013 CO2 emissions intensity (tonnes/km²/year) | 9,571.7 tons/km² |
Natural Hazards Risk
Relative risk out of 10
| Hazard | Risk Level |
|---|---|
| Drought | Medium (4) |
| Flood | High (9) |
* Risk, particularly concerning flood or landslide, may not be for the entire area.
- Dilley, M., R.S. Chen, U. Deichmann, A.L. Lerner-Lam, M. Arnold, J. Agwe, P. Buys, O. Kjekstad, B. Lyon, and G. Yetman. 2005. Natural Disaster Hotspots: A Global Risk Analysis. Washington, D.C.: World Bank. https://doi.org/10.1596/0-8213-5930-4.
- Center for Hazards and Risk Research - CHRR - Columbia University, Center for International Earth Science Information Network - CIESIN - Columbia University, and International Research Institute for Climate and Society - IRI - Columbia University. 2005. Global Drought Hazard Frequency and Distribution. Palisades, NY: NASA Socioeconomic Data and Applications Center (SEDAC). https://doi.org/10.7927/H4VX0DFT.
- Center for Hazards and Risk Research - CHRR - Columbia University, Center for International Earth Science Information Network - CIESIN - Columbia University. 2005. Global Flood Hazard Frequency and Distribution. Palisades, NY: NASA Socioeconomic Data and Applications Center (SEDAC). https://doi.org/10.7927/H4668B3D.
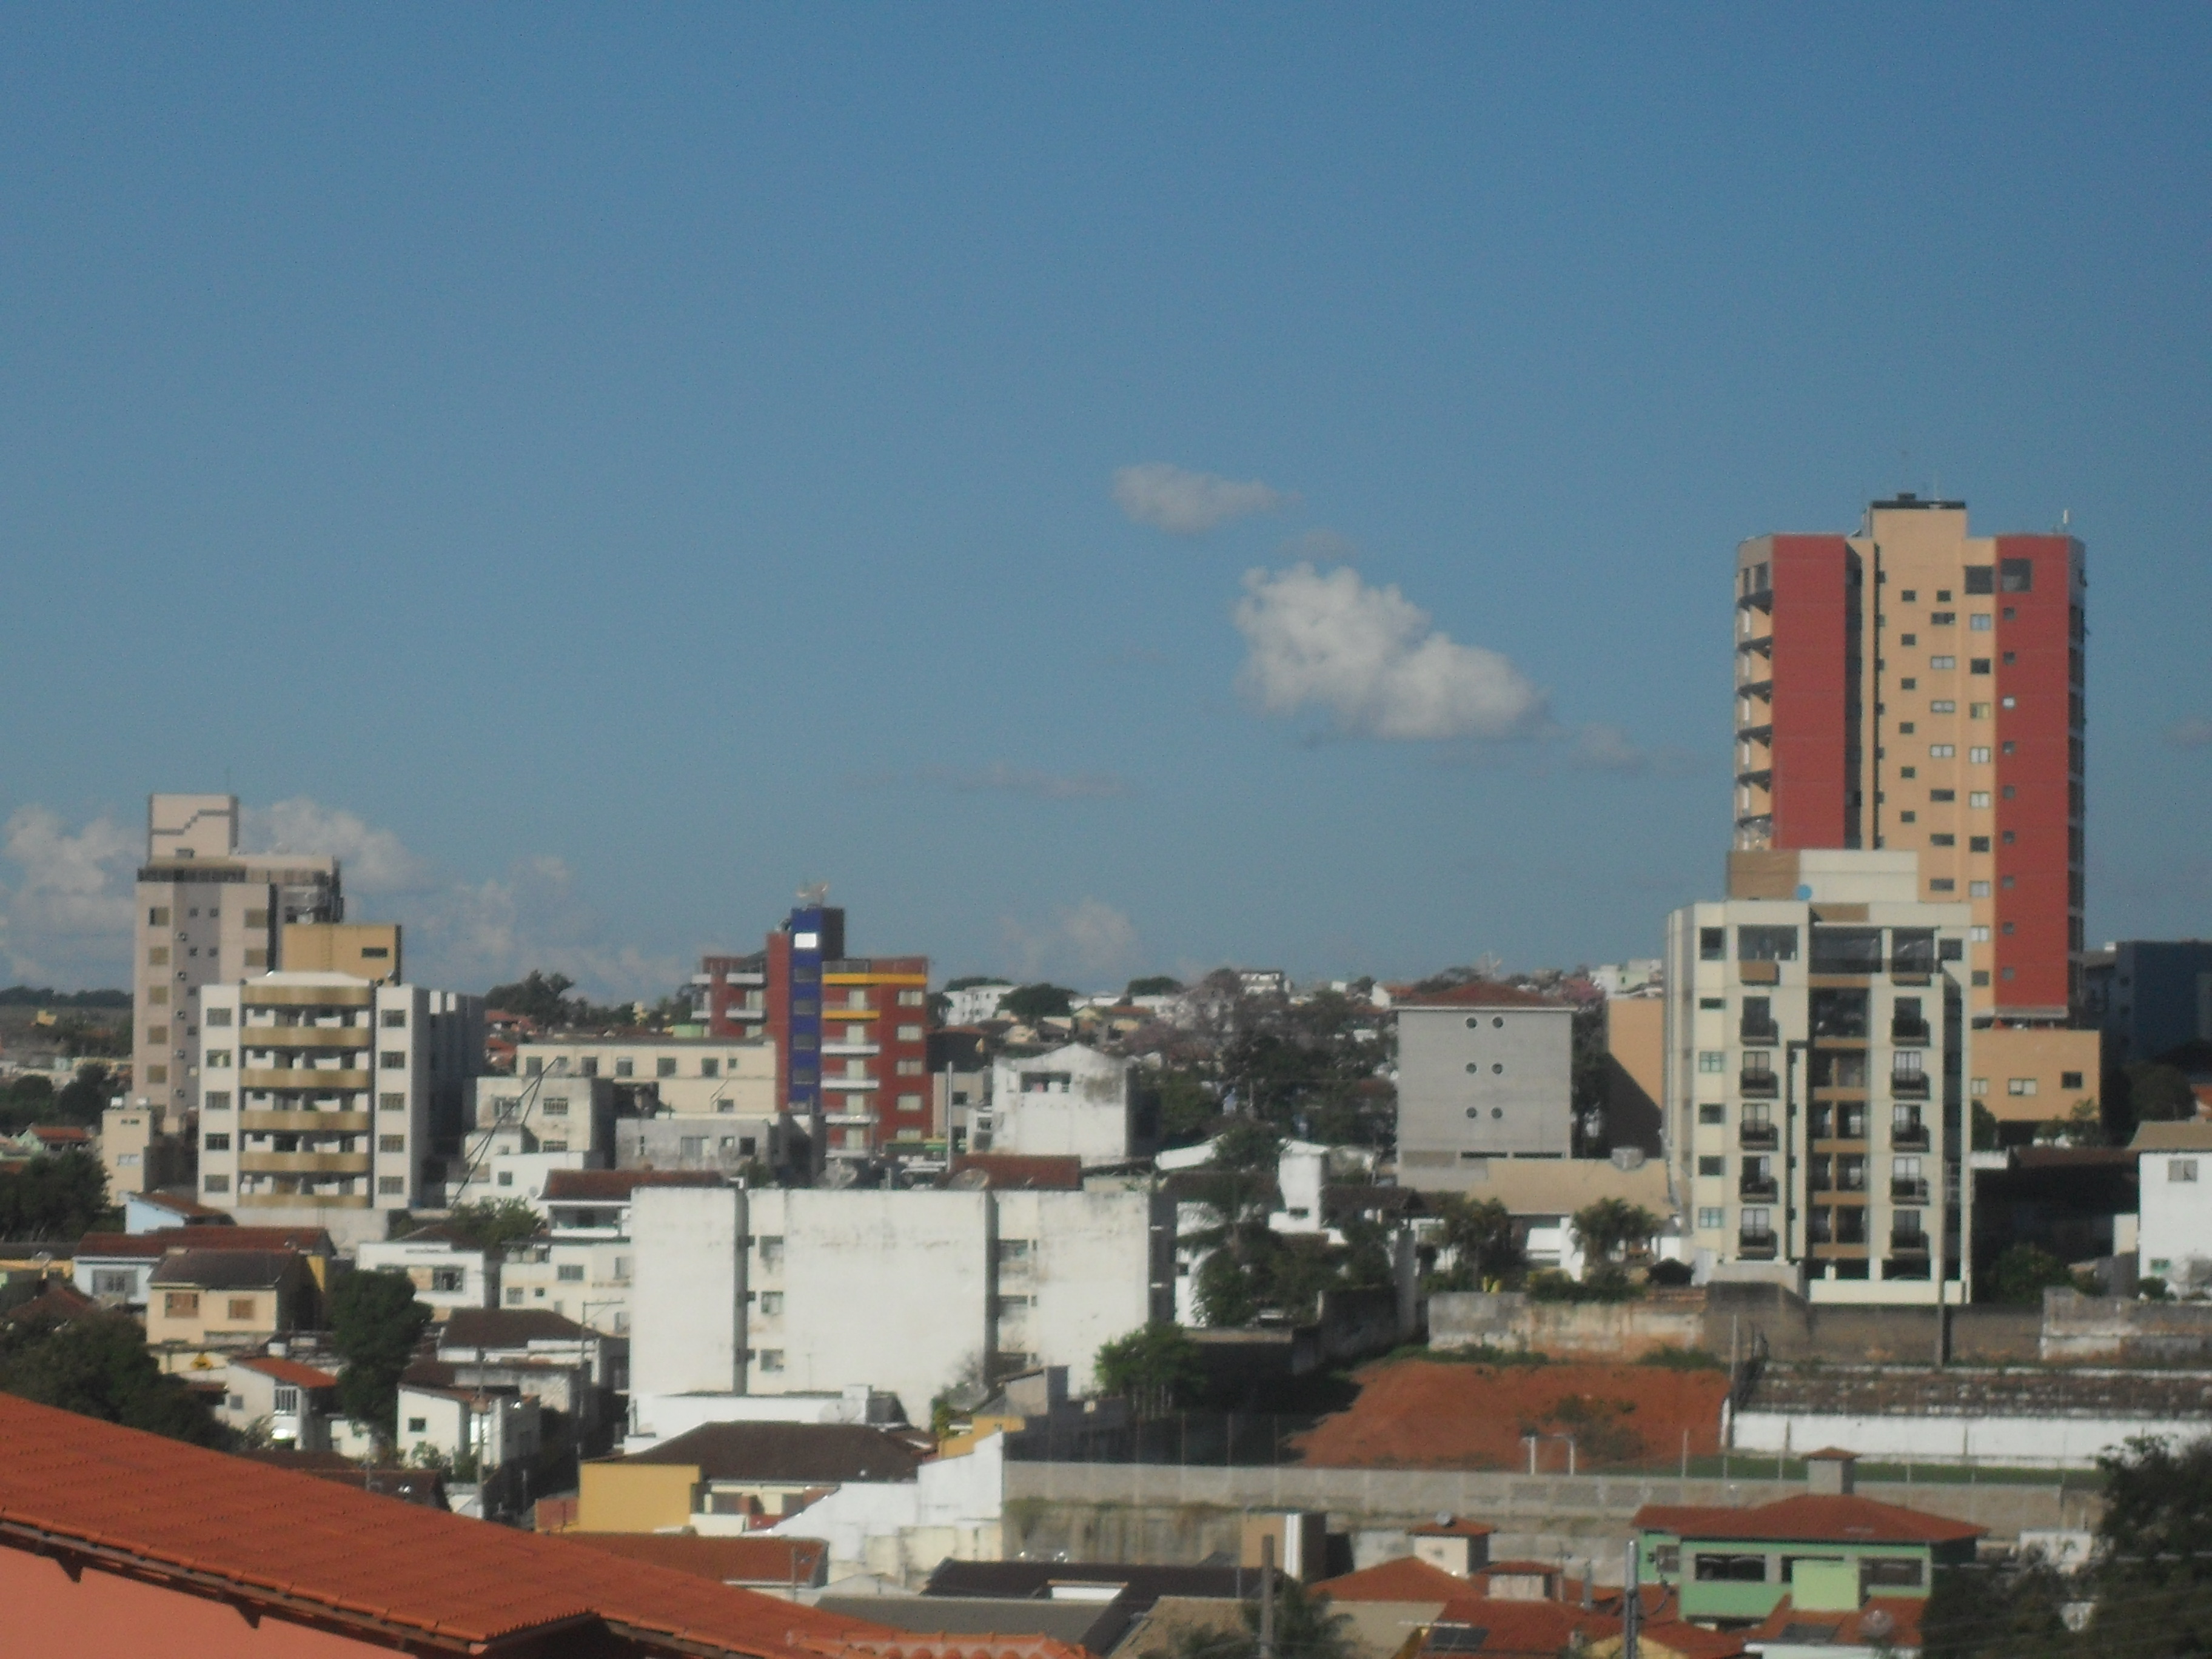
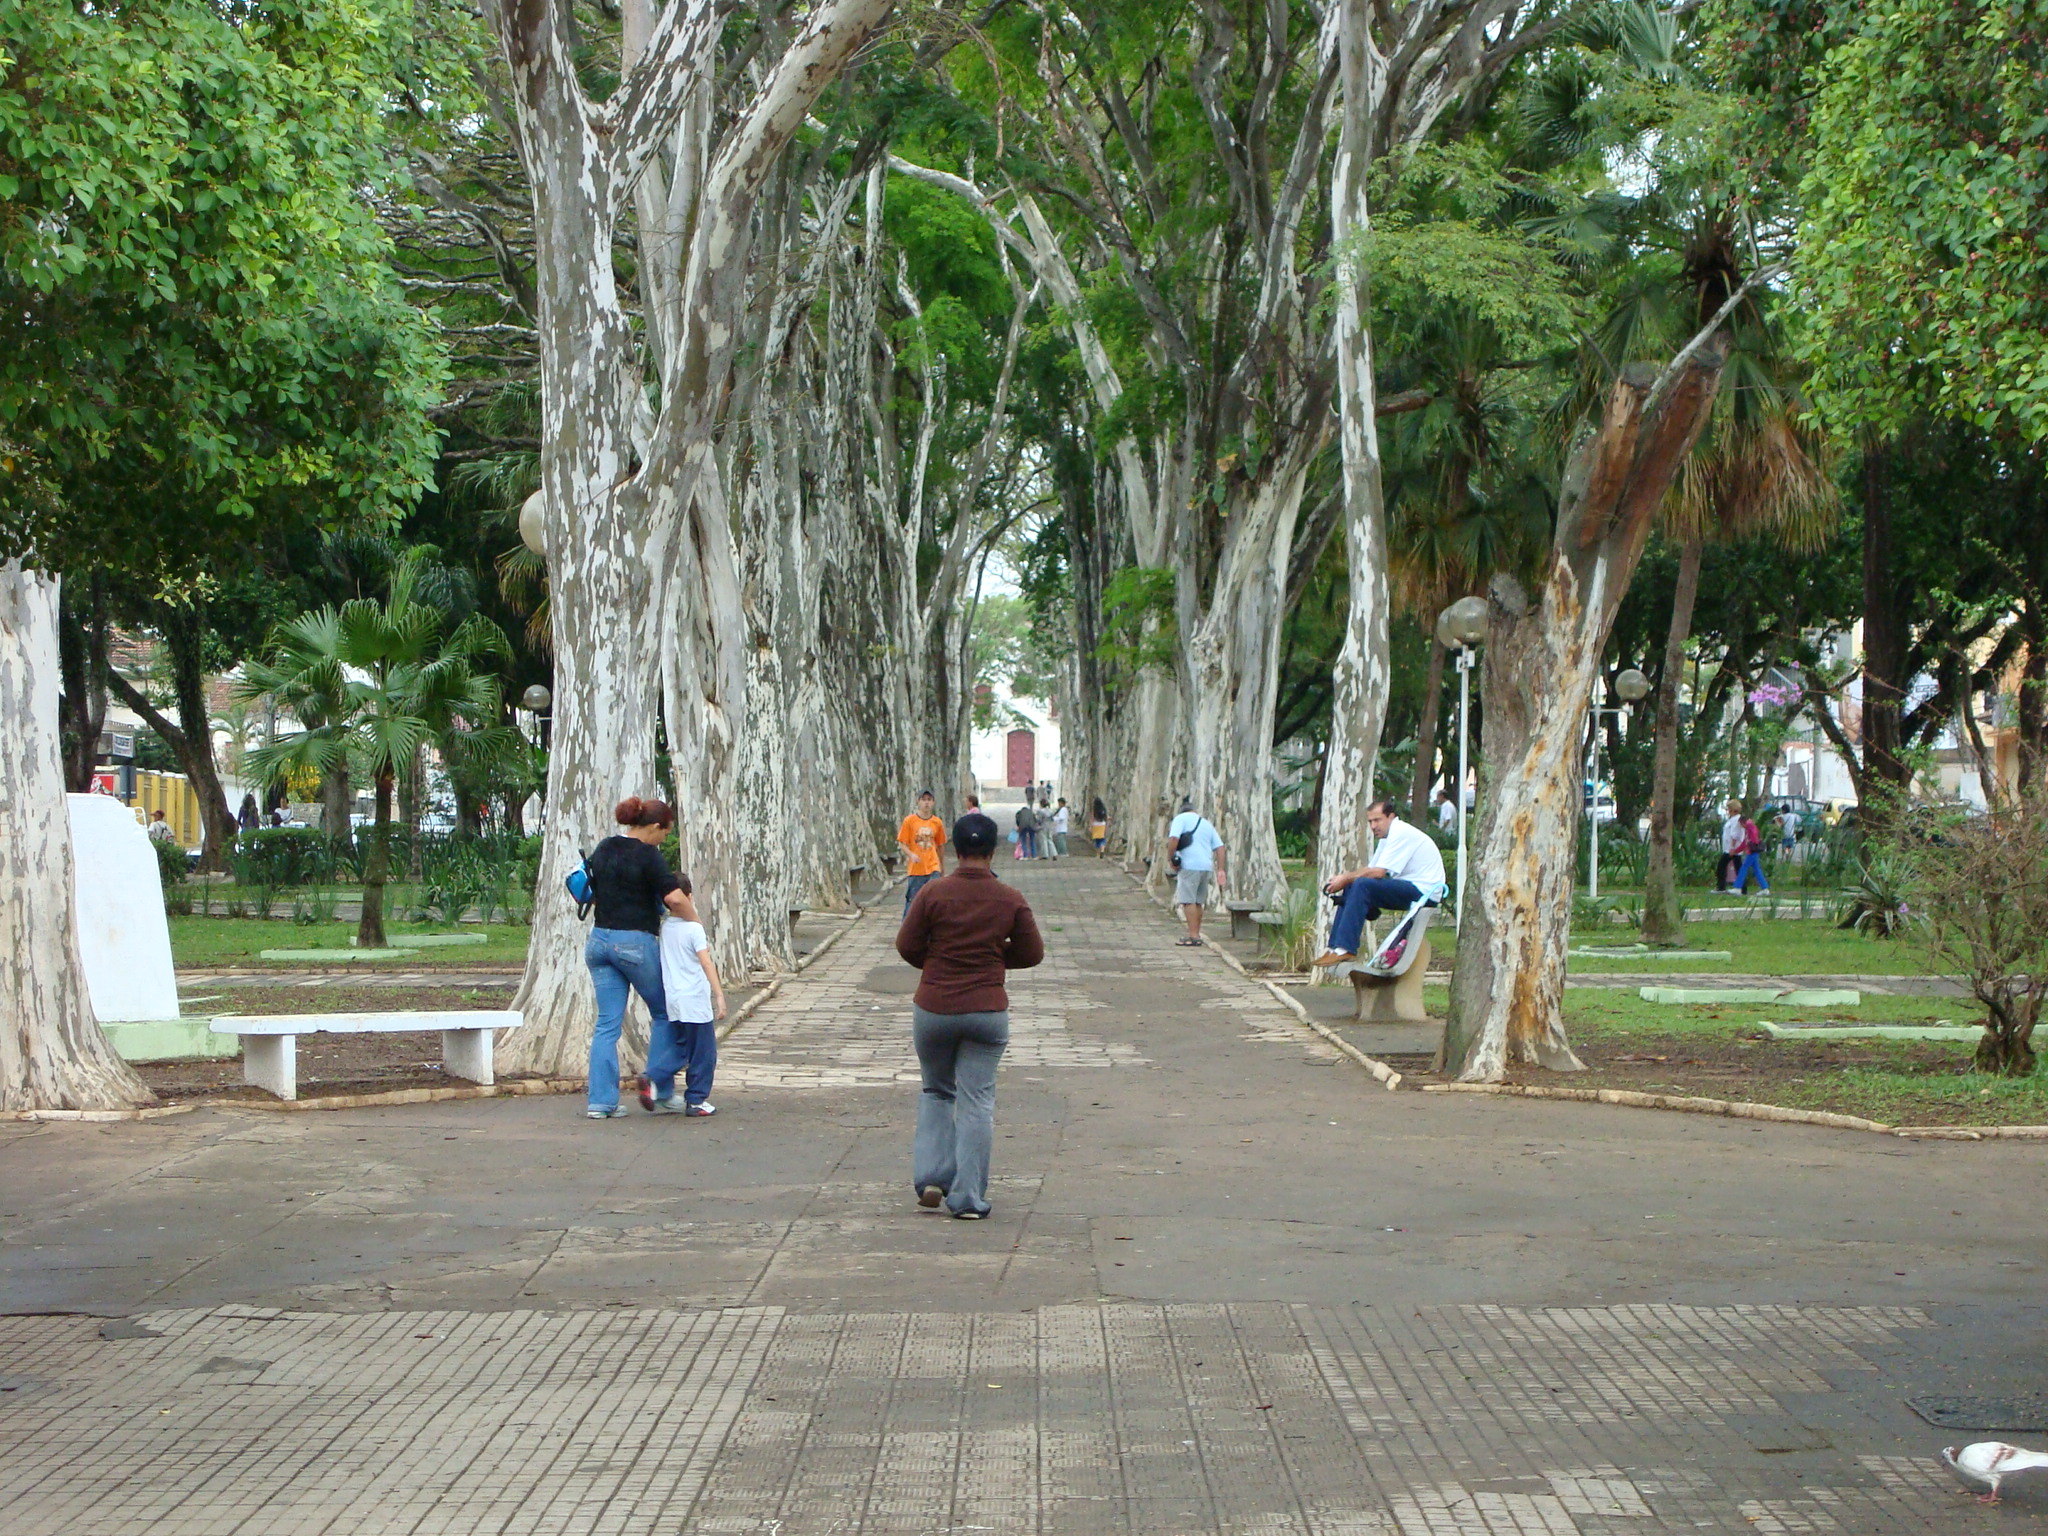
Coqueiral
Coqueiral is a municipality in the south of the Brazilian state of Minas Gerais. In 2007 the population was 9,466 in a total area of 297 km². The municipal seat lies at an elevation of 844 meters. It became a municipality in 1948. belongs to the IBG..
Coqueiral Wikipedia Page
About Our Data
The data on this page is estimated using a number of publicly available tools and resources. It is provided without warranty, and could contain inaccuracies. Use at your own risk.