Categories in Formiga
Industries
Business Distribution by Industry in Formiga
| Industry Description | Number of Establishments | Average Age of Business |
|---|---|---|
| Shopping | 496 | 29 years |
| Clothing stores | 311 | 26 years |
| Grocery stores and supermarkets | 228 | 37 years |
| Restaurants | 212 | — |
| Car repair | 186 | 36 years |
| Health and medical | 147 | — |
| Education | 137 | — |
| All food and beverage | 133 | — |
| Corporate management | 124 | 29 years |
| Lawyers legal | 122 | — |
| Beauty salons | 121 | — |
| Pharmacies and drug stores | 120 | 31 years |
| Real estate | 119 | — |
| Shopping other | 108 | 33 years |
| Gas station | 103 | 48 years |
| Dentists | 100 | — |
| Electronics stores | 93 | 25 years |
| Wholesale of construction supplies | 91 | — |
| Bars, pubs and taverns | 89 | — |
Formiga Facts
| Area | 30.3 km² |
| Population | 61,715 |
| Male Population | 29,844 (48.4%) |
| Female Population | 31,871 (51.6%) |
| Population change (1975 to 2020) | +45.6% |
| Population change (2000 to 2020) | +4.7% |
| Median Age | 33.5 years (Male: 32.1, Female: 34.8) |
| GDP per capita (PPP) | $8,976 (2022) |
| Neighborhoods | Centro, Sagrado Coração de Jesus, Planalto, Bela Vista, Quinzinho |
| Local Time | |
| Timezone | Brasilia Standard Time |
| Lat & Lng | -20.46444, -45.42639 |
| Postal Codes | 35570, 37290 |
Map of Formiga
Interactive Map
Formiga Population
Years 1975 to 2030
| Data | 1975 | 1990 | 2000 | 2015 | 2020 | 2025* | 2030* |
|---|---|---|---|---|---|---|---|
| Population | 42,395 | 54,089 | 58,943 | 61,292 | 61,715 | 62,353 | 63,302 |
| Population Density | 1,401.5 / km² | 1,788.1 / km² | 1,948.5 / km² | 2,026.2 / km² | 2,040.2 / km² | 2,061.3 / km² | 2,092.6 / km² |
Formiga Population change from 2000 to 2020
Increase of 4.7% from year 2000 to 2020
| Location | Change since 1975 | Change since 1990 | Change since 2000 |
|---|---|---|---|
| Formiga | +45.6% | +14.1% | +4.7% |
| Minas Gerais | — | — | — |
| Brazil | — | — | — |
Formiga Median Age
Median Age: 33.5 years
| Location | Median Age | Median Age (Female) | Median Age (Male) |
|---|---|---|---|
| Formiga | 33.5 yrs | 34.8 yrs | 32.1 yrs |
| Minas Gerais | 30.8 yrs | 31.6 yrs | 30 yrs |
| Brazil | 29.5 yrs | 30.3 yrs | 28.7 yrs |
Formiga Population Density
Population Density: 2,040 / km²
| Location | Population | Area | Density |
|---|---|---|---|
| Formiga | 61,715 | 30.3 km² | 2,040 / km² |
| Minas Gerais | 21 million | 586,522.1 km² | 35.9 / km² |
| Brazil | 206.1 million | 8,479,487.1 km² | 24.3 / km² |
Formiga Historical and Projected Population
Estimated Population from 1830 to 2100
- JRC (European Commission's Joint Research Centre) work on the GHS built-up grid
- CIESIN (Center for International Earth Science Information Network)
- [Link] Klein Goldewijk, K., Beusen, A., Doelman, J., and Stehfest, E.: Anthropogenic land use estimates for the Holocene – HYDE 3.2, Earth Syst. Sci. Data, 9, 927–953, https://doi.org/10.5194/essd-9-927-2017, 2017.
Neighborhoods in Formiga
Percentage of businesses by neighborhood in Formiga
Price Distribution
Business distribution by price for Formiga
Human Development Index (HDI)
Statistic composite index of life expectancy, education, and per capita income.
Formiga Gross Domestic Product (GDP)
GDP per capita, PPP (constant 2017 international $)
| Data | 1990 | 1995 | 2000 | 2005 | 2010 | 2015 | 2020 | 2022 |
|---|---|---|---|---|---|---|---|---|
| GDP per capita | $9,260 | $9,049 | $9,055 | $8,013 | $9,055 | $7,947 | $9,095 | $8,976 |
| Total GDP | $480.9M | $490.5M | $502.8M | $457.2M | $516.7M | $454.1M | $531.3M | $526.4M |
Formiga CO2 Emissions
Carbon Dioxide (CO2) Emissions Per Capita in Tonnes Per Year
| Location | CO2 Emissions | CO2 Emissions Per Capita | CO2 Emissions Intensity |
|---|---|---|---|
| Formiga | 207,834 tn | 3.37 tn | 6,870.5 tons/km² |
| Minas Gerais | 61,830,304 tn | 2.94 tn | 105.4 tons/km² |
| Brazil | 561,829,904 tn | 2.73 tn | 66.3 tons/km² |
| 2013 CO2 emissions (tonnes/year) | 207,834 tn |
| 2013 CO2 emissions (tonnes/year) per capita | 3.37 tn |
| 2013 CO2 emissions intensity (tonnes/km²/year) | 6,870.5 tons/km² |
Natural Hazards Risk
Relative risk out of 10
| Hazard | Risk Level |
|---|---|
| Drought | Medium (4) |
| Flood | High (8) |
* Risk, particularly concerning flood or landslide, may not be for the entire area.
- Dilley, M., R.S. Chen, U. Deichmann, A.L. Lerner-Lam, M. Arnold, J. Agwe, P. Buys, O. Kjekstad, B. Lyon, and G. Yetman. 2005. Natural Disaster Hotspots: A Global Risk Analysis. Washington, D.C.: World Bank. https://doi.org/10.1596/0-8213-5930-4.
- Center for Hazards and Risk Research - CHRR - Columbia University, Center for International Earth Science Information Network - CIESIN - Columbia University, and International Research Institute for Climate and Society - IRI - Columbia University. 2005. Global Drought Hazard Frequency and Distribution. Palisades, NY: NASA Socioeconomic Data and Applications Center (SEDAC). https://doi.org/10.7927/H4VX0DFT.
- Center for Hazards and Risk Research - CHRR - Columbia University, Center for International Earth Science Information Network - CIESIN - Columbia University. 2005. Global Flood Hazard Frequency and Distribution. Palisades, NY: NASA Socioeconomic Data and Applications Center (SEDAC). https://doi.org/10.7927/H4668B3D.
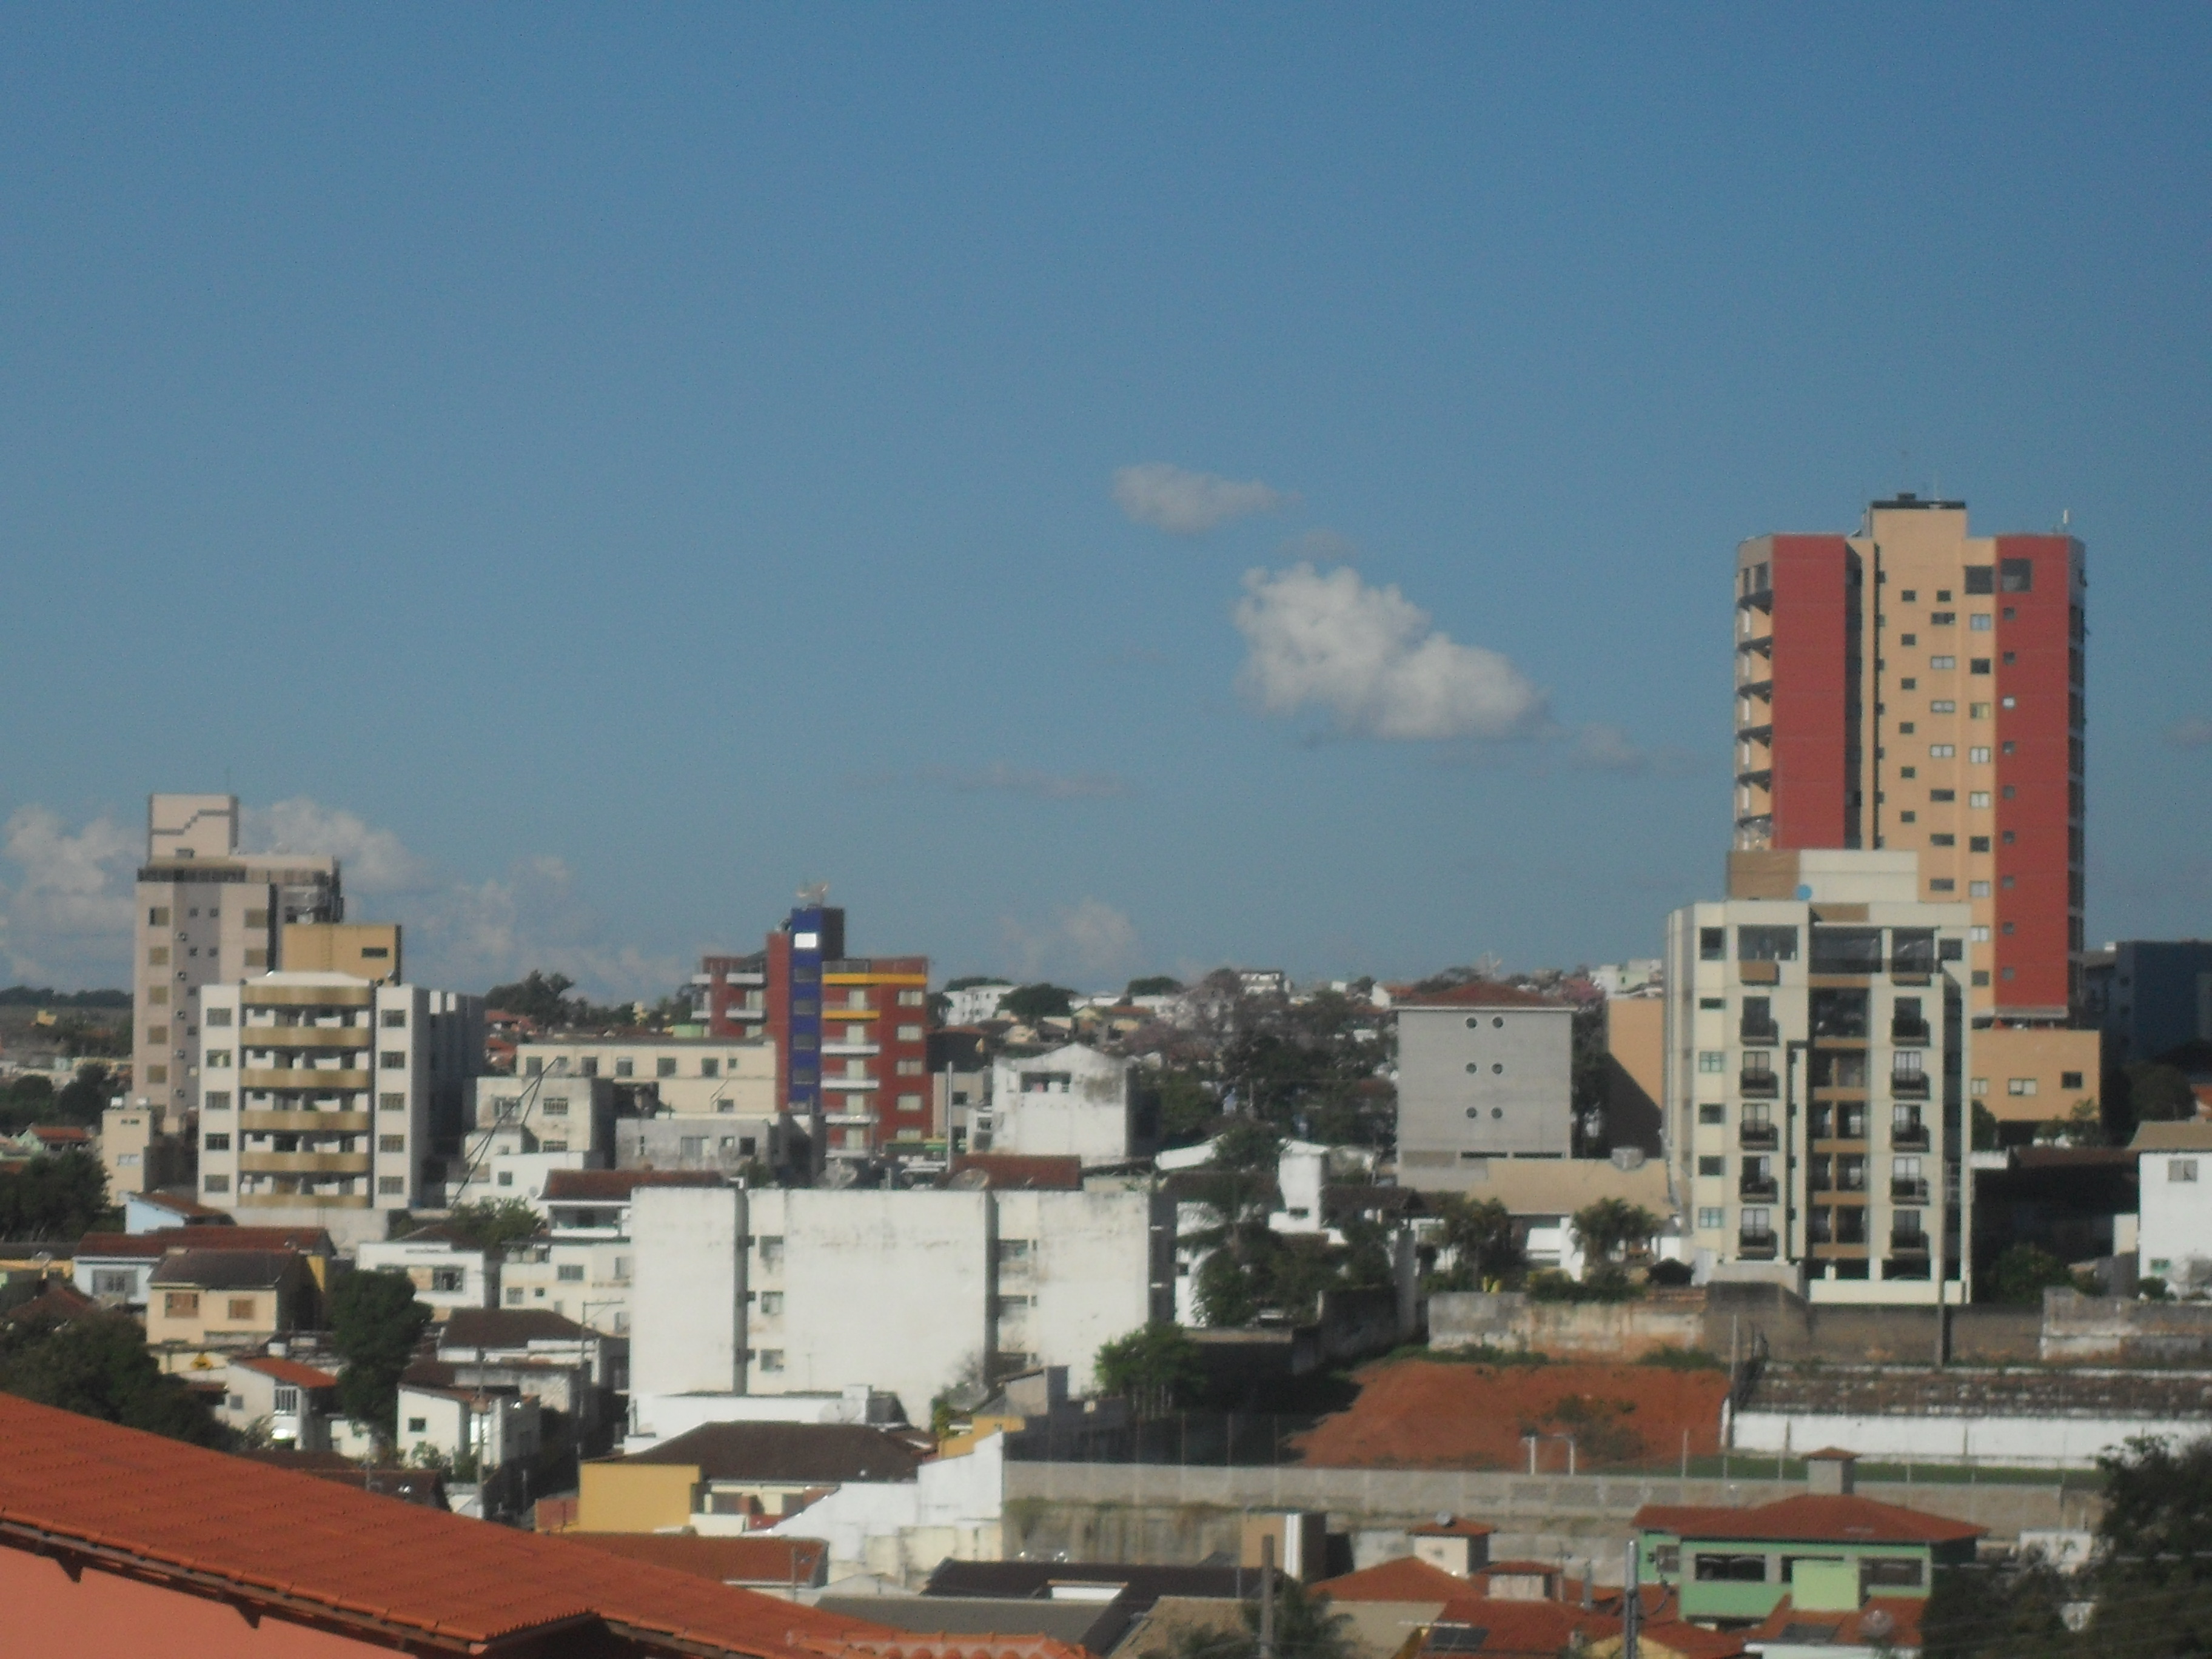
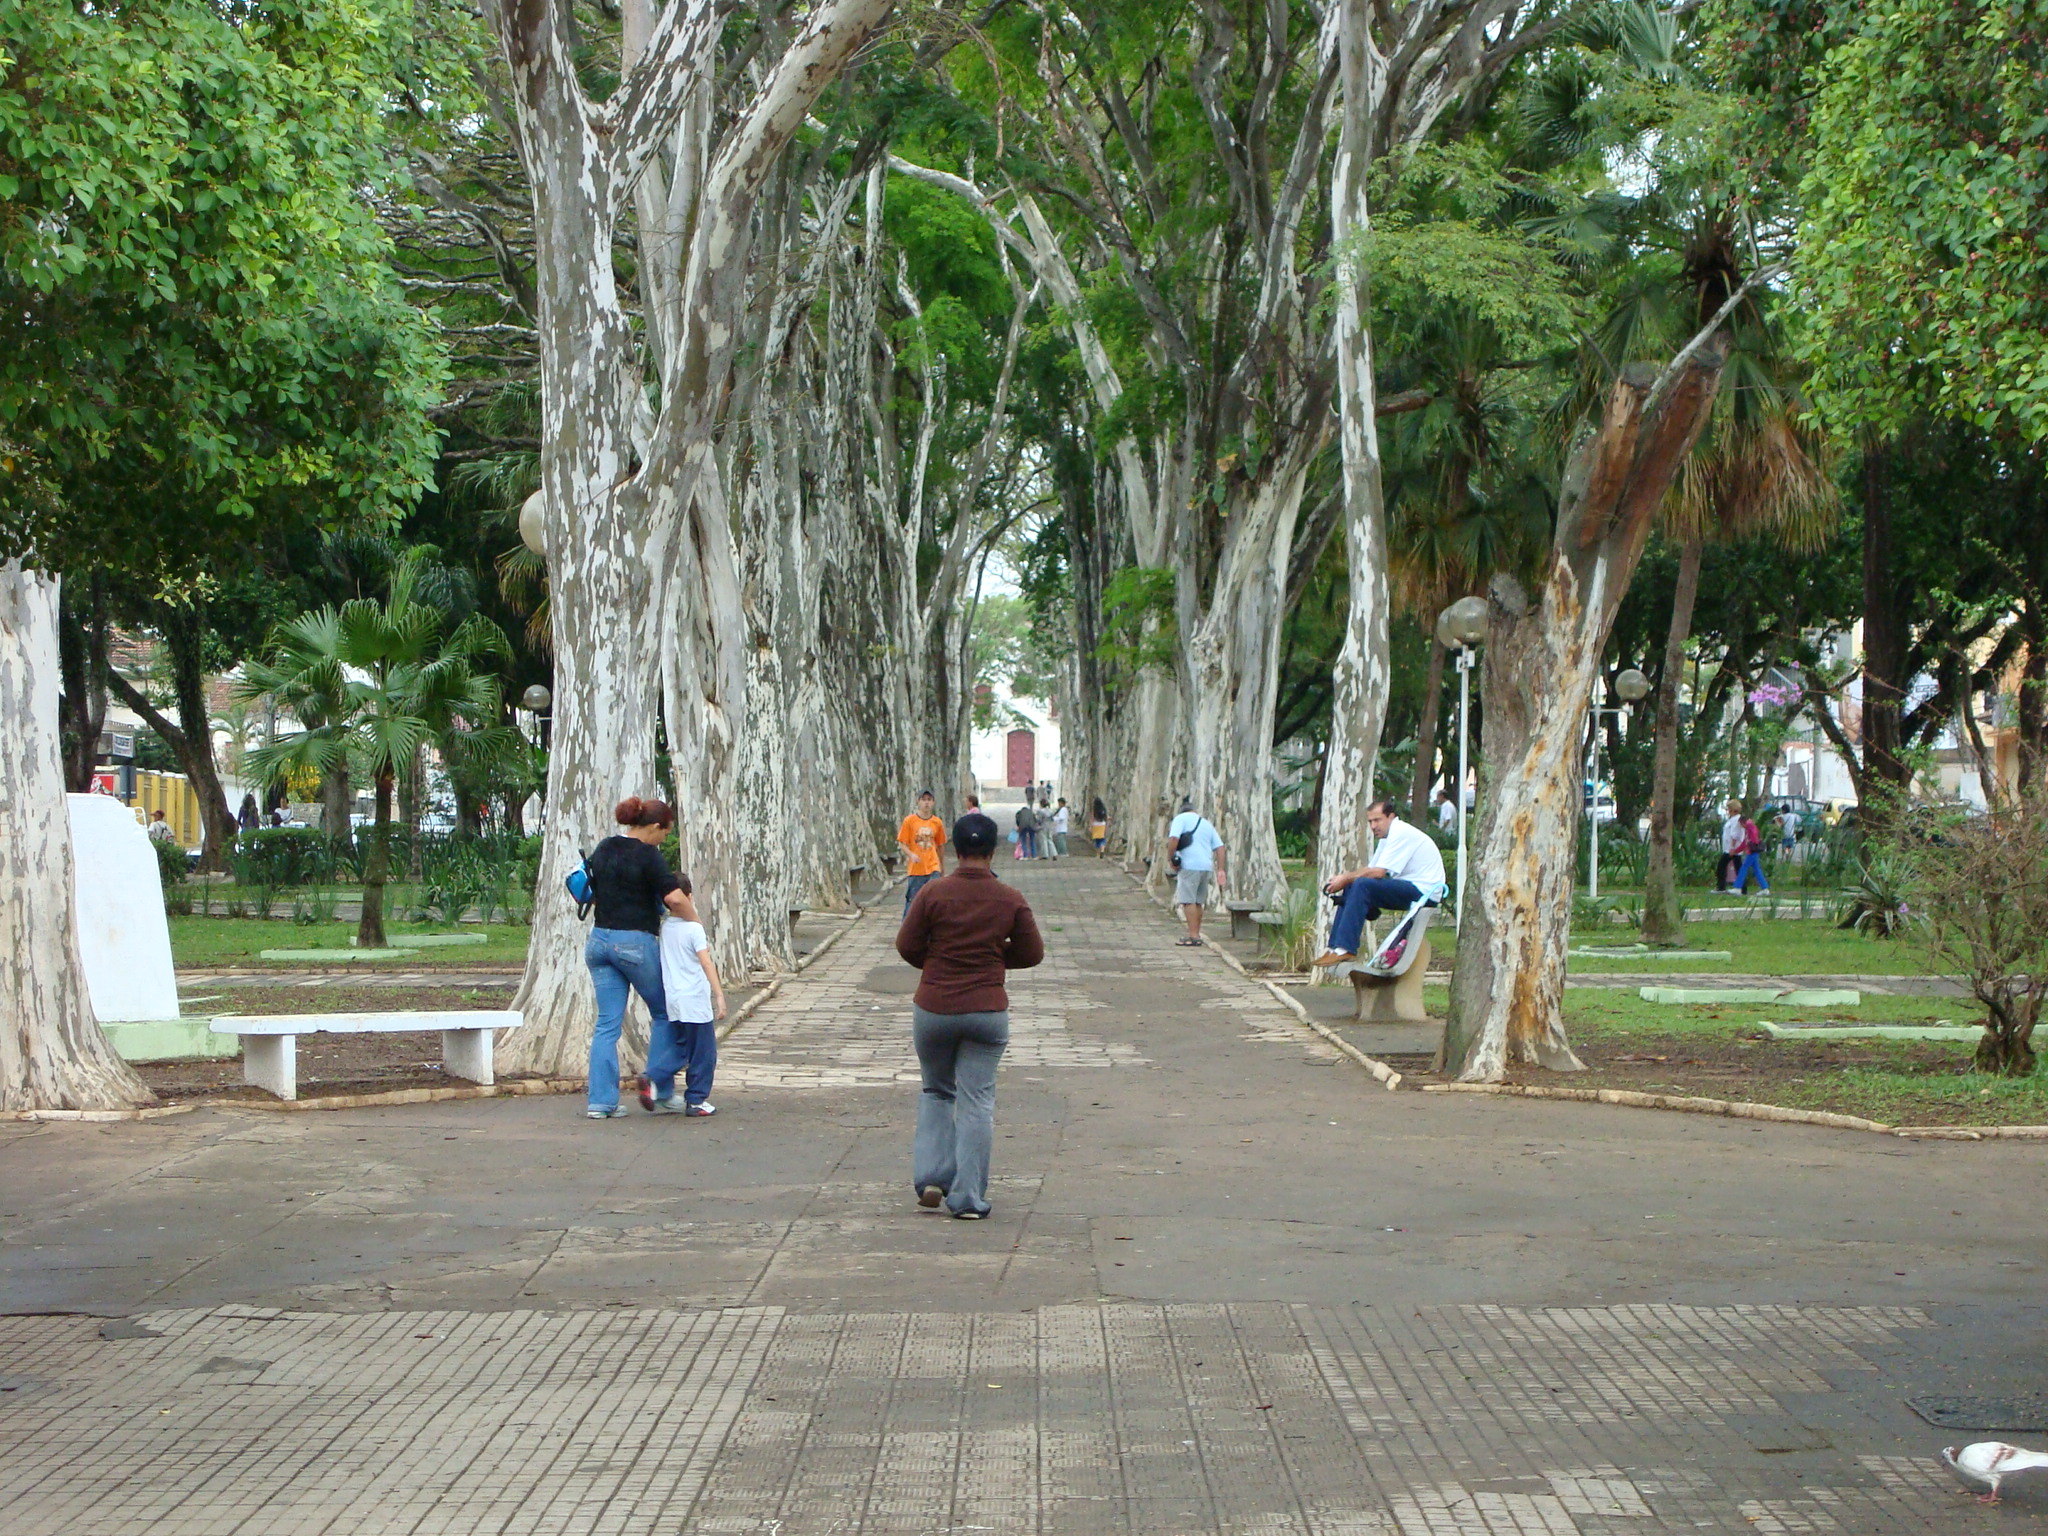
Formiga
Formiga (in Portuguese "ant") is a municipality in central-west Minas Gerais state, Brazil. The population of the municipality (urban and rural) in 2007 is 64,585. The area of the municipality is 1,504 km². It is located in the statistical meso-regio..
Formiga Wikipedia Page
About Our Data
The data on this page is estimated using a number of publicly available tools and resources. It is provided without warranty, and could contain inaccuracies. Use at your own risk.