Categories in Garopaba
Industries
Business Distribution by Industry in Garopaba
| Industry Description | Number of Establishments | Average Age of Business | Average Google Rating |
|---|---|---|---|
| Shopping | 232 | 27 years | 4.4 |
| Other accommodation | 155 | — | 4.4 |
| Restaurants | 107 | — | 4.4 |
| Bed and breakfasts | 100 | — | 4.4 |
| Real estate | 67 | — | 4.4 |
| Hotels and motels | 41 | — | 4.3 |
| Clothing stores | 40 | — | 4.4 |
| All food and beverage | 39 | — | 4.4 |
| Sports and recreation | 36 | — | 4.5 |
| Office supplies and stationery stores | 27 | — | 4.4 |
| Grocery stores and supermarkets | 26 | — | 4.3 |
| Bars, pubs and taverns | 26 | — | 4.5 |
| Bakeries | 23 | — | 4.4 |
| Health and medical | 22 | — | 4.3 |
| Pizza | 21 | — | 4.5 |
| Education | 21 | — | 4.4 |
| Car repair | 19 | — | 4.4 |
| Electronics stores | 19 | — | 4.1 |
| Household appliances and goods | 19 | — | 4.4 |
| Beauty salons | 18 | — | 4.8 |
| Furniture stores | 18 | — | 4.1 |
| Creative arts | 18 | — | 4.6 |
| Latin american restaurants | 17 | — | 4.5 |
| Hardware store | 17 | — | 4.4 |
| Seafood restaurants | 15 | — | 4.5 |
Garopaba Facts
| Area | 56.4 km² |
| Population | 18,654 |
| Male Population | 9,337 (50.1%) |
| Female Population | 9,317 (49.9%) |
| Population change (1975 to 2020) | +365.8% |
| Population change (2000 to 2020) | +63.5% |
| Median Age | 32.8 years (Male: 32.6, Female: 33) |
| Neighborhoods | Centro, Campo D'una, Praia da Ferrugem, Palhocinha, centro |
| Local Time | |
| Timezone | Brasilia Standard Time |
| Lat & Lng | -28.02333, -48.61333 |
| Postal Codes | 88495 |
Map of Garopaba
Interactive Map
Garopaba Population
Years 1975 to 2020
| Data | 1975 | 1990 | 2000 | 2015 | 2020 |
|---|---|---|---|---|---|
| Population | 4,005 | 7,846 | 11,410 | 18,271 | 18,654 |
| Population Density | 71 / km² | 139.2 / km² | 202.4 / km² | 324.1 / km² | 330.9 / km² |
Garopaba Population change from 2000 to 2015
Increase of 60.1% from year 2000 to 2015
| Location | Change since 1975 | Change since 1990 | Change since 2000 |
|---|---|---|---|
| Garopaba | +356.2% | +132.9% | +60.1% |
| Santa Catarina (state) | +119.9% | +51.4% | +25.1% |
| Brazil | +91.5% | +38.1% | +18.2% |
Garopaba Median Age
Median Age: 32.8 years
| Location | Median Age | Median Age (Female) | Median Age (Male) |
|---|---|---|---|
| Garopaba | 32.8 yrs | 33 yrs | 32.6 yrs |
| Santa Catarina (state) | 30.9 yrs | 31.7 yrs | 30.2 yrs |
| Brazil | 29.5 yrs | 30.3 yrs | 28.7 yrs |
Garopaba Population Density
Population Density: 331 / km²
| Location | Population | Area | Density |
|---|---|---|---|
| Garopaba | 18,654 | 56.4 km² | 331 / km² |
| Santa Catarina (state) | 6.9 million | 95,736.2 km² | 72.2 / km² |
| Brazil | 206.1 million | 8,479,487.1 km² | 24.3 / km² |
Garopaba Historical and Projected Population
Estimated Population from 1900 to 2100
- JRC (European Commission's Joint Research Centre) work on the GHS built-up grid
- CIESIN (Center for International Earth Science Information Network)
- [Link] Klein Goldewijk, K., Beusen, A., Doelman, J., and Stehfest, E.: Anthropogenic land use estimates for the Holocene – HYDE 3.2, Earth Syst. Sci. Data, 9, 927–953, https://doi.org/10.5194/essd-9-927-2017, 2017.
Neighborhoods in Garopaba
Percentage of businesses by neighborhood in Garopaba
Price Distribution
Business distribution by price for Garopaba
Human Development Index (HDI)
Statistic composite index of life expectancy, education, and per capita income.
Garopaba CO2 Emissions
Carbon Dioxide (CO2) Emissions Per Capita in Tonnes Per Year
| Location | CO2 Emissions | CO2 Emissions Per Capita | CO2 Emissions Intensity |
|---|---|---|---|
| Garopaba | 40,334 tn | 2.16 tn | 715.5 tons/km² |
| Santa Catarina (state) | 23,862,691 tn | 3.45 tn | 249.3 tons/km² |
| Brazil | 561,829,904 tn | 2.73 tn | 66.3 tons/km² |
| 2013 CO2 emissions (tonnes/year) | 40,334 tn |
| 2013 CO2 emissions (tonnes/year) per capita | 2.16 tn |
| 2013 CO2 emissions intensity (tonnes/km²/year) | 715.5 tons/km² |
Natural Hazards Risk
Relative risk out of 10
| Hazard | Risk Level |
|---|---|
| Flood | High (8) |
* Risk, particularly concerning flood or landslide, may not be for the entire area.
- Dilley, M., R.S. Chen, U. Deichmann, A.L. Lerner-Lam, M. Arnold, J. Agwe, P. Buys, O. Kjekstad, B. Lyon, and G. Yetman. 2005. Natural Disaster Hotspots: A Global Risk Analysis. Washington, D.C.: World Bank. https://doi.org/10.1596/0-8213-5930-4.
- Center for Hazards and Risk Research - CHRR - Columbia University, Center for International Earth Science Information Network - CIESIN - Columbia University. 2005. Global Flood Hazard Frequency and Distribution. Palisades, NY: NASA Socioeconomic Data and Applications Center (SEDAC). https://doi.org/10.7927/H4668B3D.
Recent Nearby Earthquakes
Magnitude 3.0 and greater
| Date▼ | Time↕ | Magnitude↕ | Distance↕ | Depth↕ | Location↕ | Link |
|---|---|---|---|---|---|---|
| 4/13/18 | 12:28 PM | 3.2 | 42.3 km | 10,000 m | 4km NE of Santo Amaro da Imperatriz, Brazil | usgs.gov |
Garopaba
Garopaba is a municipality in the state of Santa Catarina in the South region of Brazil.
Garopaba Wikipedia Page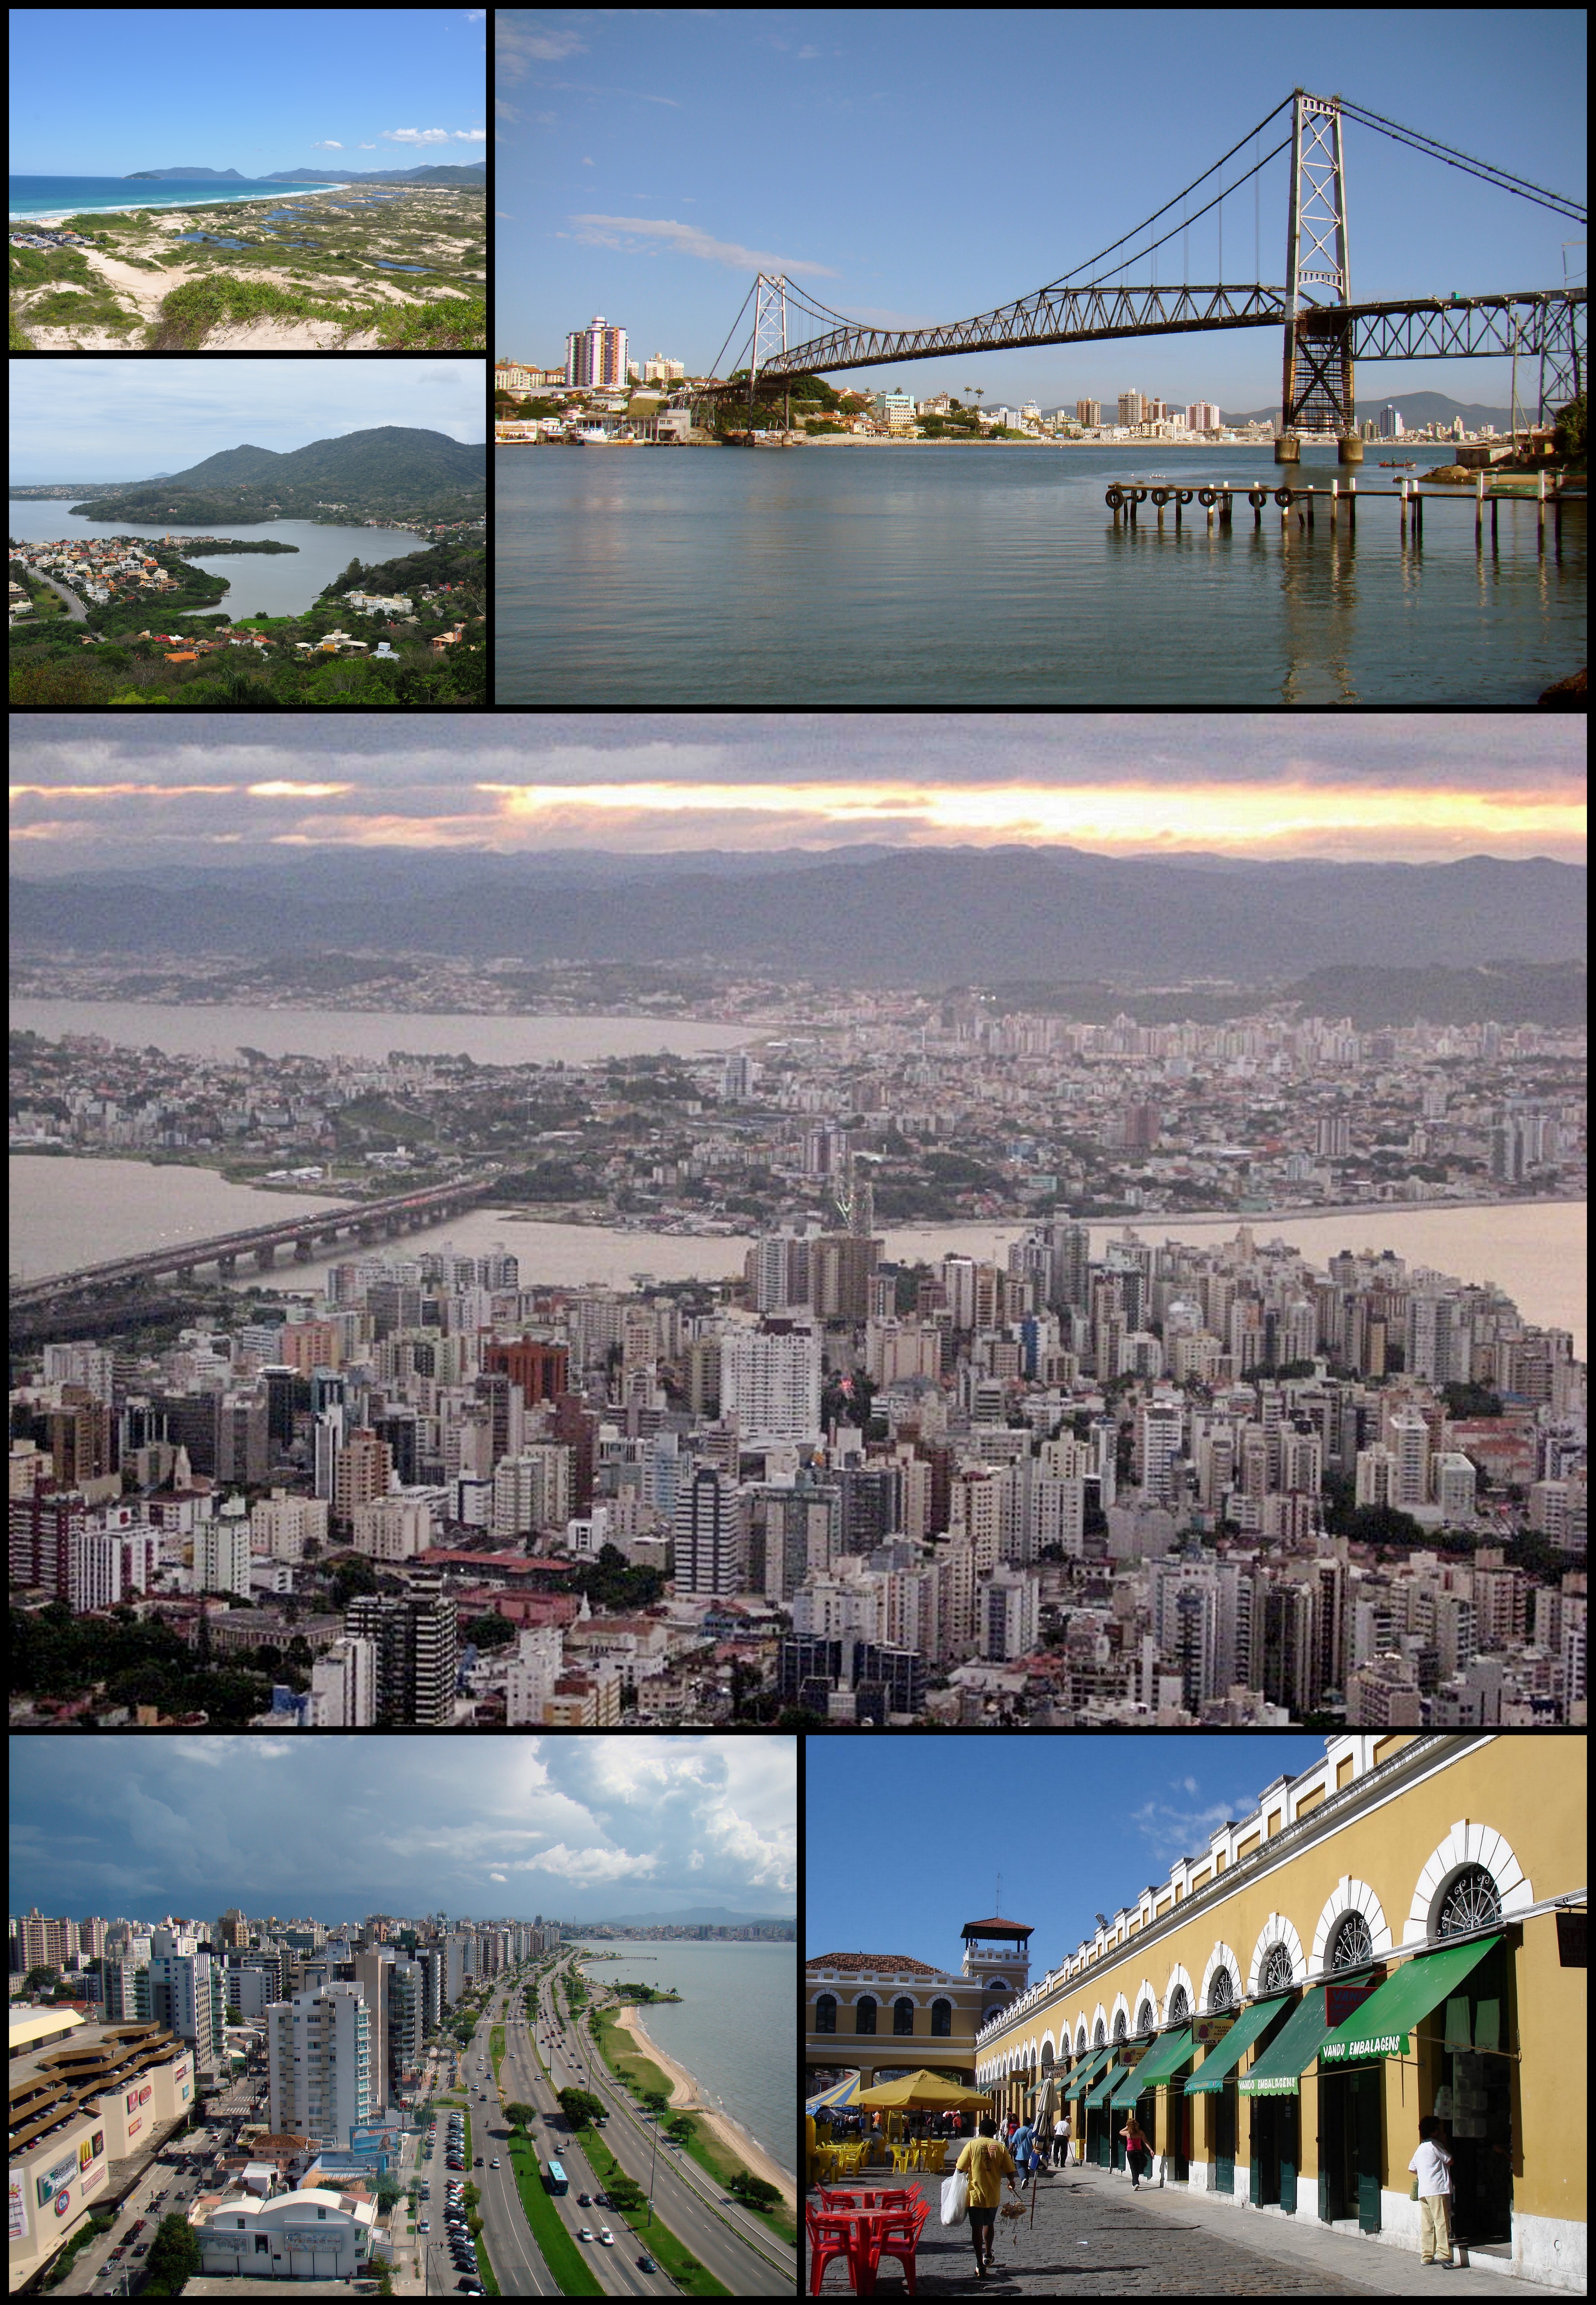

About Our Data
The data on this page is estimated using a number of publicly available tools and resources. It is provided without warranty, and could contain inaccuracies. Use at your own risk.