Categories in Juatuba
Industries
Business Distribution by Industry in Juatuba
| Industry Description | Number of Establishments | Average Age of Business | Average Google Rating |
|---|---|---|---|
| Shopping | 101 | 29 years | 4 |
| Education | 25 | — | 3.9 |
| Restaurants | 25 | — | 4.1 |
| Grocery stores and supermarkets | 18 | — | 4 |
| Public administration | 15 | — | 3.6 |
| All food and beverage | 14 | — | 4 |
| Bars, pubs and taverns | 13 | — | 4 |
| Car repair | 13 | — | 4.3 |
| Gas station | 11 | — | 4.1 |
| Tractors and farm equipment | 11 | — | 4.2 |
| Churches | 9 | — | 4.8 |
| Beauty salons | 9 | — | 5 |
| Pharmacies and drug stores | 9 | — | 4.5 |
| Wholesale of construction supplies | 9 | — | 4.7 |
| Clothing stores | 9 | — | 4 |
| Hardware store | 9 | — | 4 |
| Health and medical | 8 | — | 3.7 |
| Shoe stores | 8 | — | 4.1 |
| Office supplies and stationery stores | 7 | — | 4.5 |
| Religion | 7 | — | 4.9 |
| Other wholesale | 6 | — | 4.5 |
| Construction of buildings | 6 | — | 5 |
| Wholesale of machinery | 6 | — | 4.3 |
| Real estate | 6 | — | 3.7 |
| Loan companies | 6 | — | 4 |
Juatuba Facts
| Area | 40.0 km² |
| Population | 24,434 |
| Male Population | 12,335 (50.5%) |
| Female Population | 12,099 (49.5%) |
| Population change (1975 to 2020) | +344.5% |
| Population change (2000 to 2020) | +62.8% |
| Median Age | 28.6 years (Male: 28.2, Female: 29.1) |
| Neighborhoods | Centro, Centro de Varginha, Bairro Cidade Nova, Tatuapé, Bairro Canaã |
| Local Time | |
| Timezone | Brasilia Standard Time |
| Lat & Lng | -19.95194, -44.34278 |
| Postal Codes | 35675 |
Map of Juatuba
Interactive Map
Juatuba Population
Years 1975 to 2020
| Data | 1975 | 1990 | 2000 | 2015 | 2020 |
|---|---|---|---|---|---|
| Population | 5,497 | 10,515 | 15,010 | 23,401 | 24,434 |
| Population Density | 137.4 / km² | 262.9 / km² | 375.3 / km² | 585 / km² | 610.9 / km² |
Juatuba Population change from 2000 to 2015
Increase of 55.9% from year 2000 to 2015
| Location | Change since 1975 | Change since 1990 | Change since 2000 |
|---|---|---|---|
| Juatuba | +325.7% | +122.5% | +55.9% |
| Minas Gerais | +76.6% | +30.1% | +13.6% |
| Brazil | +91.5% | +38.1% | +18.2% |
Juatuba Median Age
Median Age: 28.6 years
| Location | Median Age | Median Age (Female) | Median Age (Male) |
|---|---|---|---|
| Juatuba | 28.6 yrs | 29.1 yrs | 28.2 yrs |
| Minas Gerais | 30.8 yrs | 31.6 yrs | 30 yrs |
| Brazil | 29.5 yrs | 30.3 yrs | 28.7 yrs |
Juatuba Population Density
Population Density: 611 / km²
| Location | Population | Area | Density |
|---|---|---|---|
| Juatuba | 24,434 | 40 km² | 611 / km² |
| Minas Gerais | 21 million | 586,522.1 km² | 35.9 / km² |
| Brazil | 206.1 million | 8,479,487.1 km² | 24.3 / km² |
Juatuba Historical and Projected Population
Estimated Population from 1880 to 2100
- JRC (European Commission's Joint Research Centre) work on the GHS built-up grid
- CIESIN (Center for International Earth Science Information Network)
- [Link] Klein Goldewijk, K., Beusen, A., Doelman, J., and Stehfest, E.: Anthropogenic land use estimates for the Holocene – HYDE 3.2, Earth Syst. Sci. Data, 9, 927–953, https://doi.org/10.5194/essd-9-927-2017, 2017.
Neighborhoods in Juatuba
Percentage of businesses by neighborhood in Juatuba
Price Distribution
Business distribution by price for Juatuba
Human Development Index (HDI)
Statistic composite index of life expectancy, education, and per capita income.
Juatuba CO2 Emissions
Carbon Dioxide (CO2) Emissions Per Capita in Tonnes Per Year
| Location | CO2 Emissions | CO2 Emissions Per Capita | CO2 Emissions Intensity |
|---|---|---|---|
| Juatuba | 79,608 tn | 3.26 tn | 1,990.2 tons/km² |
| Minas Gerais | 61,830,304 tn | 2.94 tn | 105.4 tons/km² |
| Brazil | 561,829,904 tn | 2.73 tn | 66.3 tons/km² |
| 2013 CO2 emissions (tonnes/year) | 79,608 tn |
| 2013 CO2 emissions (tonnes/year) per capita | 3.26 tn |
| 2013 CO2 emissions intensity (tonnes/km²/year) | 1,990.2 tons/km² |
Natural Hazards Risk
Relative risk out of 10
| Hazard | Risk Level |
|---|---|
| Drought | High (7.3) |
| Flood | High (9) |
* Risk, particularly concerning flood or landslide, may not be for the entire area.
- Dilley, M., R.S. Chen, U. Deichmann, A.L. Lerner-Lam, M. Arnold, J. Agwe, P. Buys, O. Kjekstad, B. Lyon, and G. Yetman. 2005. Natural Disaster Hotspots: A Global Risk Analysis. Washington, D.C.: World Bank. https://doi.org/10.1596/0-8213-5930-4.
- Center for Hazards and Risk Research - CHRR - Columbia University, Center for International Earth Science Information Network - CIESIN - Columbia University, and International Research Institute for Climate and Society - IRI - Columbia University. 2005. Global Drought Hazard Frequency and Distribution. Palisades, NY: NASA Socioeconomic Data and Applications Center (SEDAC). https://doi.org/10.7927/H4VX0DFT.
- Center for Hazards and Risk Research - CHRR - Columbia University, Center for International Earth Science Information Network - CIESIN - Columbia University. 2005. Global Flood Hazard Frequency and Distribution. Palisades, NY: NASA Socioeconomic Data and Applications Center (SEDAC). https://doi.org/10.7927/H4668B3D.
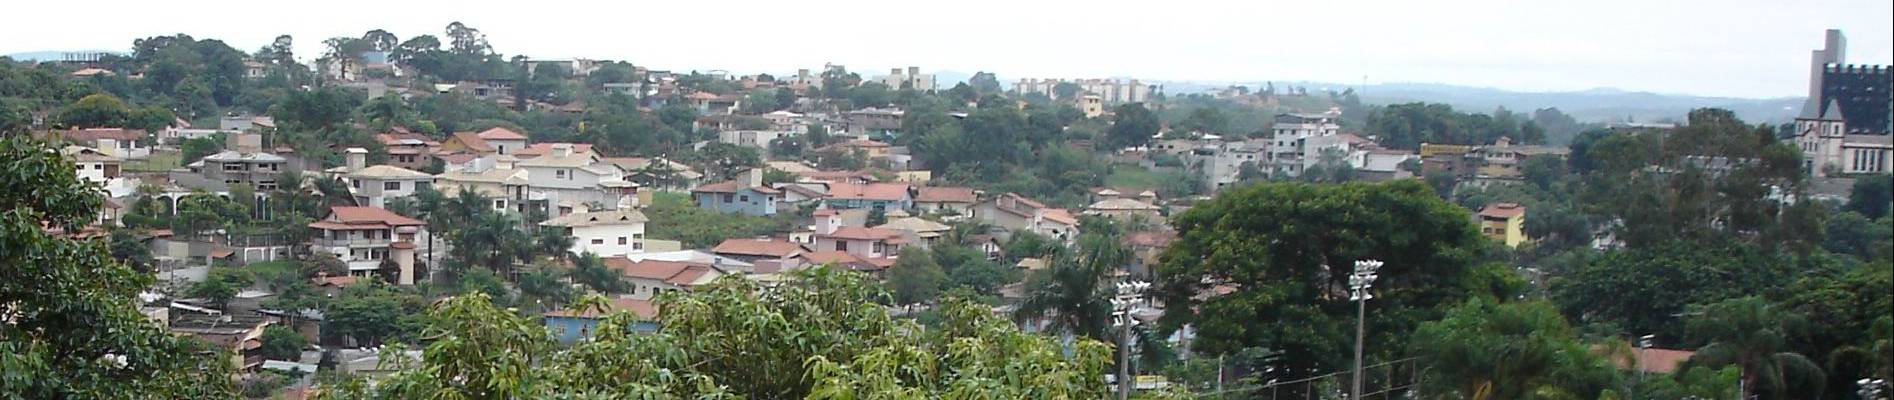
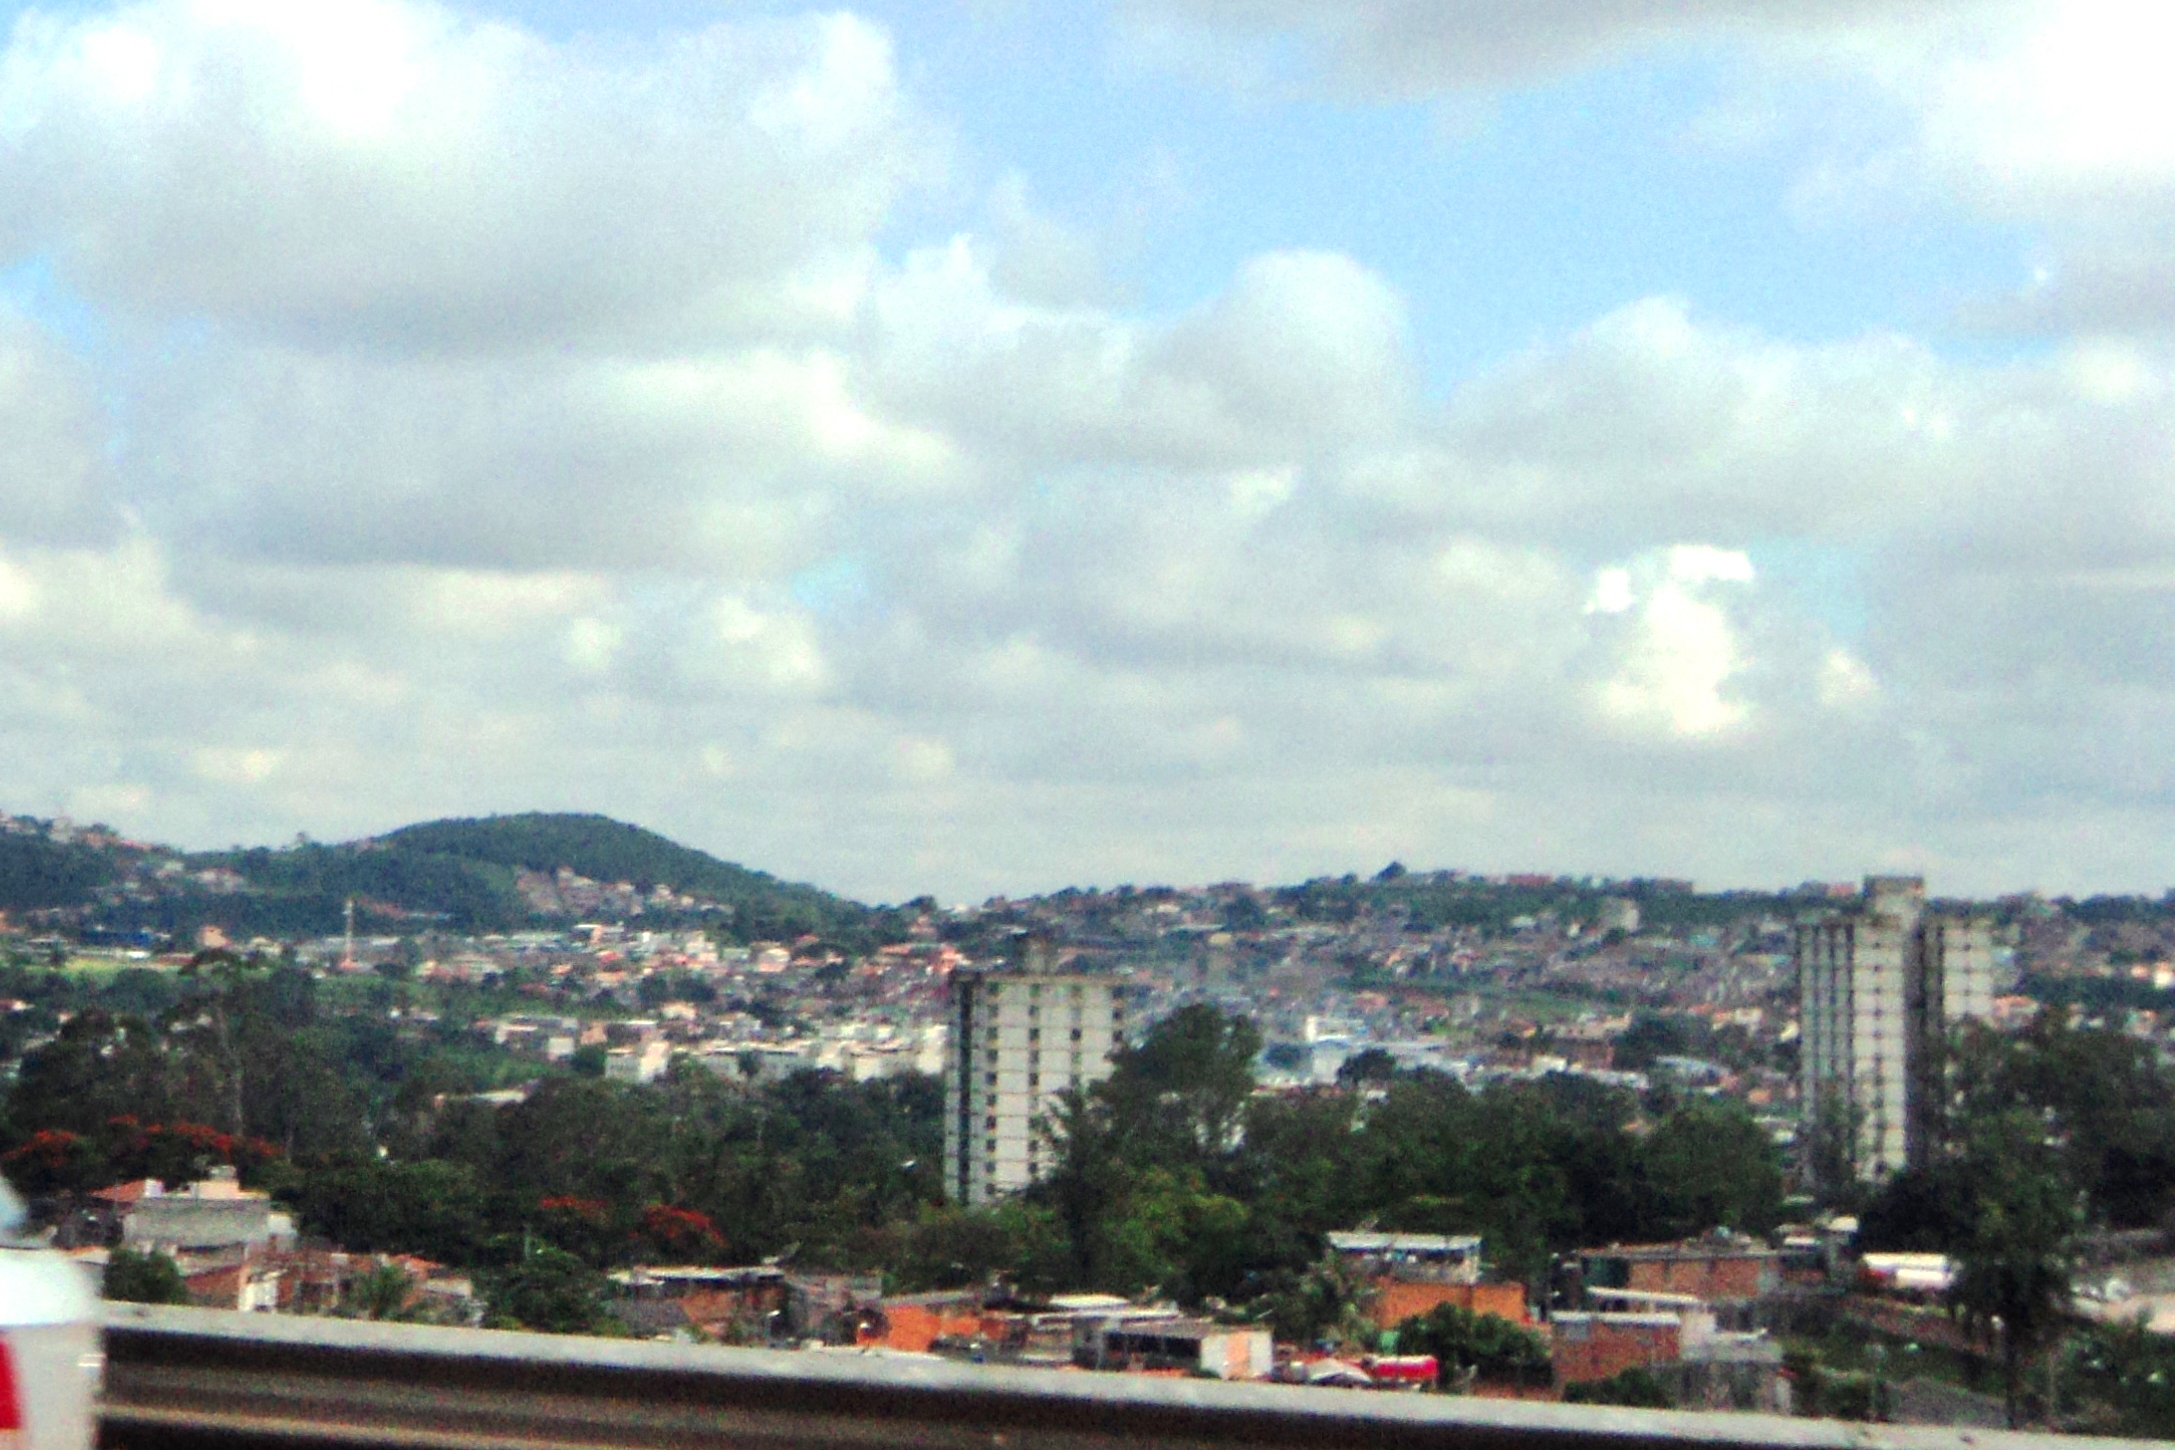
Juatuba
Juatuba is a Brazilian municipality located in the state of Minas Gerais. The city belongs to the mesoregion Metropolitana de Belo Horizonte and to the microregion of Belo Horizonte.
Juatuba Wikipedia Page
About Our Data
The data on this page is estimated using a number of publicly available tools and resources. It is provided without warranty, and could contain inaccuracies. Use at your own risk.