Mamonas Facts
| Area | 4.6 km² |
| Population | 2,910 |
| Male Population | 1,450 (49.8%) |
| Female Population | 1,460 (50.2%) |
| Population change (1975 to 2020) | +46.3% |
| Population change (2000 to 2020) | +6.6% |
| Median Age | 32.1 years (Male: 31.5, Female: 32.9) |
| Neighborhoods | Centro |
| Local Time | |
| Timezone | Brasilia Standard Time |
| Lat & Lng | -15.05028, -42.94944 |
| Postal Codes | 39516 |
Map of Mamonas
Interactive Map
Mamonas Population
Years 1975 to 2020
| Data | 1975 | 1990 | 2000 | 2015 | 2020 |
|---|---|---|---|---|---|
| Population | 1,989 | 2,518 | 2,731 | 2,818 | 2,910 |
| Population Density | 435.9 / km² | 551.9 / km² | 598.6 / km² | 617.6 / km² | 637.8 / km² |
Mamonas Population change from 2000 to 2015
Increase of 3.2% from year 2000 to 2015
| Location | Change since 1975 | Change since 1990 | Change since 2000 |
|---|---|---|---|
| Mamonas | +41.7% | +11.9% | +3.2% |
| Minas Gerais | +76.6% | +30.1% | +13.6% |
| Brazil | +91.5% | +38.1% | +18.2% |
Mamonas Median Age
Median Age: 32.1 years
| Location | Median Age | Median Age (Female) | Median Age (Male) |
|---|---|---|---|
| Mamonas | 32.1 yrs | 32.9 yrs | 31.5 yrs |
| Minas Gerais | 30.8 yrs | 31.6 yrs | 30 yrs |
| Brazil | 29.5 yrs | 30.3 yrs | 28.7 yrs |
Mamonas Population Density
Population Density: 638 / km²
| Location | Population | Area | Density |
|---|---|---|---|
| Mamonas | 2,910 | 4.563 km² | 638 / km² |
| Minas Gerais | 21 million | 586,522.1 km² | 35.9 / km² |
| Brazil | 206.1 million | 8,479,487.1 km² | 24.3 / km² |
Mamonas Historical and Projected Population
Estimated Population from 1500 to 2100
- JRC (European Commission's Joint Research Centre) work on the GHS built-up grid
- CIESIN (Center for International Earth Science Information Network)
- [Link] Klein Goldewijk, K., Beusen, A., Doelman, J., and Stehfest, E.: Anthropogenic land use estimates for the Holocene – HYDE 3.2, Earth Syst. Sci. Data, 9, 927–953, https://doi.org/10.5194/essd-9-927-2017, 2017.
Human Development Index (HDI)
Statistic composite index of life expectancy, education, and per capita income.
Mamonas CO2 Emissions
Carbon Dioxide (CO2) Emissions Per Capita in Tonnes Per Year
| Location | CO2 Emissions | CO2 Emissions Per Capita | CO2 Emissions Intensity |
|---|---|---|---|
| Mamonas | 6,456 tn | 2.22 tn | 1,415 tons/km² |
| Minas Gerais | 61,830,304 tn | 2.94 tn | 105.4 tons/km² |
| Brazil | 561,829,904 tn | 2.73 tn | 66.3 tons/km² |
| 2013 CO2 emissions (tonnes/year) | 6,456 tn |
| 2013 CO2 emissions (tonnes/year) per capita | 2.22 tn |
| 2013 CO2 emissions intensity (tonnes/km²/year) | 1,415 tons/km² |
Natural Hazards Risk
Relative risk out of 10
| Hazard | Risk Level |
|---|---|
| Drought | High (9) |
* Risk, particularly concerning flood or landslide, may not be for the entire area.
- Dilley, M., R.S. Chen, U. Deichmann, A.L. Lerner-Lam, M. Arnold, J. Agwe, P. Buys, O. Kjekstad, B. Lyon, and G. Yetman. 2005. Natural Disaster Hotspots: A Global Risk Analysis. Washington, D.C.: World Bank. https://doi.org/10.1596/0-8213-5930-4.
- Center for Hazards and Risk Research - CHRR - Columbia University, Center for International Earth Science Information Network - CIESIN - Columbia University, and International Research Institute for Climate and Society - IRI - Columbia University. 2005. Global Drought Hazard Frequency and Distribution. Palisades, NY: NASA Socioeconomic Data and Applications Center (SEDAC). https://doi.org/10.7927/H4VX0DFT.
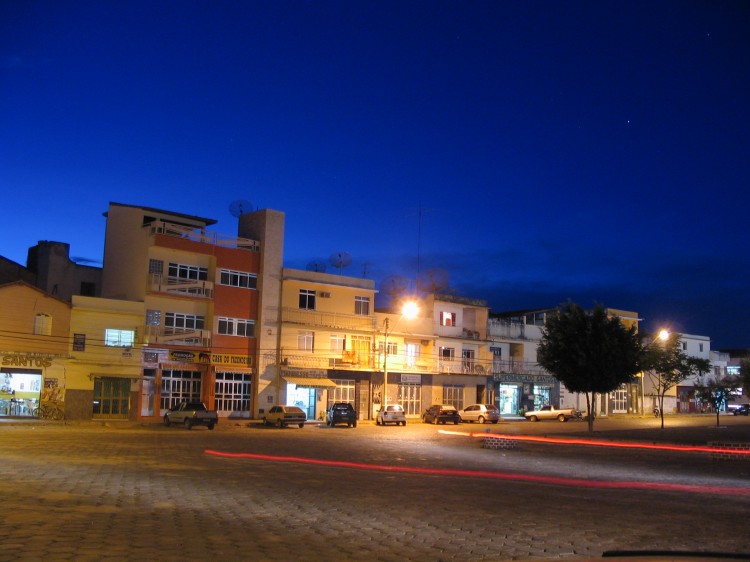
Mamonas
Mamomas can refer to municipalities in Bahia, Piauí, and Minas Gerais. For the municipality in Piauí see Manonas, Piauí; for the municipality in Bahia see Mamonas, Bahia. This article refers to Mamonas, Minas Gerais. is a municipality in the north o..
Mamonas Wikipedia Page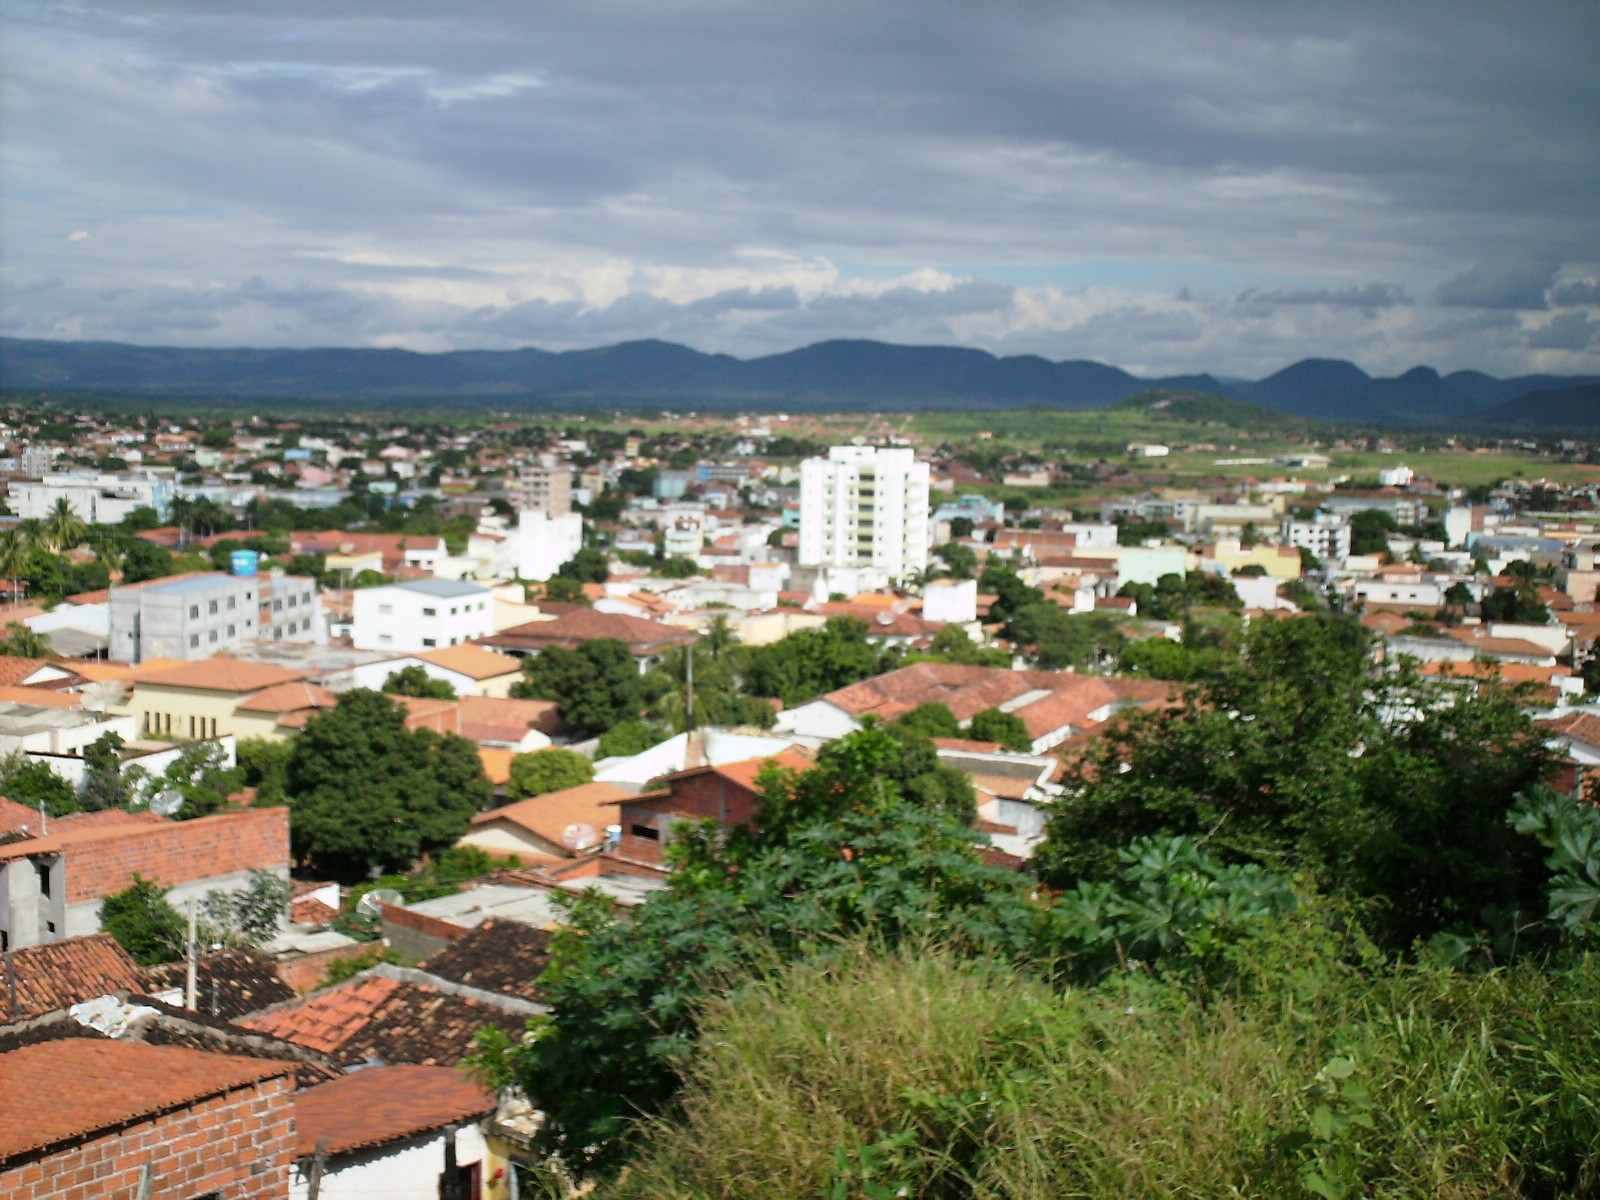

About Our Data
The data on this page is estimated using a number of publicly available tools and resources. It is provided without warranty, and could contain inaccuracies. Use at your own risk.