Categories in Nova Lima
Industries
Business Distribution by Industry in Nova Lima
| Industry Description | Number of Establishments | Average Age of Business |
|---|---|---|
| Corporate management | 705 | 26 years |
| Restaurants | 685 | 21 years |
| Shopping | 662 | 28 years |
| Real estate | 426 | 25 years |
| Beauty salons | 278 | 16 years |
| Clothing stores | 259 | 23 years |
| Construction of buildings | 257 | 29 years |
| Bars, pubs and taverns | 253 | — |
| Health and medical | 252 | — |
| Car repair | 222 | — |
| Lawyers legal | 210 | 23 years |
| Apartments | 199 | — |
| Wholesale of construction supplies | 197 | 27 years |
| Education | 193 | 27 years |
| Grocery stores and supermarkets | 181 | 28 years |
| Electronics stores | 170 | 24 years |
Nova Lima Facts
| Area | 227.5 km² |
| Population | 90,582 |
| Male Population | 43,671 (48.2%) |
| Female Population | 46,911 (51.8%) |
| Population change (1975 to 2020) | +217.7% |
| Population change (2000 to 2020) | +39.3% |
| Median Age | 31.9 years (Male: 31, Female: 32.7) |
| GDP per capita (PPP) | $14,655 (2022) |
| Neighborhoods | Jardim Canada, Vila da Serra, Centro, Vale do Sereno, Rosário |
| Local Time | |
| Timezone | Brasilia Standard Time |
| Lat & Lng | -19.98556, -43.84667 |
| Postal Codes | 32185, 34000, 34535, 57271 |
Map of Nova Lima
Interactive Map
Nova Lima Population
Years 1975 to 2030
| Data | 1975 | 1990 | 2000 | 2015 | 2020 | 2025* | 2030* |
|---|---|---|---|---|---|---|---|
| Population | 28,515 | 48,962 | 65,038 | 91,018 | 90,582 | 93,648 | 96,395 |
| Population Density | 125.3 / km² | 215.2 / km² | 285.9 / km² | 400.1 / km² | 398.2 / km² | 411.6 / km² | 423.7 / km² |
Nova Lima Population change from 2000 to 2020
Increase of 39.3% from year 2000 to 2020
| Location | Change since 1975 | Change since 1990 | Change since 2000 |
|---|---|---|---|
| Nova Lima | +217.7% | +85% | +39.3% |
| Minas Gerais | — | — | — |
| Brazil | — | — | — |
Nova Lima Median Age
Median Age: 31.9 years
| Location | Median Age | Median Age (Female) | Median Age (Male) |
|---|---|---|---|
| Nova Lima | 31.9 yrs | 32.7 yrs | 31 yrs |
| Minas Gerais | 30.8 yrs | 31.6 yrs | 30 yrs |
| Brazil | 29.5 yrs | 30.3 yrs | 28.7 yrs |
Nova Lima Population Density
Population Density: 398 / km²
| Location | Population | Area | Density |
|---|---|---|---|
| Nova Lima | 90,582 | 227.5 km² | 398 / km² |
| Minas Gerais | 21 million | 586,522.1 km² | 35.9 / km² |
| Brazil | 206.1 million | 8,479,487.1 km² | 24.3 / km² |
Nova Lima Historical and Projected Population
Estimated Population from 1850 to 2100
- JRC (European Commission's Joint Research Centre) work on the GHS built-up grid
- CIESIN (Center for International Earth Science Information Network)
- [Link] Klein Goldewijk, K., Beusen, A., Doelman, J., and Stehfest, E.: Anthropogenic land use estimates for the Holocene – HYDE 3.2, Earth Syst. Sci. Data, 9, 927–953, https://doi.org/10.5194/essd-9-927-2017, 2017.
Neighborhoods in Nova Lima
Percentage of businesses by neighborhood in Nova Lima
Price Distribution
Business distribution by price for Nova Lima
Human Development Index (HDI)
Statistic composite index of life expectancy, education, and per capita income.
Nova Lima Gross Domestic Product (GDP)
GDP per capita, PPP (constant 2017 international $)
| Data | 1990 | 1995 | 2000 | 2005 | 2010 | 2015 | 2020 | 2022 |
|---|---|---|---|---|---|---|---|---|
| GDP per capita | $6,812 | $8,259 | $7,301 | $8,477 | $15,838 | $12,513 | $14,181 | $14,655 |
| Total GDP | $407.8M | $582.6M | $606.9M | $764.8M | $1.5B | $1.3B | $1.6B | $1.6B |
Nova Lima CO2 Emissions
Carbon Dioxide (CO2) Emissions Per Capita in Tonnes Per Year
| Location | CO2 Emissions | CO2 Emissions Per Capita | CO2 Emissions Intensity |
|---|---|---|---|
| Nova Lima | 450,491 tn | 4.97 tn | 1,980.2 tons/km² |
| Minas Gerais | 61,830,304 tn | 2.94 tn | 105.4 tons/km² |
| Brazil | 561,829,904 tn | 2.73 tn | 66.3 tons/km² |
| 2013 CO2 emissions (tonnes/year) | 450,491 tn |
| 2013 CO2 emissions (tonnes/year) per capita | 4.97 tn |
| 2013 CO2 emissions intensity (tonnes/km²/year) | 1,980.2 tons/km² |
Natural Hazards Risk
Relative risk out of 10
| Hazard | Risk Level |
|---|---|
| Drought | Medium (3.8) |
| Flood | High (9) |
* Risk, particularly concerning flood or landslide, may not be for the entire area.
- Dilley, M., R.S. Chen, U. Deichmann, A.L. Lerner-Lam, M. Arnold, J. Agwe, P. Buys, O. Kjekstad, B. Lyon, and G. Yetman. 2005. Natural Disaster Hotspots: A Global Risk Analysis. Washington, D.C.: World Bank. https://doi.org/10.1596/0-8213-5930-4.
- Center for Hazards and Risk Research - CHRR - Columbia University, Center for International Earth Science Information Network - CIESIN - Columbia University, and International Research Institute for Climate and Society - IRI - Columbia University. 2005. Global Drought Hazard Frequency and Distribution. Palisades, NY: NASA Socioeconomic Data and Applications Center (SEDAC). https://doi.org/10.7927/H4VX0DFT.
- Center for Hazards and Risk Research - CHRR - Columbia University, Center for International Earth Science Information Network - CIESIN - Columbia University. 2005. Global Flood Hazard Frequency and Distribution. Palisades, NY: NASA Socioeconomic Data and Applications Center (SEDAC). https://doi.org/10.7927/H4668B3D.
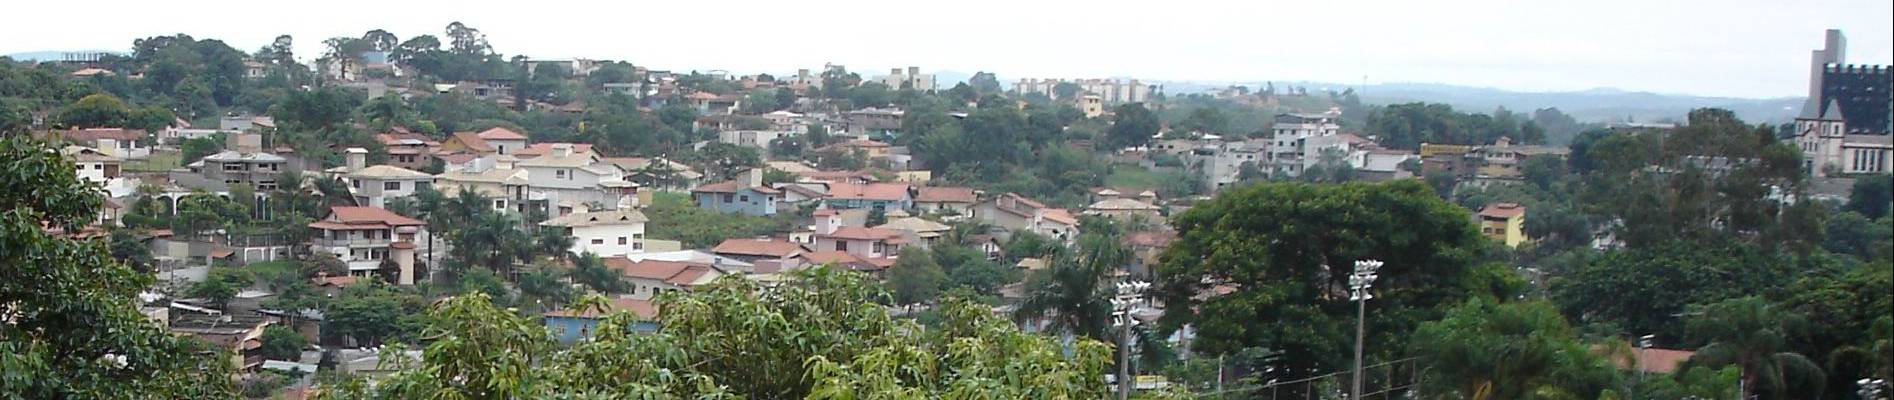
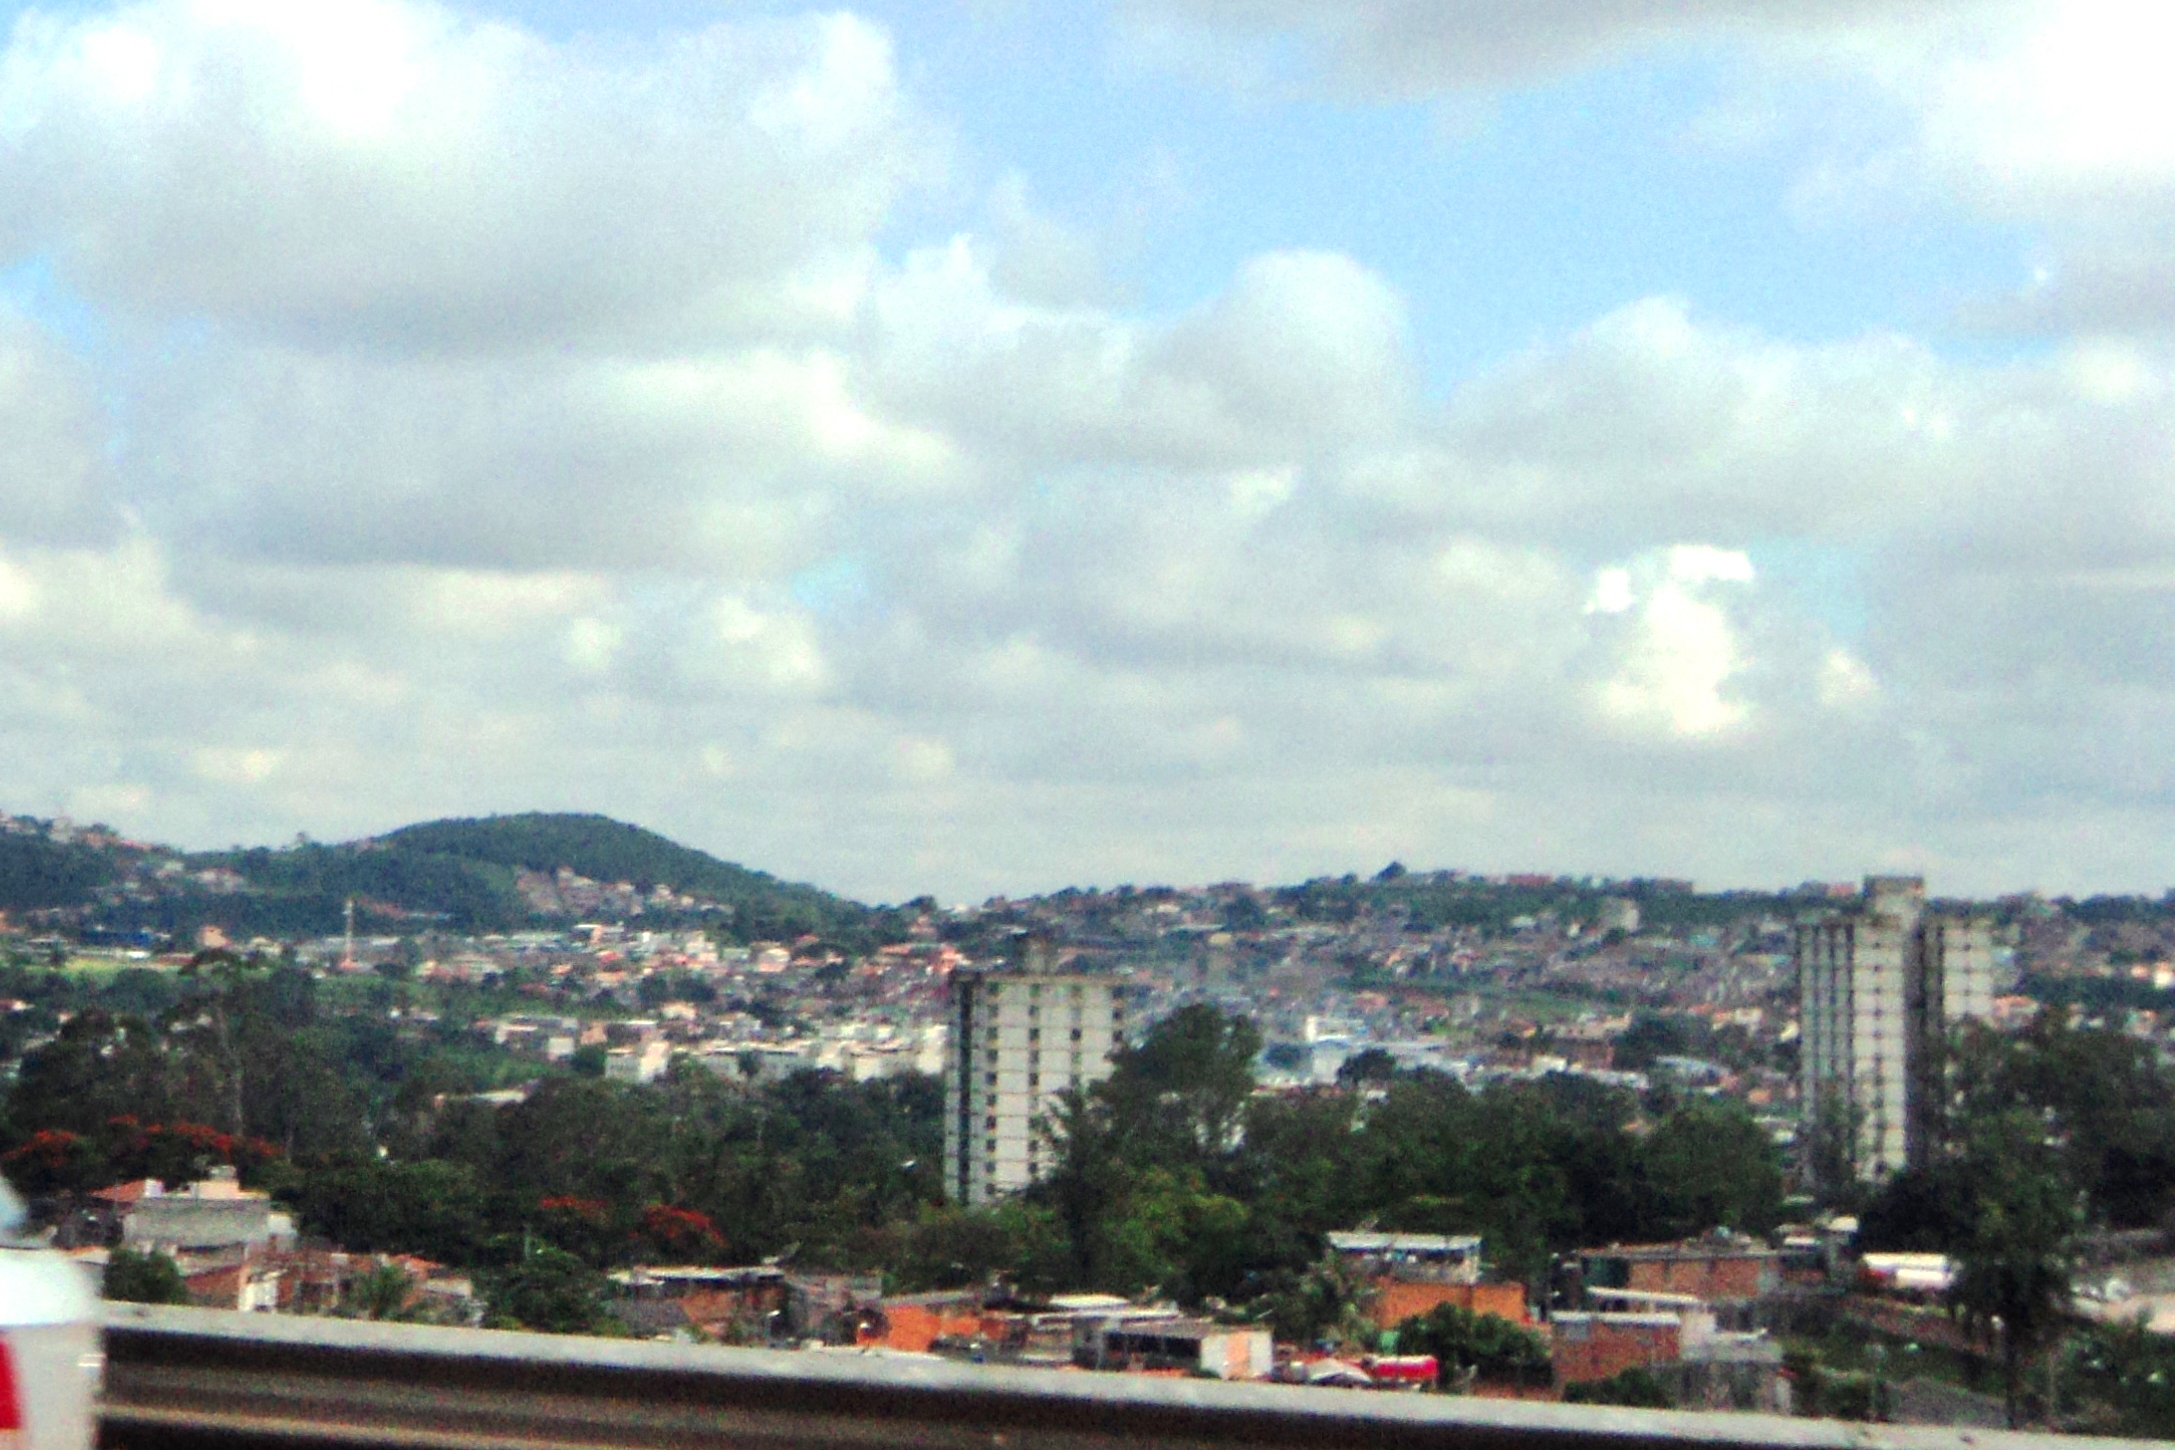
Nova Lima
Nova Lima is a municipality of about 87,000 people located about 20 to the south-east of Belo Horizonte, the capital of the south-east Brazilian state of Minas Gerais. Historically, the city was known as known as Campos de Congonhas, Congonhas de Sab..
Nova Lima Wikipedia Page

About Our Data
The data on this page is estimated using a number of publicly available tools and resources. It is provided without warranty, and could contain inaccuracies. Use at your own risk.