Categories in Quevedos
Quevedos Facts
| Area | 2.0 km² |
| Population | 902 |
| Male Population | 452 (50.1%) |
| Female Population | 450 (49.9%) |
| Population change (1975 to 2020) | +33.8% |
| Population change (2000 to 2020) | +3.0% |
| Median Age | 32.6 years (Male: 33.2, Female: 32) |
| Neighborhoods | Vila Gaucha |
| Local Time | |
| Timezone | Brasilia Standard Time |
| Lat & Lng | -29.35250, -54.07167 |
| Postal Codes | 98140 |
Map of Quevedos
Interactive Map
Quevedos Population
Years 1975 to 2020
| Data | 1975 | 1990 | 2000 | 2015 | 2020 |
|---|---|---|---|---|---|
| Population | 674 | 826 | 876 | 875 | 902 |
| Population Density | 337 / km² | 413 / km² | 438 / km² | 437.5 / km² | 451 / km² |
Quevedos Population change from 2000 to 2015
Decrease of 0.1% from year 2000 to 2015
| Location | Change since 1975 | Change since 1990 | Change since 2000 |
|---|---|---|---|
| Quevedos | +29.8% | +5.9% | -0.1% |
| Rio Grande do Sul | +49.1% | +17.1% | +6.6% |
| Brazil | +91.5% | +38.1% | +18.2% |
Quevedos Median Age
Median Age: 32.6 years
| Location | Median Age | Median Age (Female) | Median Age (Male) |
|---|---|---|---|
| Quevedos | 32.6 yrs | 32 yrs | 33.2 yrs |
| Rio Grande do Sul | 32.9 yrs | 34.1 yrs | 31.8 yrs |
| Brazil | 29.5 yrs | 30.3 yrs | 28.7 yrs |
Quevedos Population Density
Population Density: 451 / km²
| Location | Population | Area | Density |
|---|---|---|---|
| Quevedos | 902 | 2 km² | 451 / km² |
| Rio Grande do Sul | 11.2 million | 268,766.5 km² | 41.7 / km² |
| Brazil | 206.1 million | 8,479,487.1 km² | 24.3 / km² |
Quevedos Historical and Projected Population
Estimated Population from 0 to 2100
- JRC (European Commission's Joint Research Centre) work on the GHS built-up grid
- CIESIN (Center for International Earth Science Information Network)
- [Link] Klein Goldewijk, K., Beusen, A., Doelman, J., and Stehfest, E.: Anthropogenic land use estimates for the Holocene – HYDE 3.2, Earth Syst. Sci. Data, 9, 927–953, https://doi.org/10.5194/essd-9-927-2017, 2017.
Human Development Index (HDI)
Statistic composite index of life expectancy, education, and per capita income.
Quevedos CO2 Emissions
Carbon Dioxide (CO2) Emissions Per Capita in Tonnes Per Year
| Location | CO2 Emissions | CO2 Emissions Per Capita | CO2 Emissions Intensity |
|---|---|---|---|
| Quevedos | 2,750 tn | 3.05 tn | 1,374.8 tons/km² |
| Rio Grande do Sul | 37,971,816 tn | 3.39 tn | 141.3 tons/km² |
| Brazil | 561,829,904 tn | 2.73 tn | 66.3 tons/km² |
| 2013 CO2 emissions (tonnes/year) | 2,750 tn |
| 2013 CO2 emissions (tonnes/year) per capita | 3.05 tn |
| 2013 CO2 emissions intensity (tonnes/km²/year) | 1,374.8 tons/km² |
Natural Hazards Risk
Relative risk out of 10
| Hazard | Risk Level |
|---|---|
| Flood | Medium (7) |
* Risk, particularly concerning flood or landslide, may not be for the entire area.
- Dilley, M., R.S. Chen, U. Deichmann, A.L. Lerner-Lam, M. Arnold, J. Agwe, P. Buys, O. Kjekstad, B. Lyon, and G. Yetman. 2005. Natural Disaster Hotspots: A Global Risk Analysis. Washington, D.C.: World Bank. https://doi.org/10.1596/0-8213-5930-4.
- Center for Hazards and Risk Research - CHRR - Columbia University, Center for International Earth Science Information Network - CIESIN - Columbia University. 2005. Global Flood Hazard Frequency and Distribution. Palisades, NY: NASA Socioeconomic Data and Applications Center (SEDAC). https://doi.org/10.7927/H4668B3D.
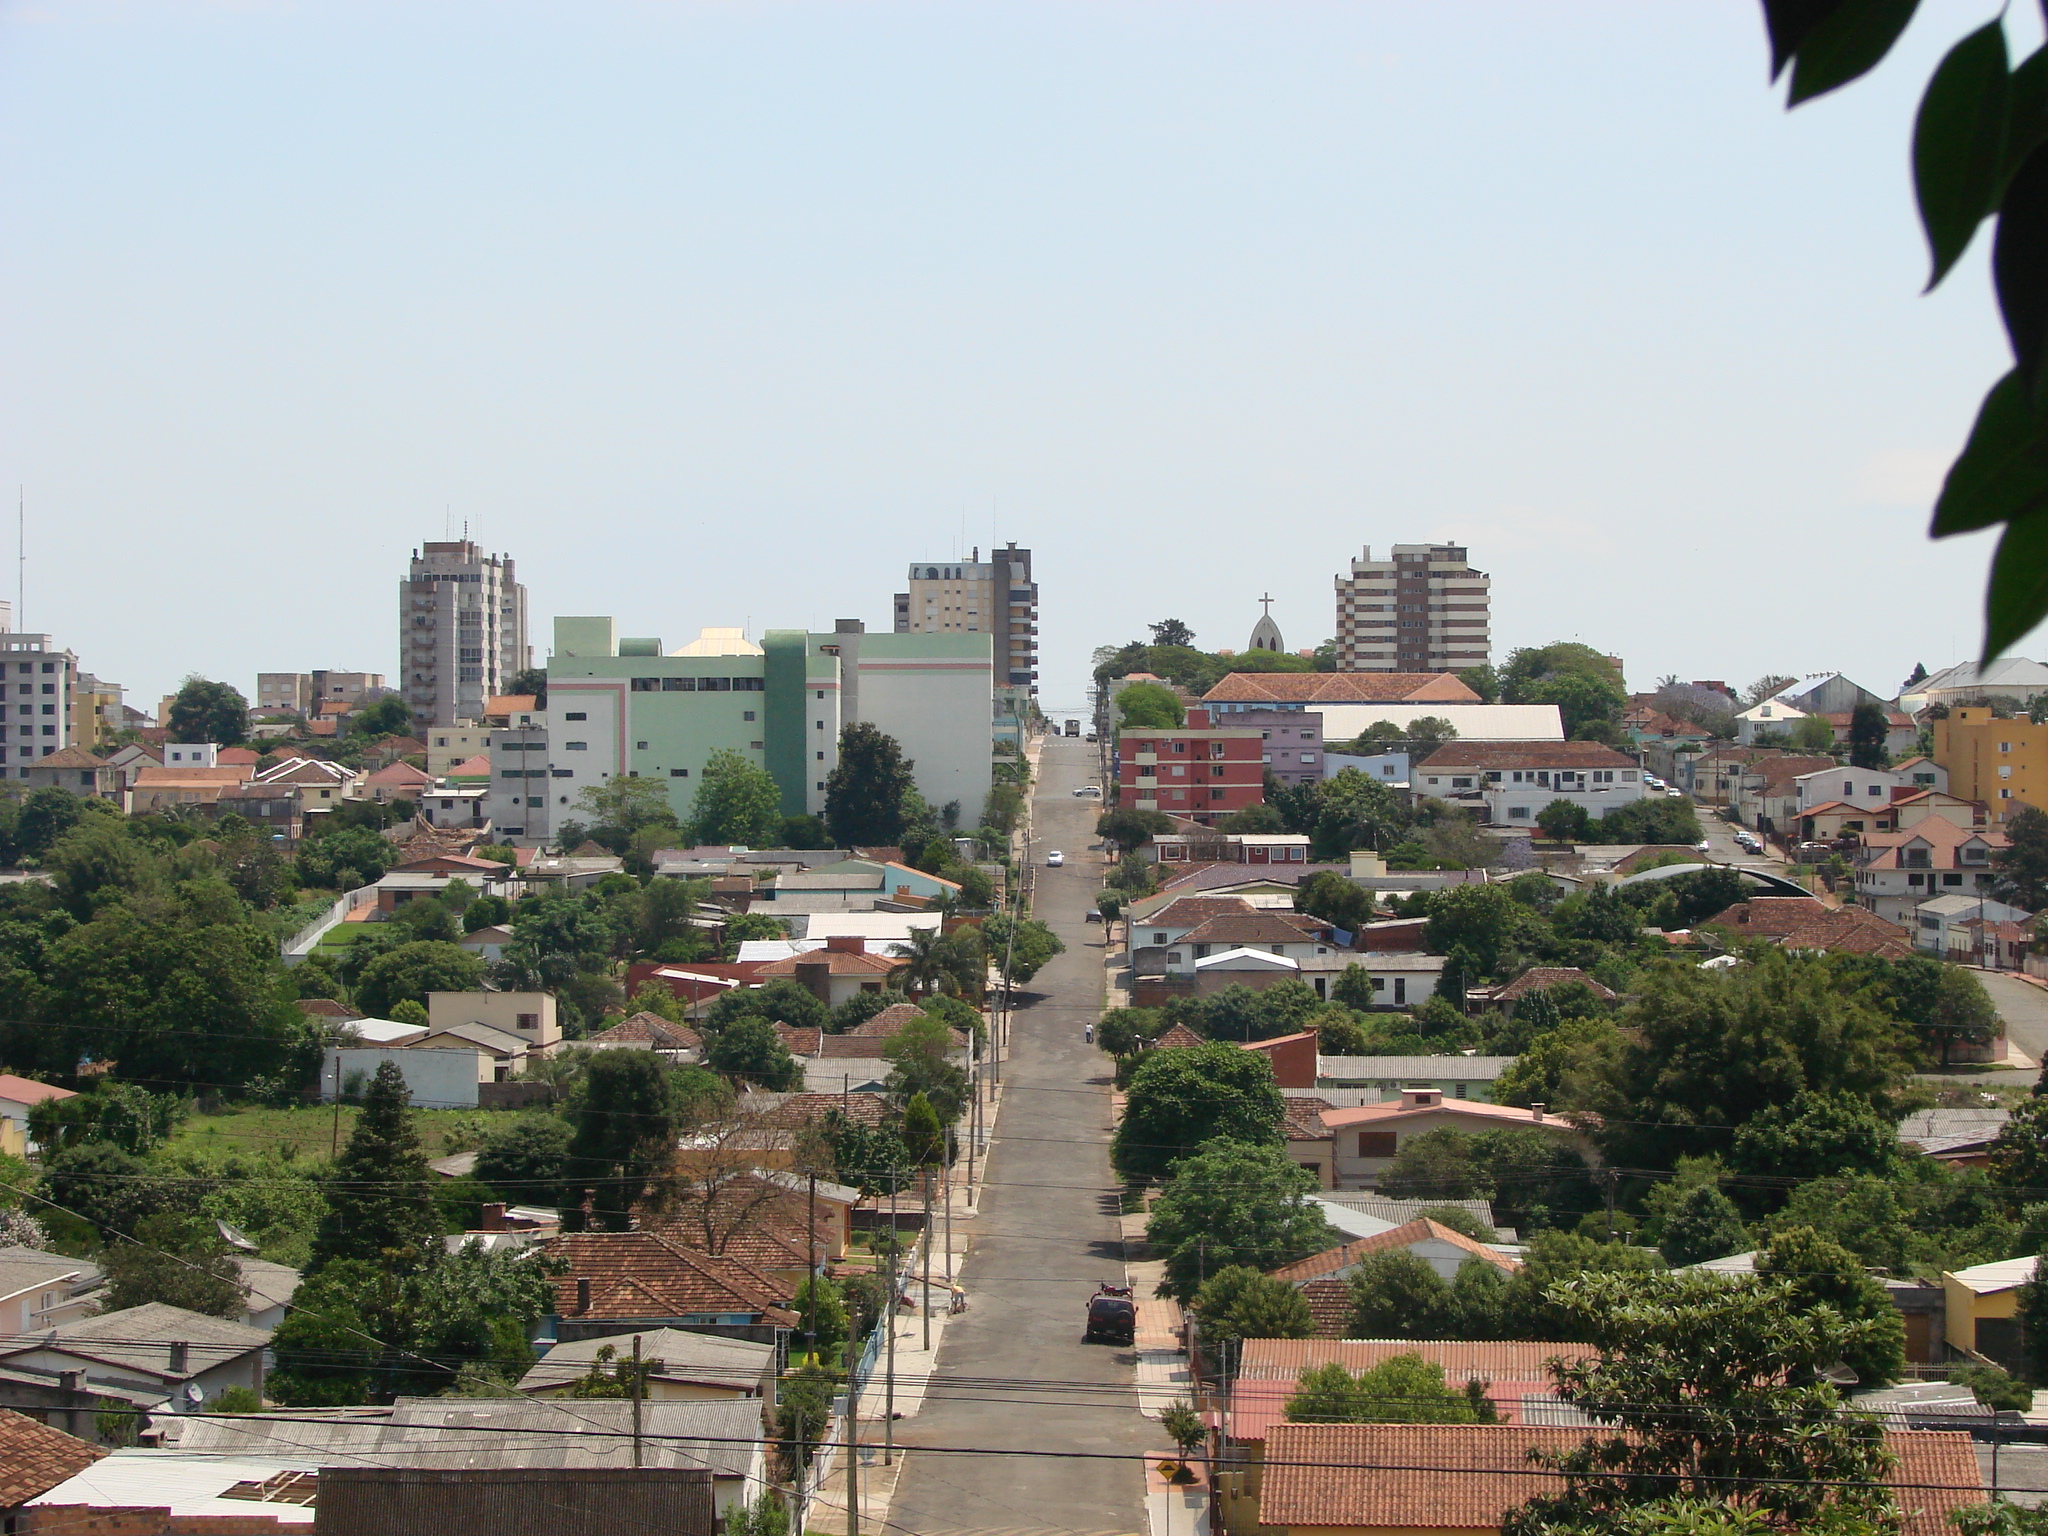
Quevedos
Quevedos is a municipality of the west-central part of the state of Rio Grande do Sul, Brazil. The population is 2,816 (2015 est.) in an area of 543.36 km². Its elevation is 410 m. It is west of the state capital of Porto Alegre, northeast of Alegret..
Quevedos Wikipedia Page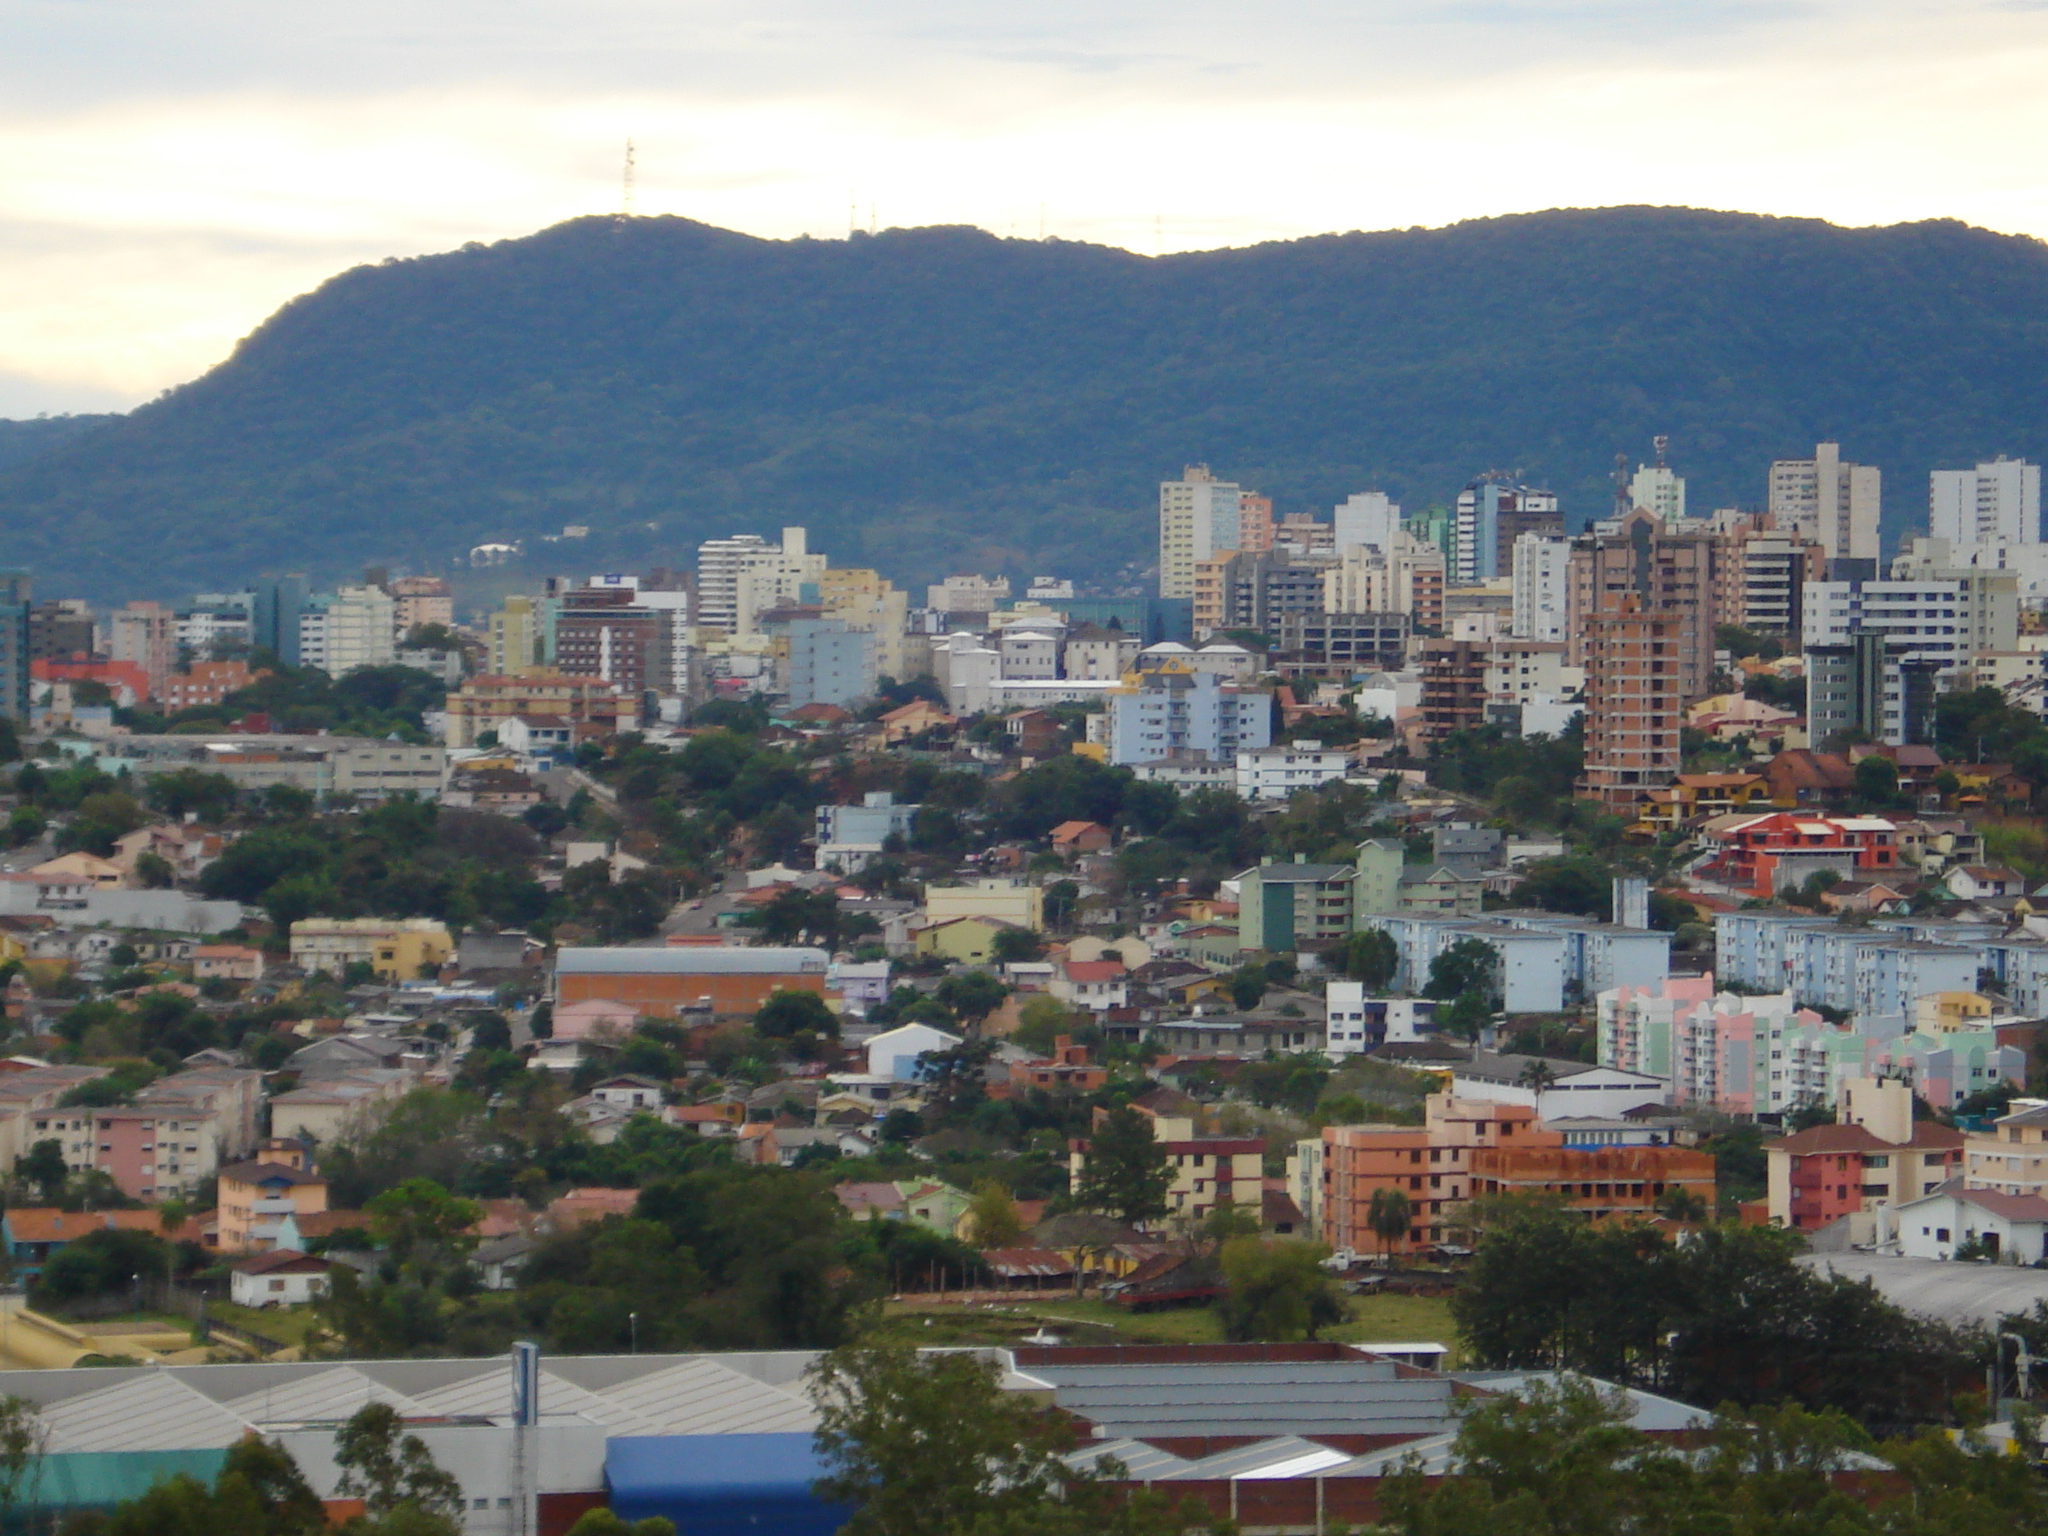
About Our Data
The data on this page is estimated using a number of publicly available tools and resources. It is provided without warranty, and could contain inaccuracies. Use at your own risk.