Baruny Facts
| Area | 0.8 km² |
| Population | 179 |
| Population change (1975 to 2020) | -42.6% |
| Population change (2000 to 2020) | -25.7% |
| Local Time | |
| Timezone | Moscow Standard Time |
| Lat & Lng | 54.31710, 26.13760 |
| Postal Codes | 231123 |
Map of Baruny
Interactive Map
Baruny Population
Years 1975 to 2020
| Data | 1975 | 1990 | 2000 | 2015 | 2020 |
|---|---|---|---|---|---|
| Population | 312 | 297 | 241 | 184 | 179 |
| Population Density | 384 / km² | 365.5 / km² | 296.6 / km² | 226.5 / km² | 220.3 / km² |
Sources: JRC (European Commission's Joint Research Centre) work on the GHS built-up grid
Baruny Population change from 2000 to 2015
Decrease of 23.7% from year 2000 to 2015
| Location | Change since 1975 | Change since 1990 | Change since 2000 |
|---|---|---|---|
| Baruny | -41% | -38% | -23.7% |
| Grodno Region | -13.8% | -16.7% | -11% |
| Belarus | +1.4% | -7.2% | -4.6% |
Sources: JRC (European Commission's Joint Research Centre) work on the GHS built-up grid
Baruny Population Density
Population Density: 220 / km²
| Location | Population | Area | Density |
|---|---|---|---|
| Baruny | 179 | 0.813 km² | 220 / km² |
| Grodno Region | 1 million | 25,114.8 km² | 41.5 / km² |
| Belarus | 9.5 million | 207,600.9 km² | 45.8 / km² |
Sources: JRC (European Commission's Joint Research Centre) work on the GHS built-up grid
Baruny Historical and Projected Population
Estimated Population from 0 to 2100
Sources:
- JRC (European Commission's Joint Research Centre) work on the GHS built-up grid
- CIESIN (Center for International Earth Science Information Network)
- [Link] Klein Goldewijk, K., Beusen, A., Doelman, J., and Stehfest, E.: Anthropogenic land use estimates for the Holocene – HYDE 3.2, Earth Syst. Sci. Data, 9, 927–953, https://doi.org/10.5194/essd-9-927-2017, 2017.
Human Development Index (HDI)
Statistic composite index of life expectancy, education, and per capita income.
Source: [Link] Kummu, M., Taka, M. &Guillaume, J. Gridded global datasets for Gross Domestic Product and Human Development Index over 1990–2015. Sci Data 5, 180004 (2018) doi:10.1038/sdata.2018.4
Baruny CO2 Emissions
Carbon Dioxide (CO2) Emissions Per Capita in Tonnes Per Year
| Location | CO2 Emissions | CO2 Emissions Per Capita | CO2 Emissions Intensity |
|---|---|---|---|
| Baruny | 7 tn | 0.04 tn | 8.4 tons/km² |
| Grodno Region | 151,842 tn | 0.15 tn | 6 tons/km² |
| Belarus | 785,447 tn | 0.08 tn | 3.8 tons/km² |
Sources: [Link] Moran, D., Kanemoto K; Jiborn, M., Wood, R., Többen, J., and Seto, K.C. (2018) Carbon footprints of 13,000 cities. Environmental Research Letters DOI: 10.1088/1748-9326/aac72a
Baruny CO2 Emissions
| 2013 CO2 emissions (tonnes/year) | 7 tn |
| 2013 CO2 emissions (tonnes/year) per capita | 0.04 tn |
| 2013 CO2 emissions intensity (tonnes/km²/year) | 8.4 tons/km² |
Baruny
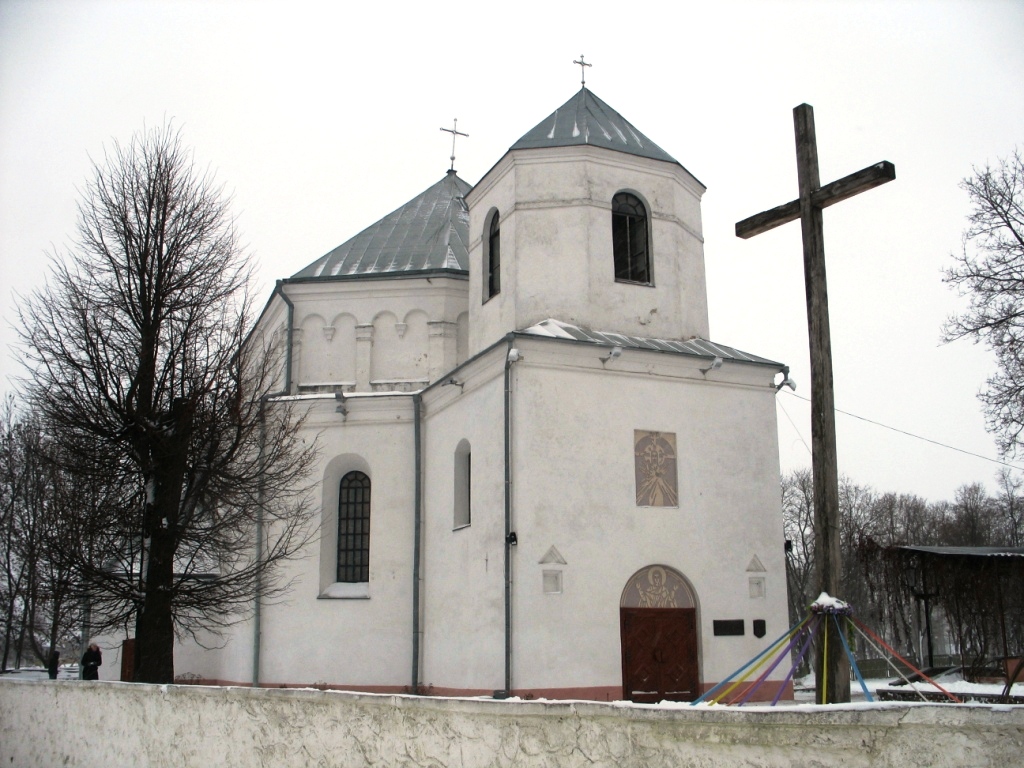
Baruny (Belarusian: Баруны, Polish: Boruny, Lithuanian: Barūnai) is a village in Belarus, not far from the town of Ashmyany. In the 18th and 19th centuries the local Basilian monastery was famous for its school, where many of young local noblemen, am..
Baruny Wikipedia Page


About Our Data
The data on this page is estimated using a number of publicly available tools and resources. It is provided without warranty, and could contain inaccuracies. Use at your own risk.