Categories in Pastavy
Industries
Business Distribution by Industry in Pastavy
| Industry Description | Number of Establishments |
|---|---|
| Shopping | 40 |
| Grocery stores and supermarkets | 39 |
| Clothing stores | 18 |
| Education | 13 |
| Car parts | 12 |
| Cafes | 11 |
| Pharmacies and drug stores | 11 |
| Car repair | 9 |
| Taxis | 8 |
| Museums | 8 |
| Public administration | 8 |
| Second hand stores | 8 |
| Hardware store | 7 |
| Wholesale of construction supplies | 7 |
| Post office | 7 |
Pastavy Facts
| Area | 18.9 km² |
| Population | 13,238 |
| Male Population | 6,103 (46.1%) |
| Female Population | 7,135 (53.9%) |
| Population change (1975 to 2020) | -68.4% |
| Population change (2000 to 2020) | -50.8% |
| Median Age | 40.9 years (Male: 37.5, Female: 44) |
| GDP per capita (PPP) | $5,545 (2022) |
| Local Time | |
| Timezone | Moscow Standard Time |
| Lat & Lng | 55.11676, 26.83263 |
| Postal Codes | 211840, 211841 |
Map of Pastavy
Interactive Map
Pastavy Population
Years 1975 to 2030
| Data | 1975 | 1990 | 2000 | 2015 | 2020 | 2025* | 2030* |
|---|---|---|---|---|---|---|---|
| Population | 41,834 | 32,705 | 26,929 | 18,056 | 13,238 | 12,298 | 11,563 |
| Population Density | 2,216.4 / km² | 1,732.7 / km² | 1,426.7 / km² | 956.6 / km² | 701.4 / km² | 651.5 / km² | 612.6 / km² |
Pastavy Population change from 2000 to 2020
Decrease of 50.8% from year 2000 to 2020
| Location | Change since 1975 | Change since 1990 | Change since 2000 |
|---|---|---|---|
| Pastavy | -68.4% | -59.5% | -50.8% |
| Vitebsk Region | — | — | — |
| Belarus | — | — | — |
Pastavy Median Age
Median Age: 40.9 years
| Location | Median Age | Median Age (Female) | Median Age (Male) |
|---|---|---|---|
| Pastavy | 40.9 yrs | 44 yrs | 37.5 yrs |
| Vitebsk Region | 40.9 yrs | 44 yrs | 37.5 yrs |
| Belarus | 38.8 yrs | 41.8 yrs | 35.7 yrs |
Pastavy Population Density
Population Density: 701 / km²
| Location | Population | Area | Density |
|---|---|---|---|
| Pastavy | 13,238 | 18.9 km² | 701 / km² |
| Vitebsk Region | 1.2 million | 40,155.2 km² | 29.4 / km² |
| Belarus | 9.5 million | 207,600.9 km² | 45.8 / km² |
Pastavy Historical and Projected Population
Estimated Population from 300 to 2100
- JRC (European Commission's Joint Research Centre) work on the GHS built-up grid
- CIESIN (Center for International Earth Science Information Network)
- [Link] Klein Goldewijk, K., Beusen, A., Doelman, J., and Stehfest, E.: Anthropogenic land use estimates for the Holocene – HYDE 3.2, Earth Syst. Sci. Data, 9, 927–953, https://doi.org/10.5194/essd-9-927-2017, 2017.
Price Distribution
Business distribution by price for Pastavy
Human Development Index (HDI)
Statistic composite index of life expectancy, education, and per capita income.
Pastavy Gross Domestic Product (GDP)
GDP per capita, PPP (constant 2017 international $)
| Data | 1990 | 1995 | 2000 | 2005 | 2010 | 2015 | 2020 | 2022 |
|---|---|---|---|---|---|---|---|---|
| GDP per capita | $4,059 | $2,662 | $3,629 | $3,419 | $5,053 | $6,137 | $6,518 | $5,545 |
| Total GDP | $25.9M | $18.1M | $24.7M | $21.2M | $29M | $33.3M | $32.5M | $27M |
Pastavy CO2 Emissions
Carbon Dioxide (CO2) Emissions Per Capita in Tonnes Per Year
| Location | CO2 Emissions | CO2 Emissions Per Capita | CO2 Emissions Intensity |
|---|---|---|---|
| Pastavy | 470 tn | 0.04 tn | 24.9 tons/km² |
| Vitebsk Region | 120,432 tn | 0.1 tn | 3 tons/km² |
| Belarus | 785,447 tn | 0.08 tn | 3.8 tons/km² |
| 2013 CO2 emissions (tonnes/year) | 470 tn |
| 2013 CO2 emissions (tonnes/year) per capita | 0.04 tn |
| 2013 CO2 emissions intensity (tonnes/km²/year) | 24.9 tons/km² |
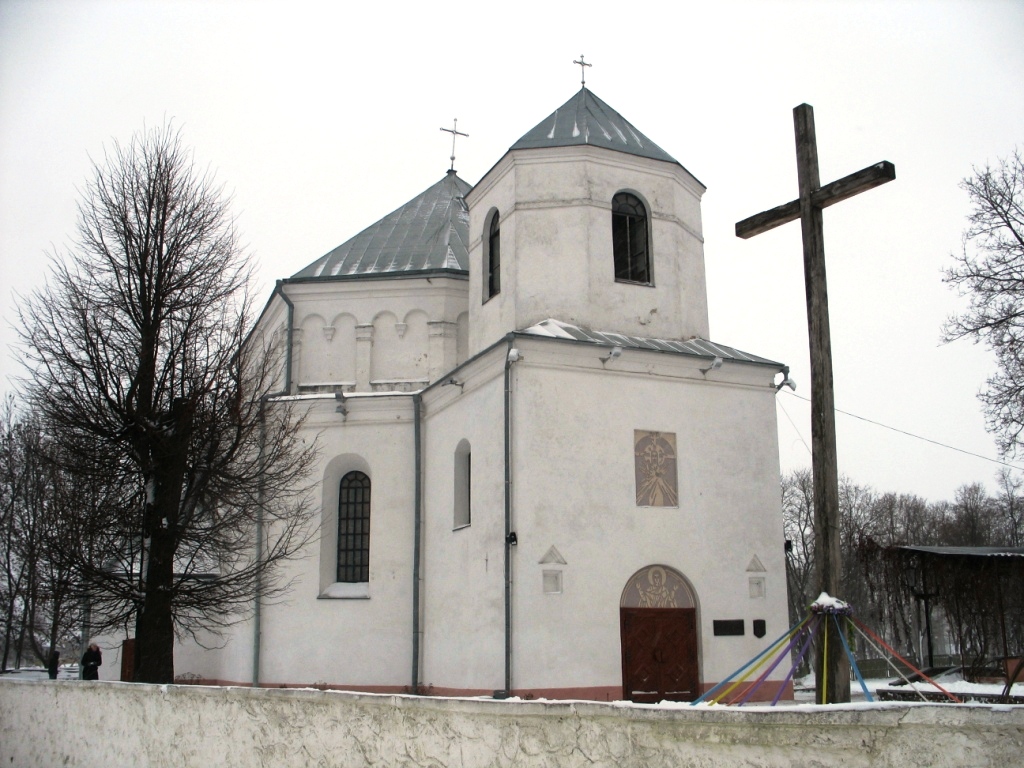
Pastavy
Pastavy (Belarusian: Паставы, Lithuanian: Pastovys, Russian: Поставы, Polish: Postawy) is a city in the Vitebsk Region of Belarus, an administrative center of Pastavy Raion.
Pastavy Wikipedia Page


About Our Data
The data on this page is estimated using a number of publicly available tools and resources. It is provided without warranty, and could contain inaccuracies. Use at your own risk.