Categories in Limache
Industries
Business Distribution by Industry in Limache
| Industry Description | Number of Establishments |
|---|---|
| Shopping | 36 |
| Restaurants | 12 |
| Education | 10 |
| Post office | 9 |
Limache Facts
| Area | 83.9 km² |
| Population | 44,442 |
| Male Population | 22,186 (49.9%) |
| Female Population | 22,256 (50.1%) |
| Population change (1975 to 2020) | +136.1% |
| Population change (2000 to 2020) | +23.0% |
| Median Age | 31.8 years (Male: 30.9, Female: 32.7) |
| Neighborhoods | Ñuñoa, (plaza de las 40 horas) |
| Local Time | |
| Timezone | Chile Standard Time |
| Lat & Lng | -33.01667, -71.26667 |
| Postal Codes | 2240000 |
Map of Limache
Interactive Map
Limache Population
Years 1975 to 2020
| Data | 1975 | 1990 | 2000 | 2015 | 2020 |
|---|---|---|---|---|---|
| Population | 18,820 | 29,653 | 36,119 | 42,485 | 44,442 |
| Population Density | 224.2 / km² | 353.3 / km² | 430.3 / km² | 506.2 / km² | 529.5 / km² |
Limache Population change from 2000 to 2015
Increase of 17.6% from year 2000 to 2015
| Location | Change since 1975 | Change since 1990 | Change since 2000 |
|---|---|---|---|
| Limache | +125.7% | +43.3% | +17.6% |
| Valparaíso Region | +100.1% | +44.1% | +20.2% |
| Chile | +72.2% | +36.6% | +18.3% |
Limache Median Age
Median Age: 31.8 years
| Location | Median Age | Median Age (Female) | Median Age (Male) |
|---|---|---|---|
| Limache | 31.8 yrs | 32.7 yrs | 30.9 yrs |
| Valparaíso Region | 32 yrs | 33.3 yrs | 30.7 yrs |
| Chile | 31.3 yrs | 32 yrs | 30.6 yrs |
Limache Population Density
Population Density: 530 / km²
| Location | Population | Area | Density |
|---|---|---|---|
| Limache | 44,442 | 83.9 km² | 530 / km² |
| Valparaíso Region | 1.8 million | 16,267.5 km² | 111 / km² |
| Chile | 17.8 million | 751,744.8 km² | 23.7 / km² |
Limache Historical and Projected Population
Estimated Population from 1770 to 2100
- JRC (European Commission's Joint Research Centre) work on the GHS built-up grid
- CIESIN (Center for International Earth Science Information Network)
- [Link] Klein Goldewijk, K., Beusen, A., Doelman, J., and Stehfest, E.: Anthropogenic land use estimates for the Holocene – HYDE 3.2, Earth Syst. Sci. Data, 9, 927–953, https://doi.org/10.5194/essd-9-927-2017, 2017.
Price Distribution
Business distribution by price for Limache
Human Development Index (HDI)
Statistic composite index of life expectancy, education, and per capita income.
Limache CO2 Emissions
Carbon Dioxide (CO2) Emissions Per Capita in Tonnes Per Year
| Location | CO2 Emissions | CO2 Emissions Per Capita | CO2 Emissions Intensity |
|---|---|---|---|
| Limache | 242,591 tn | 5.46 tn | 2,890.1 tons/km² |
| Valparaíso Region | 8,951,726 tn | 4.94 tn | 550.3 tons/km² |
| Chile | 87,296,657 tn | 4.91 tn | 116.1 tons/km² |
| 2013 CO2 emissions (tonnes/year) | 242,591 tn |
| 2013 CO2 emissions (tonnes/year) per capita | 5.46 tn |
| 2013 CO2 emissions intensity (tonnes/km²/year) | 2,890.1 tons/km² |
Natural Hazards Risk
Relative risk out of 10
| Hazard | Risk Level |
|---|---|
| Drought | High (10) |
| Flood | High (10) |
| Earthquake | High (10) |
| Landslide | Medium (7) |
* Risk, particularly concerning flood or landslide, may not be for the entire area.
- Dilley, M., R.S. Chen, U. Deichmann, A.L. Lerner-Lam, M. Arnold, J. Agwe, P. Buys, O. Kjekstad, B. Lyon, and G. Yetman. 2005. Natural Disaster Hotspots: A Global Risk Analysis. Washington, D.C.: World Bank. https://doi.org/10.1596/0-8213-5930-4.
- Center for Hazards and Risk Research - CHRR - Columbia University, Center for International Earth Science Information Network - CIESIN - Columbia University, and Norwegian Geotechnical Institute - NGI. 2005. Global Landslide Hazard Distribution. Palisades, NY: NASA Socioeconomic Data and Applications Center (SEDAC). https://doi.org/10.7927/H4P848VZ.
- Center for Hazards and Risk Research - CHRR - Columbia University, Center for International Earth Science Information Network - CIESIN - Columbia University, and International Research Institute for Climate and Society - IRI - Columbia University. 2005. Global Drought Hazard Frequency and Distribution. Palisades, NY: NASA Socioeconomic Data and Applications Center (SEDAC). https://doi.org/10.7927/H4VX0DFT.
- Center for Hazards and Risk Research - CHRR - Columbia University, Center for International Earth Science Information Network - CIESIN - Columbia University. 2005. Global Flood Hazard Frequency and Distribution. Palisades, NY: NASA Socioeconomic Data and Applications Center (SEDAC). https://doi.org/10.7927/H4668B3D.
- Center for Hazards and Risk Research - CHRR - Columbia University, Center for International Earth Science Information Network - CIESIN - Columbia University. 2005. Global Earthquake Hazard Distribution - Peak Ground Acceleration. Palisades, NY: NASA Socioeconomic Data and Applications Center (SEDAC). https://doi.org/10.7927/H4BZ63ZS.
Recent Nearby Earthquakes
Magnitude 3.0 and greater
| Date▼ | Time↕ | Magnitude↕ | Distance↕ | Depth↕ | Location↕ | Link |
|---|---|---|---|---|---|---|
| 6/14/15 | 1:42 AM | 3.7 | 14.7 km | 46,700 m | 11km WSW of Quillota, Chile | usgs.gov |
| 7/13/14 | 3:16 AM | 4.8 | 7.6 km | 44,100 m | 7km S of Quillota, Chile | usgs.gov |
| 1/2/14 | 10:39 PM | 4.8 | 12.7 km | 44,800 m | 9km N of Villa Alemana, Chile | usgs.gov |
| 1/9/13 | 8:39 AM | 4.1 | 9 km | 66,100 m | Valparaiso, Chile | usgs.gov |
| 6/29/08 | 6:38 PM | 3.7 | 16.6 km | 50,700 m | Valparaiso, Chile | usgs.gov |
| 3/21/08 | 11:13 AM | 3.1 | 8.9 km | 52,600 m | Valparaiso, Chile | usgs.gov |
| 2/25/08 | 1:13 PM | 3.3 | 8.8 km | 66,500 m | Valparaiso, Chile | usgs.gov |
| 2/6/08 | 5:01 AM | 3 | 10 km | 57,600 m | Valparaiso, Chile | usgs.gov |
| 9/2/07 | 5:19 PM | 3.2 | 15.3 km | 49,200 m | Valparaiso, Chile | usgs.gov |
| 8/13/07 | 12:27 PM | 3 | 16.9 km | 46,200 m | Valparaiso, Chile | usgs.gov |
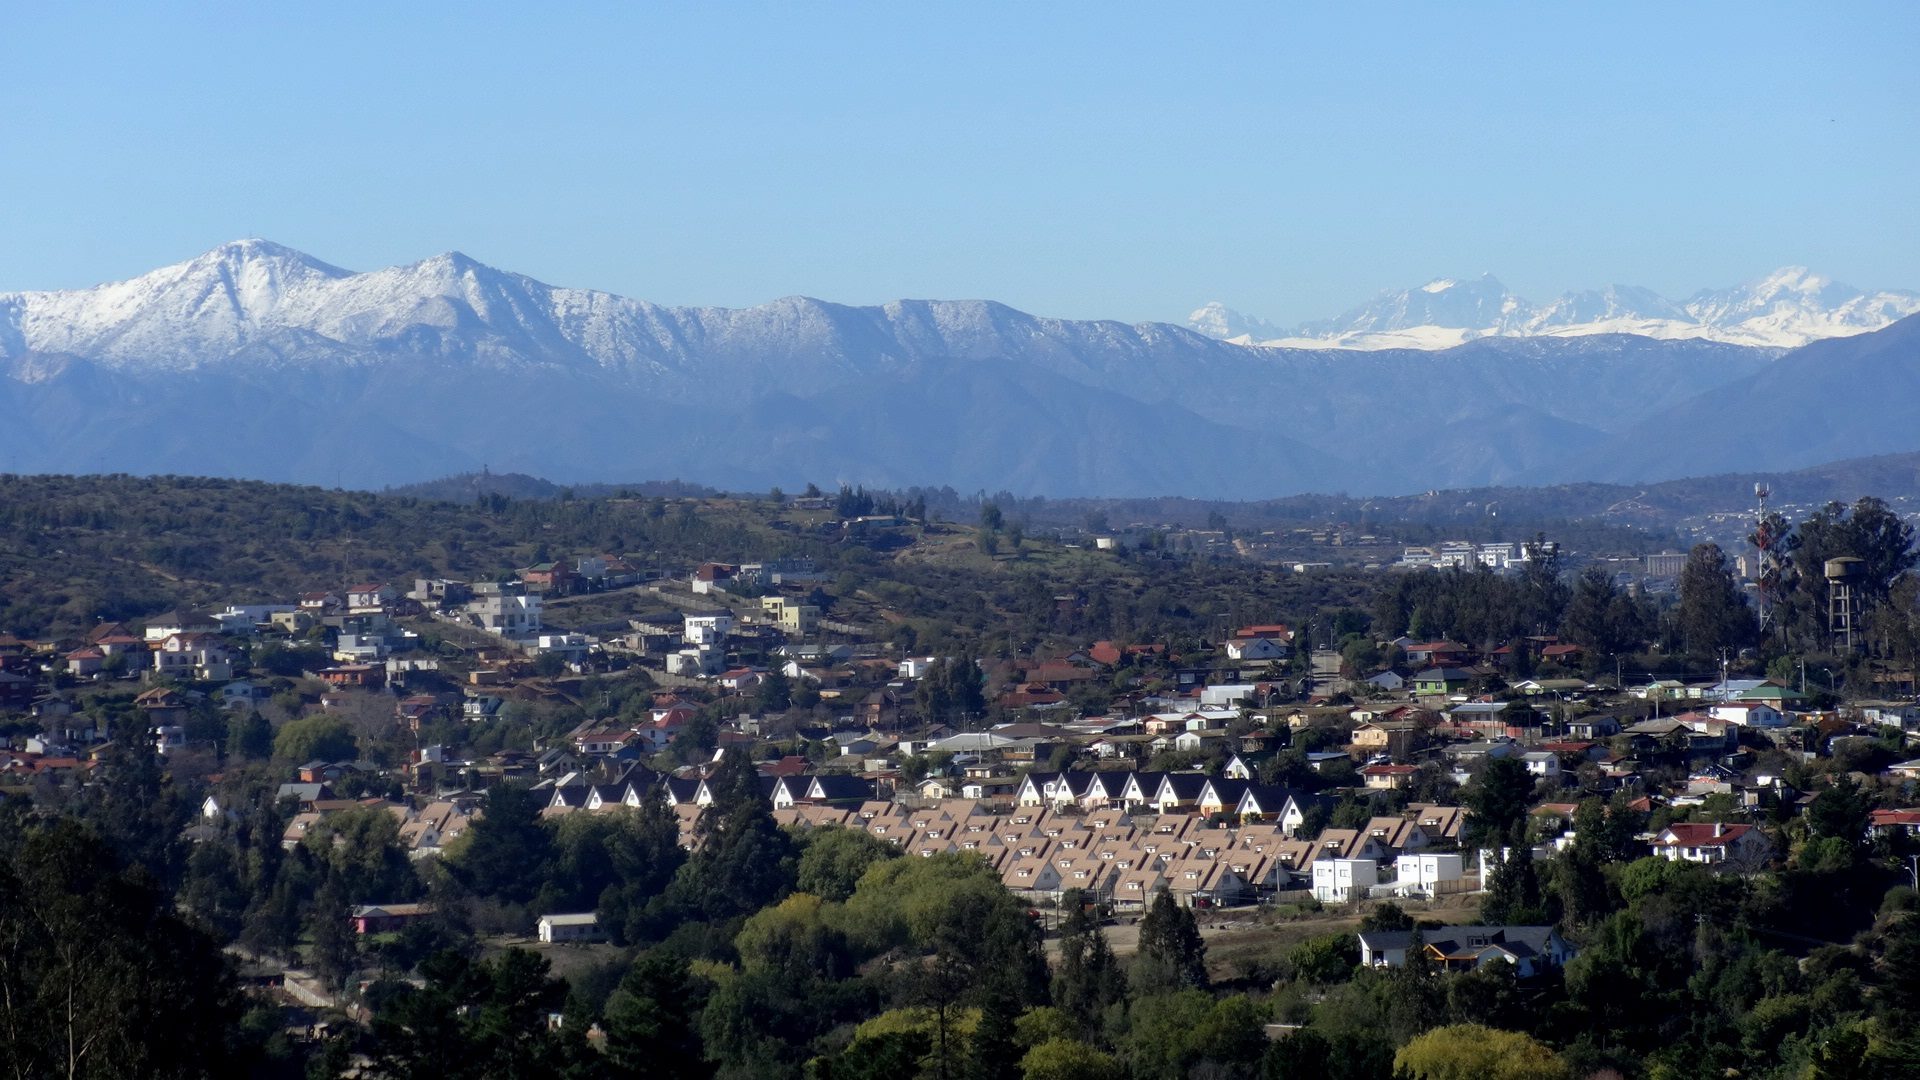
Limache
Limache is a Chilean city and commune in the Marga Marga Province, Valparaíso Region. Limache is the only commune of Chile that has two cities. First San Francisco de Limache is to the north of the Matting of Limache, towards the south is Limache Vie..
Limache Wikipedia Page

About Our Data
The data on this page is estimated using a number of publicly available tools and resources. It is provided without warranty, and could contain inaccuracies. Use at your own risk.