Nirivilo Facts
| Area | 3.1 km² |
| Population | 770 |
| Male Population | 382 (49.6%) |
| Female Population | 388 (50.4%) |
| Population change (2000 to 2020) | +30.7% |
| Median Age | 33 years (Male: 32.5, Female: 33.4) |
| Local Time | |
| Timezone | Chile Standard Time |
| Lat & Lng | -35.54372, -72.09194 |
Map of Nirivilo
Interactive Map
Nirivilo Population
Years 1975 to 2020
| Data | 1975 | 1990 | 2000 | 2015 | 2020 |
|---|---|---|---|---|---|
| Population | 0 | 228 | 589 | 738 | 770 |
| Population Density | 0 / km² | 73 / km² | 188.5 / km² | 236.2 / km² | 246.4 / km² |
Nirivilo Population change from 2000 to 2015
Increase of 25.3% from year 2000 to 2015
| Location | Change since 1975 | Change since 1990 | Change since 2000 |
|---|---|---|---|
| Nirivilo | — | +223.7% | +25.3% |
| Maule Region | +82.5% | +32.8% | +13.2% |
| Chile | +72.2% | +36.6% | +18.3% |
Nirivilo Median Age
Median Age: 33 years
| Location | Median Age | Median Age (Female) | Median Age (Male) |
|---|---|---|---|
| Nirivilo | 33 yrs | 33.4 yrs | 32.5 yrs |
| Maule Region | 32.1 yrs | 32.6 yrs | 31.6 yrs |
| Chile | 31.3 yrs | 32 yrs | 30.6 yrs |
Nirivilo Population Density
Population Density: 246 / km²
| Location | Population | Area | Density |
|---|---|---|---|
| Nirivilo | 770 | 3.125 km² | 246 / km² |
| Maule Region | 1 million | 30,309.7 km² | 33.9 / km² |
| Chile | 17.8 million | 751,744.8 km² | 23.7 / km² |
Nirivilo Historical and Projected Population
Estimated Population from 1975 to 2100
- JRC (European Commission's Joint Research Centre) work on the GHS built-up grid
- CIESIN (Center for International Earth Science Information Network)
- [Link] Klein Goldewijk, K., Beusen, A., Doelman, J., and Stehfest, E.: Anthropogenic land use estimates for the Holocene – HYDE 3.2, Earth Syst. Sci. Data, 9, 927–953, https://doi.org/10.5194/essd-9-927-2017, 2017.
Human Development Index (HDI)
Statistic composite index of life expectancy, education, and per capita income.
Nirivilo CO2 Emissions
Carbon Dioxide (CO2) Emissions Per Capita in Tonnes Per Year
| Location | CO2 Emissions | CO2 Emissions Per Capita | CO2 Emissions Intensity |
|---|---|---|---|
| Nirivilo | 3,235 tn | 4.2 tn | 1,035.1 tons/km² |
| Maule Region | 4,565,743 tn | 4.44 tn | 150.6 tons/km² |
| Chile | 87,296,657 tn | 4.91 tn | 116.1 tons/km² |
| 2013 CO2 emissions (tonnes/year) | 3,235 tn |
| 2013 CO2 emissions (tonnes/year) per capita | 4.2 tn |
| 2013 CO2 emissions intensity (tonnes/km²/year) | 1,035.1 tons/km² |
Natural Hazards Risk
Relative risk out of 10
| Hazard | Risk Level |
|---|---|
| Drought | High (8) |
| Flood | Medium (4) |
| Earthquake | Medium (7) |
* Risk, particularly concerning flood or landslide, may not be for the entire area.
- Dilley, M., R.S. Chen, U. Deichmann, A.L. Lerner-Lam, M. Arnold, J. Agwe, P. Buys, O. Kjekstad, B. Lyon, and G. Yetman. 2005. Natural Disaster Hotspots: A Global Risk Analysis. Washington, D.C.: World Bank. https://doi.org/10.1596/0-8213-5930-4.
- Center for Hazards and Risk Research - CHRR - Columbia University, Center for International Earth Science Information Network - CIESIN - Columbia University, and International Research Institute for Climate and Society - IRI - Columbia University. 2005. Global Drought Hazard Frequency and Distribution. Palisades, NY: NASA Socioeconomic Data and Applications Center (SEDAC). https://doi.org/10.7927/H4VX0DFT.
- Center for Hazards and Risk Research - CHRR - Columbia University, Center for International Earth Science Information Network - CIESIN - Columbia University. 2005. Global Flood Hazard Frequency and Distribution. Palisades, NY: NASA Socioeconomic Data and Applications Center (SEDAC). https://doi.org/10.7927/H4668B3D.
- Center for Hazards and Risk Research - CHRR - Columbia University, Center for International Earth Science Information Network - CIESIN - Columbia University. 2005. Global Earthquake Hazard Distribution - Peak Ground Acceleration. Palisades, NY: NASA Socioeconomic Data and Applications Center (SEDAC). https://doi.org/10.7927/H4BZ63ZS.
Recent Nearby Earthquakes
Magnitude 3.0 and greater
| Date▼ | Time↕ | Magnitude↕ | Distance↕ | Depth↕ | Location↕ | Link |
|---|---|---|---|---|---|---|
| 4/21/19 | 10:00 AM | 4.9 | 24.1 km | 78,790 m | 25km SW of San Javier, Chile | usgs.gov |
| 7/6/16 | 1:19 PM | 4.4 | 19.8 km | 14,240 m | 12km W of San Javier, Chile | usgs.gov |
| 2/11/14 | 3:38 AM | 4.4 | 17.4 km | 36,500 m | 25km W of Talca, Chile | usgs.gov |
| 7/9/12 | 1:44 AM | 4.5 | 36.8 km | 49,700 m | Maule, Chile | usgs.gov |
| 6/21/12 | 9:24 AM | 4.5 | 12.1 km | 28,400 m | Maule, Chile | usgs.gov |
| 4/13/12 | 6:13 AM | 4.7 | 37.6 km | 40,300 m | Maule, Chile | usgs.gov |
| 3/31/12 | 9:52 PM | 4.4 | 30.7 km | 42,900 m | Maule, Chile | usgs.gov |
| 3/21/12 | 2:41 AM | 4.6 | 27.8 km | 67,000 m | Maule, Chile | usgs.gov |
| 8/1/11 | 5:55 AM | 4.4 | 27.8 km | 35,300 m | Maule, Chile | usgs.gov |
| 3/31/11 | 12:05 PM | 4.7 | 24.9 km | 45,800 m | Maule, Chile | usgs.gov |
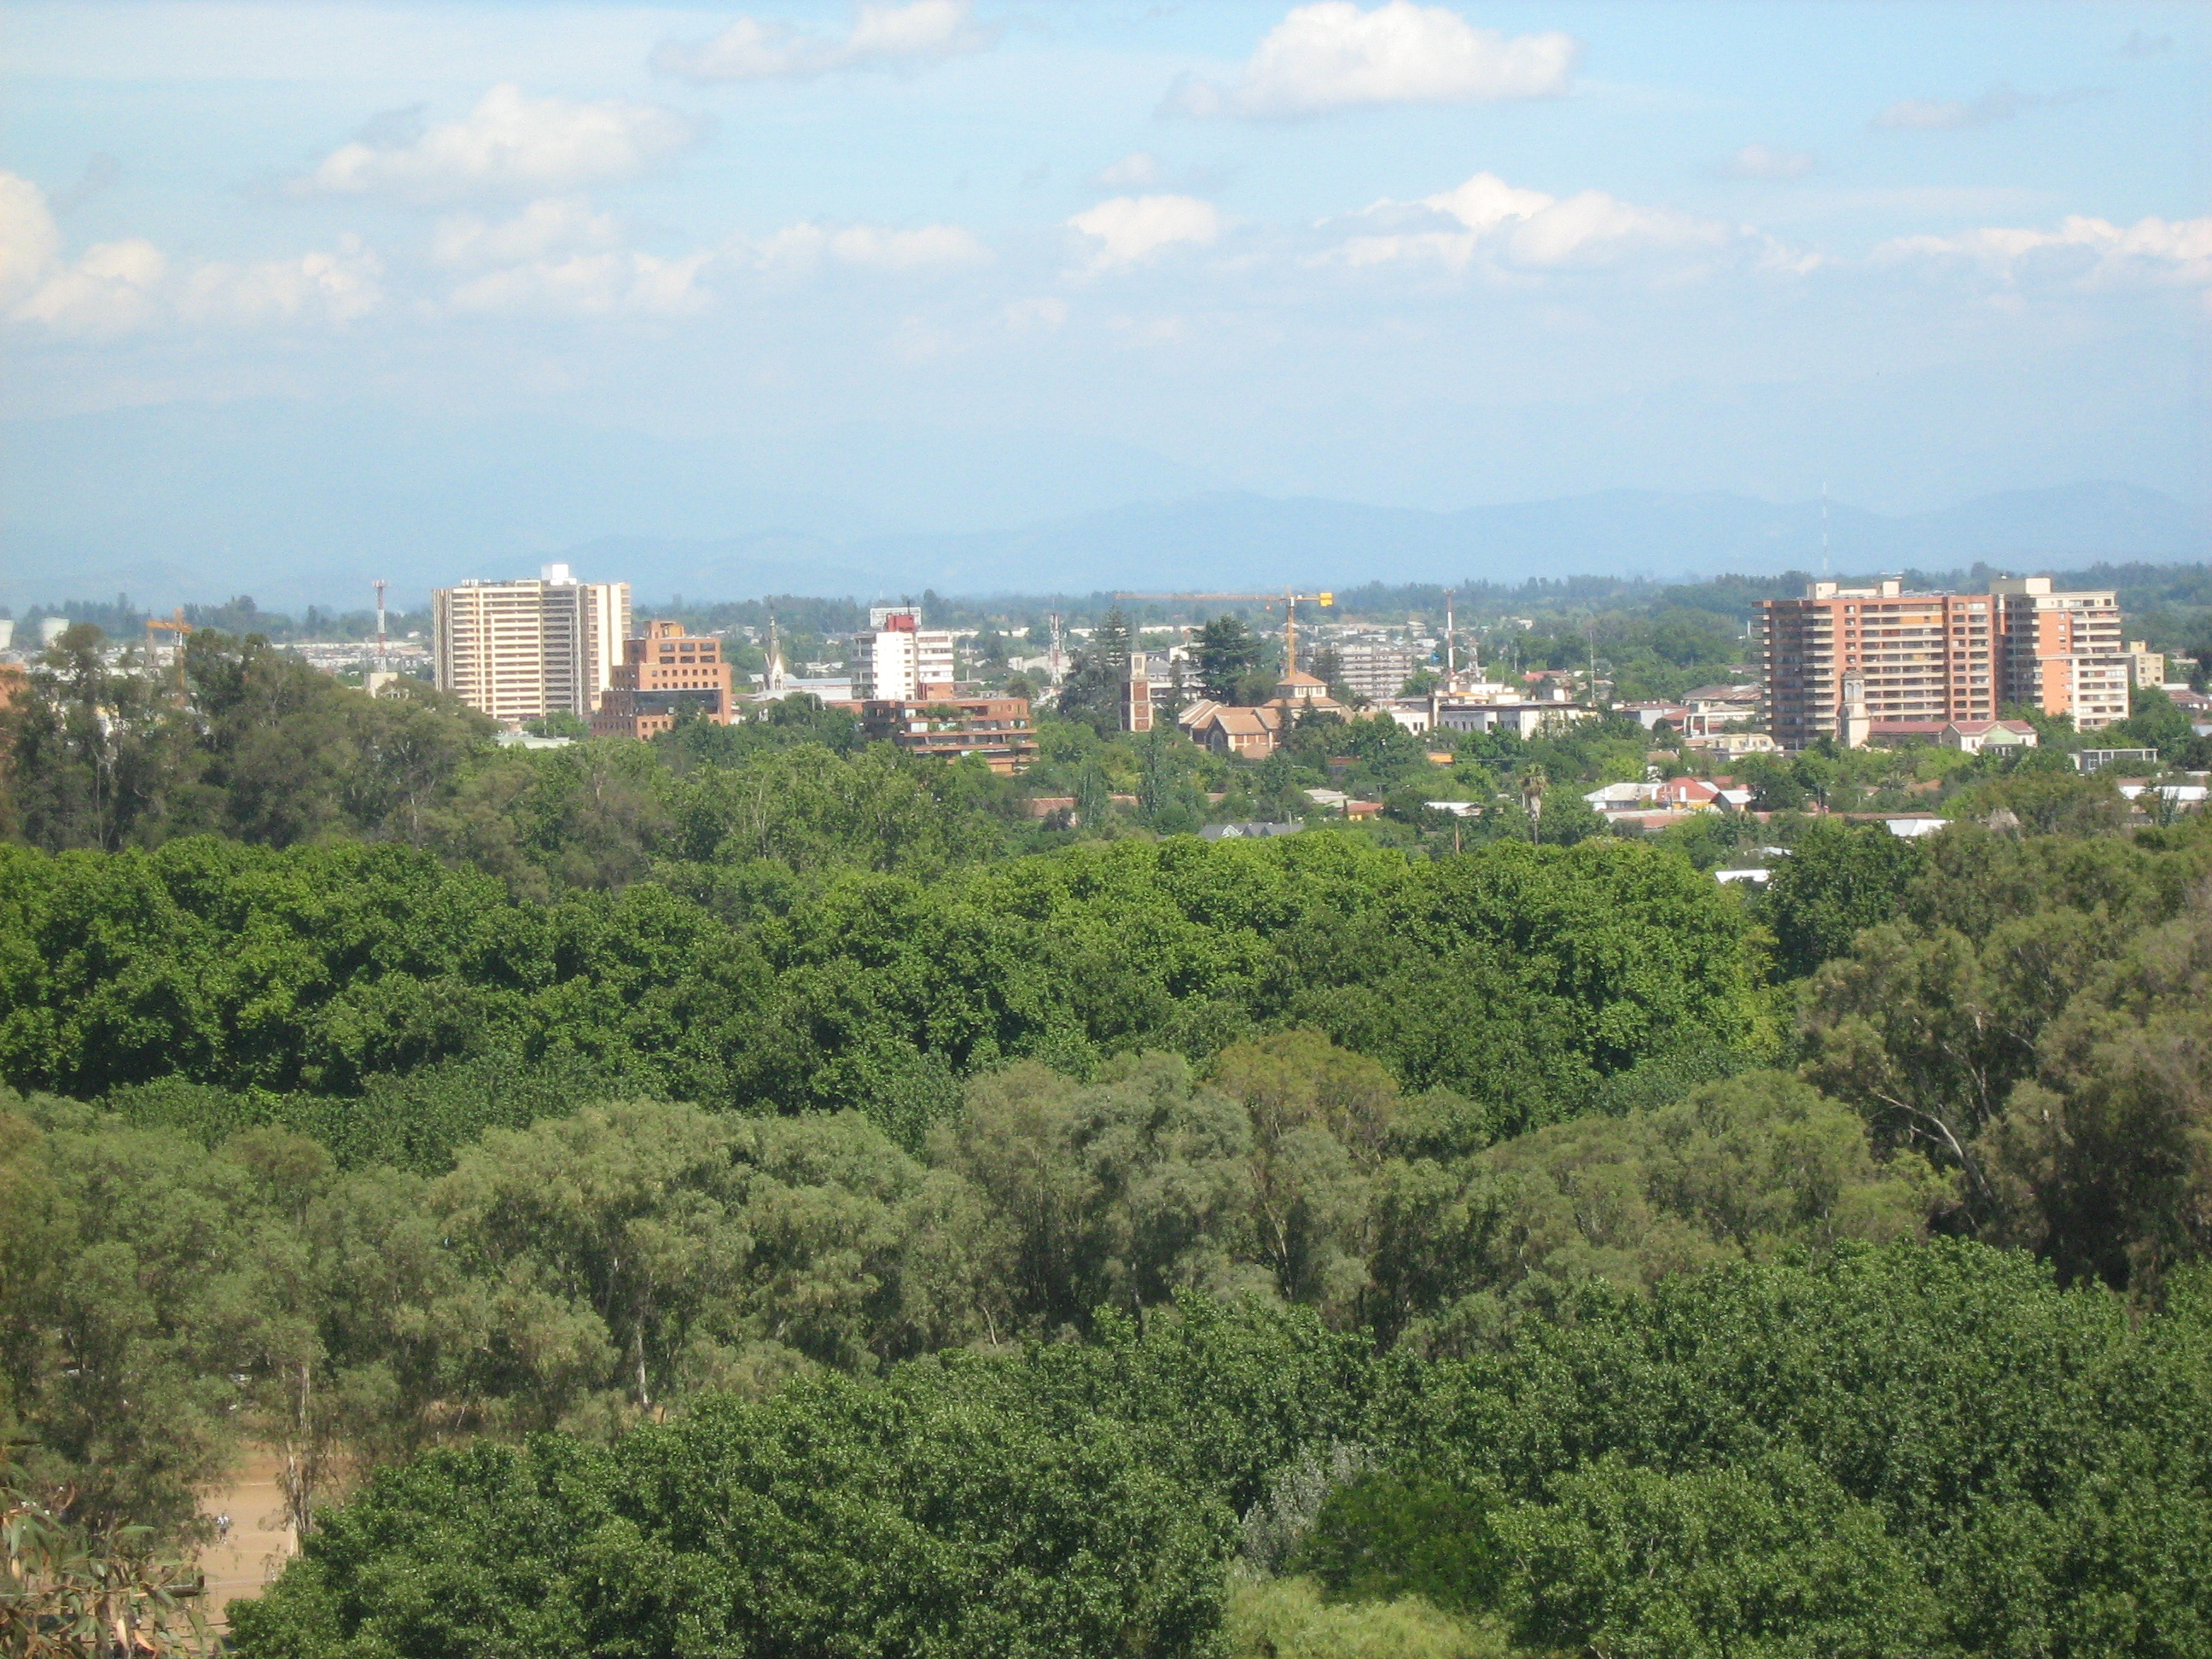
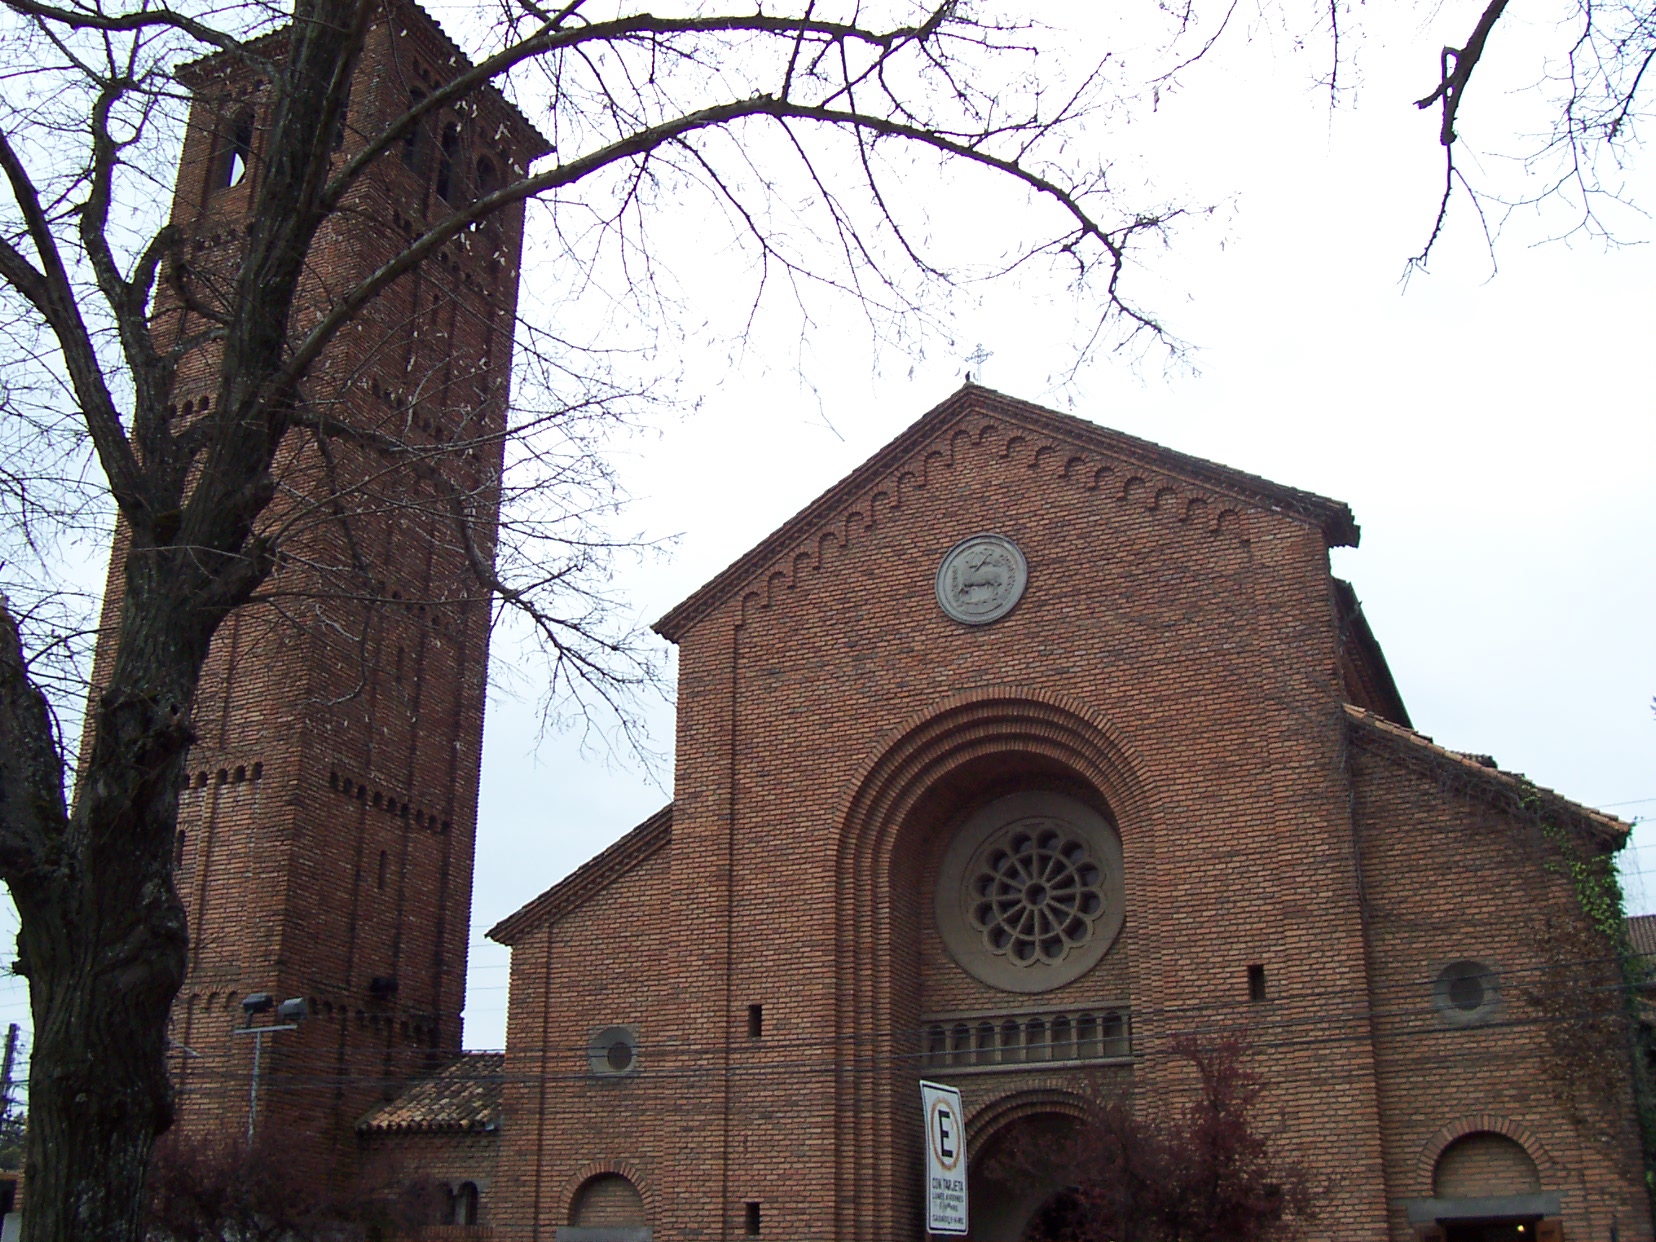
Nirivilo
Nirivilo (in Mapudungun: fox snake, a creature in the Mapuche mythology of Chile) is a hamlet (caserío) in San Javier commune, in the Chilean province of Linares, Maule Region. It offers some remarkable examples of typical Chilean rural architecture...
Nirivilo Wikipedia Page

About Our Data
The data on this page is estimated using a number of publicly available tools and resources. It is provided without warranty, and could contain inaccuracies. Use at your own risk.