Putagán, Chile Facts
| Area | 5.0 km² |
| Population | 591 |
| Male Population | 292 (49.3%) |
| Female Population | 299 (50.7%) |
| Population change (2000 to 2020) | -10.3% |
| Median Age | 34.4 years (Male: 34.4, Female: 34.3) |
| Local Time | |
| Timezone | Chile Standard Time |
| Lat & Lng | -35.76497, -71.66782 |
Map of Putagán, Chile
Interactive Map
Putagán, Chile Population
Years 1975 to 2020
| Data | 1975 | 1990 | 2000 | 2015 | 2020 |
|---|---|---|---|---|---|
| Population | 0 | 533 | 659 | 565 | 591 |
| Population Density | 0 / km² | 106.6 / km² | 131.8 / km² | 113 / km² | 118.2 / km² |
Putagán, Chile Population change from 2000 to 2015
Decrease of 14.3% from year 2000 to 2015
| Location | Change since 1975 | Change since 1990 | Change since 2000 |
|---|---|---|---|
| Putagán, Chile | — | +6% | -14.3% |
| Maule Region | +82.5% | +32.8% | +13.2% |
| Chile | +72.2% | +36.6% | +18.3% |
Putagán, Chile Median Age
Median Age: 34.4 years
| Location | Median Age | Median Age (Female) | Median Age (Male) |
|---|---|---|---|
| Putagán, Chile | 34.4 yrs | 34.3 yrs | 34.4 yrs |
| Maule Region | 32.1 yrs | 32.6 yrs | 31.6 yrs |
| Chile | 31.3 yrs | 32 yrs | 30.6 yrs |
Putagán, Chile Population Density
Population Density: 118 / km²
| Location | Population | Area | Density |
|---|---|---|---|
| Putagán, Chile | 591 | 5 km² | 118 / km² |
| Maule Region | 1 million | 30,309.7 km² | 33.9 / km² |
| Chile | 17.8 million | 751,744.8 km² | 23.7 / km² |
Putagán, Chile Historical and Projected Population
Estimated Population from 1975 to 2100
- JRC (European Commission's Joint Research Centre) work on the GHS built-up grid
- CIESIN (Center for International Earth Science Information Network)
- [Link] Klein Goldewijk, K., Beusen, A., Doelman, J., and Stehfest, E.: Anthropogenic land use estimates for the Holocene – HYDE 3.2, Earth Syst. Sci. Data, 9, 927–953, https://doi.org/10.5194/essd-9-927-2017, 2017.
Human Development Index (HDI)
Statistic composite index of life expectancy, education, and per capita income.
Putagán, Chile CO2 Emissions
Carbon Dioxide (CO2) Emissions Per Capita in Tonnes Per Year
| Location | CO2 Emissions | CO2 Emissions Per Capita | CO2 Emissions Intensity |
|---|---|---|---|
| Putagán, Chile | 2,483 tn | 4.2 tn | 496.5 tons/km² |
| Maule Region | 4,565,743 tn | 4.44 tn | 150.6 tons/km² |
| Chile | 87,296,657 tn | 4.91 tn | 116.1 tons/km² |
| 2013 CO2 emissions (tonnes/year) | 2,483 tn |
| 2013 CO2 emissions (tonnes/year) per capita | 4.2 tn |
| 2013 CO2 emissions intensity (tonnes/km²/year) | 496.5 tons/km² |
Natural Hazards Risk
Relative risk out of 10
| Hazard | Risk Level |
|---|---|
| Drought | High (8) |
| Flood | Medium (7) |
| Earthquake | Medium (7) |
* Risk, particularly concerning flood or landslide, may not be for the entire area.
- Dilley, M., R.S. Chen, U. Deichmann, A.L. Lerner-Lam, M. Arnold, J. Agwe, P. Buys, O. Kjekstad, B. Lyon, and G. Yetman. 2005. Natural Disaster Hotspots: A Global Risk Analysis. Washington, D.C.: World Bank. https://doi.org/10.1596/0-8213-5930-4.
- Center for Hazards and Risk Research - CHRR - Columbia University, Center for International Earth Science Information Network - CIESIN - Columbia University, and International Research Institute for Climate and Society - IRI - Columbia University. 2005. Global Drought Hazard Frequency and Distribution. Palisades, NY: NASA Socioeconomic Data and Applications Center (SEDAC). https://doi.org/10.7927/H4VX0DFT.
- Center for Hazards and Risk Research - CHRR - Columbia University, Center for International Earth Science Information Network - CIESIN - Columbia University. 2005. Global Flood Hazard Frequency and Distribution. Palisades, NY: NASA Socioeconomic Data and Applications Center (SEDAC). https://doi.org/10.7927/H4668B3D.
- Center for Hazards and Risk Research - CHRR - Columbia University, Center for International Earth Science Information Network - CIESIN - Columbia University. 2005. Global Earthquake Hazard Distribution - Peak Ground Acceleration. Palisades, NY: NASA Socioeconomic Data and Applications Center (SEDAC). https://doi.org/10.7927/H4BZ63ZS.
Recent Nearby Earthquakes
Magnitude 3.0 and greater
| Date▼ | Time↕ | Magnitude↕ | Distance↕ | Depth↕ | Location↕ | Link |
|---|---|---|---|---|---|---|
| 8/10/18 | 7:06 AM | 4.3 | 16.4 km | 84,830 m | 12km SW of San Clemente, Chile | usgs.gov |
| 12/19/17 | 1:12 PM | 4.2 | 20.6 km | 101,840 m | 11km E of Linares, Chile | usgs.gov |
| 9/17/17 | 6:36 AM | 4.2 | 10.8 km | 88,680 m | 12km SE of San Javier, Chile | usgs.gov |
| 12/21/14 | 12:36 PM | 4.7 | 4.5 km | 83,100 m | 15km NW of Linares, Chile | usgs.gov |
| 10/20/14 | 10:18 AM | 4.6 | 20.1 km | 91,400 m | 9km SW of San Clemente, Chile | usgs.gov |
| 6/10/13 | 2:29 AM | 4.4 | 23.8 km | 114,400 m | 9km W of San Clemente, Chile | usgs.gov |
| 10/11/11 | 12:10 AM | 4.5 | 13.2 km | 100,400 m | Maule, Chile | usgs.gov |
| 7/29/11 | 11:32 PM | 4.1 | 15.2 km | 10,000 m | Maule, Chile | usgs.gov |
| 1/8/11 | 5:54 AM | 4.5 | 24.3 km | 82,800 m | Maule, Chile | usgs.gov |
| 2/27/10 | 9:34 AM | 4.4 | 21 km | 35,000 m | Maule, Chile | usgs.gov |
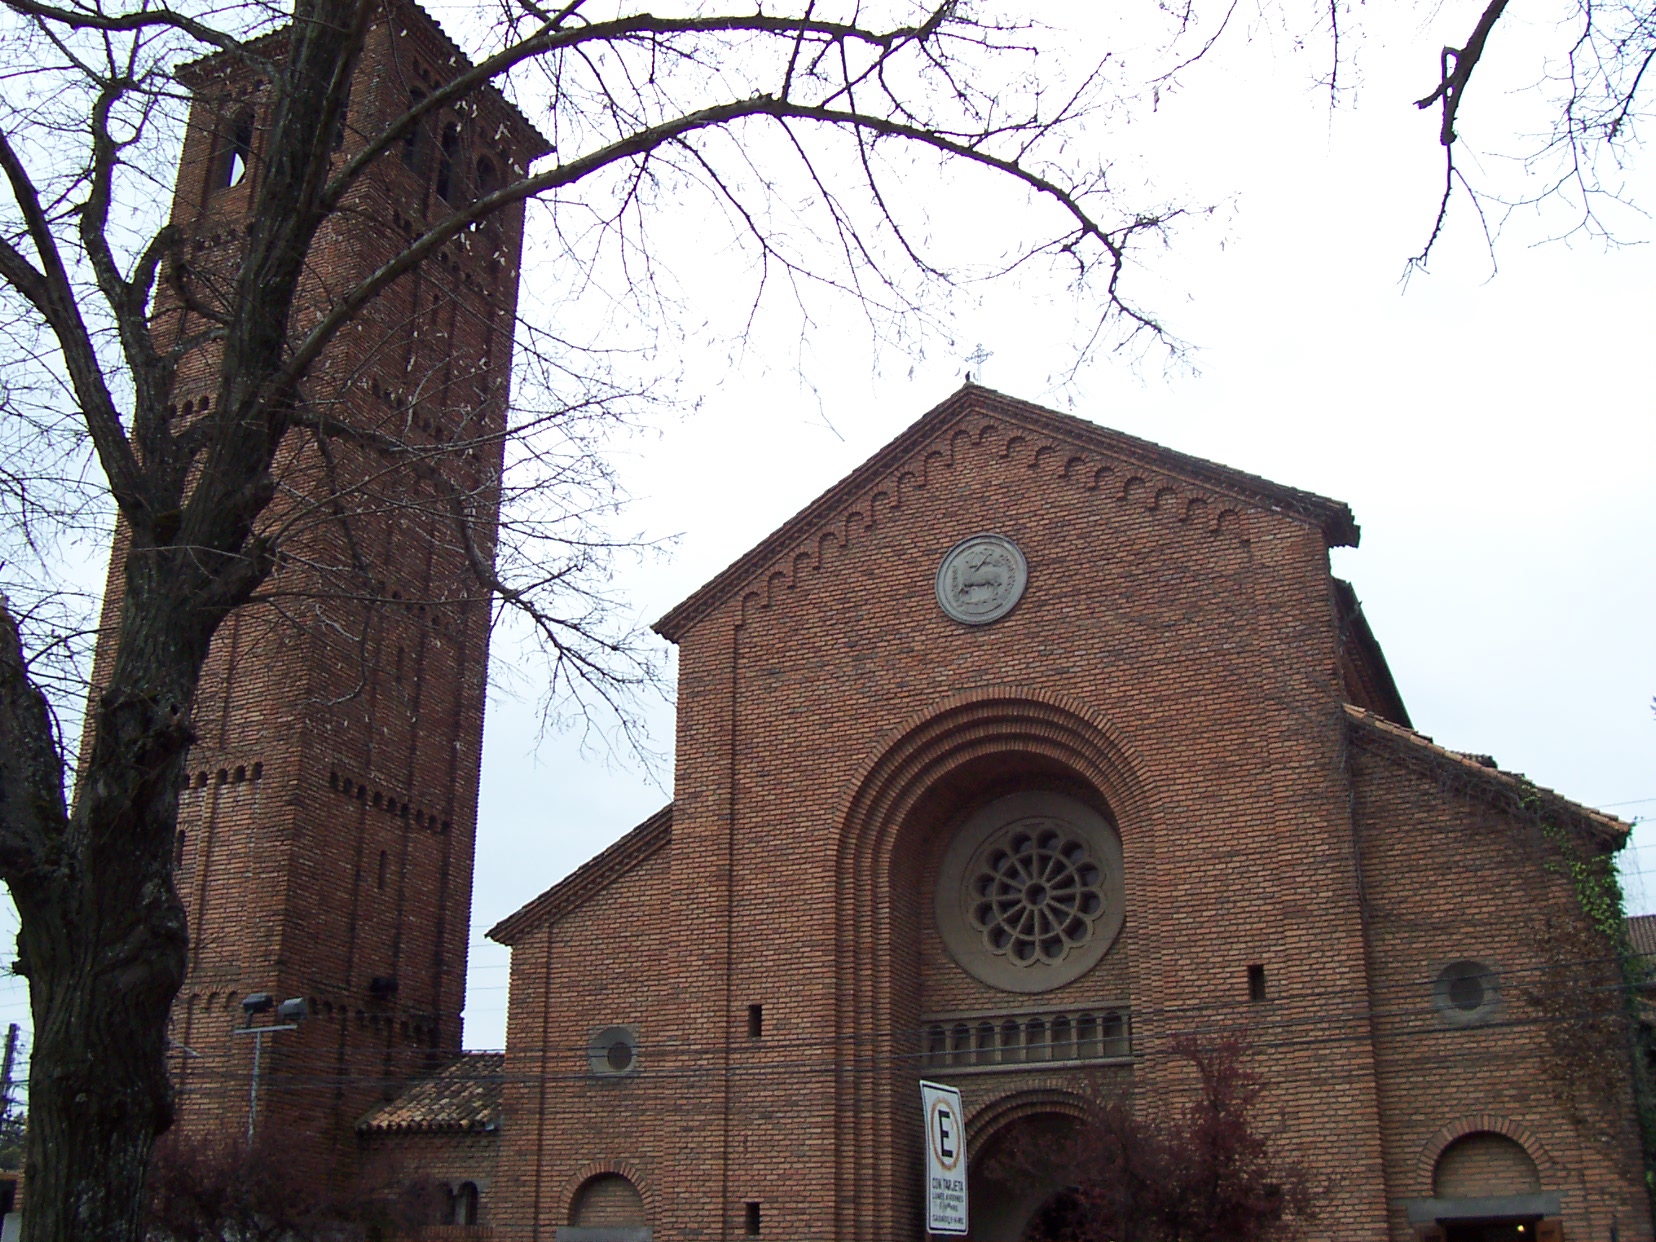
Putagán, Chile
Putagán (in mapudungun: "water stream") is a village in the Chilean municipality of Villa Alegre, Province of Linares, Maule Region. Pop. 622. Altitude (meters) 112. Time zone (est) UTC−4(-3DT). Located 292 Kilometers (182 miles) south from Santiago..
Putagán, Chile Wikipedia Page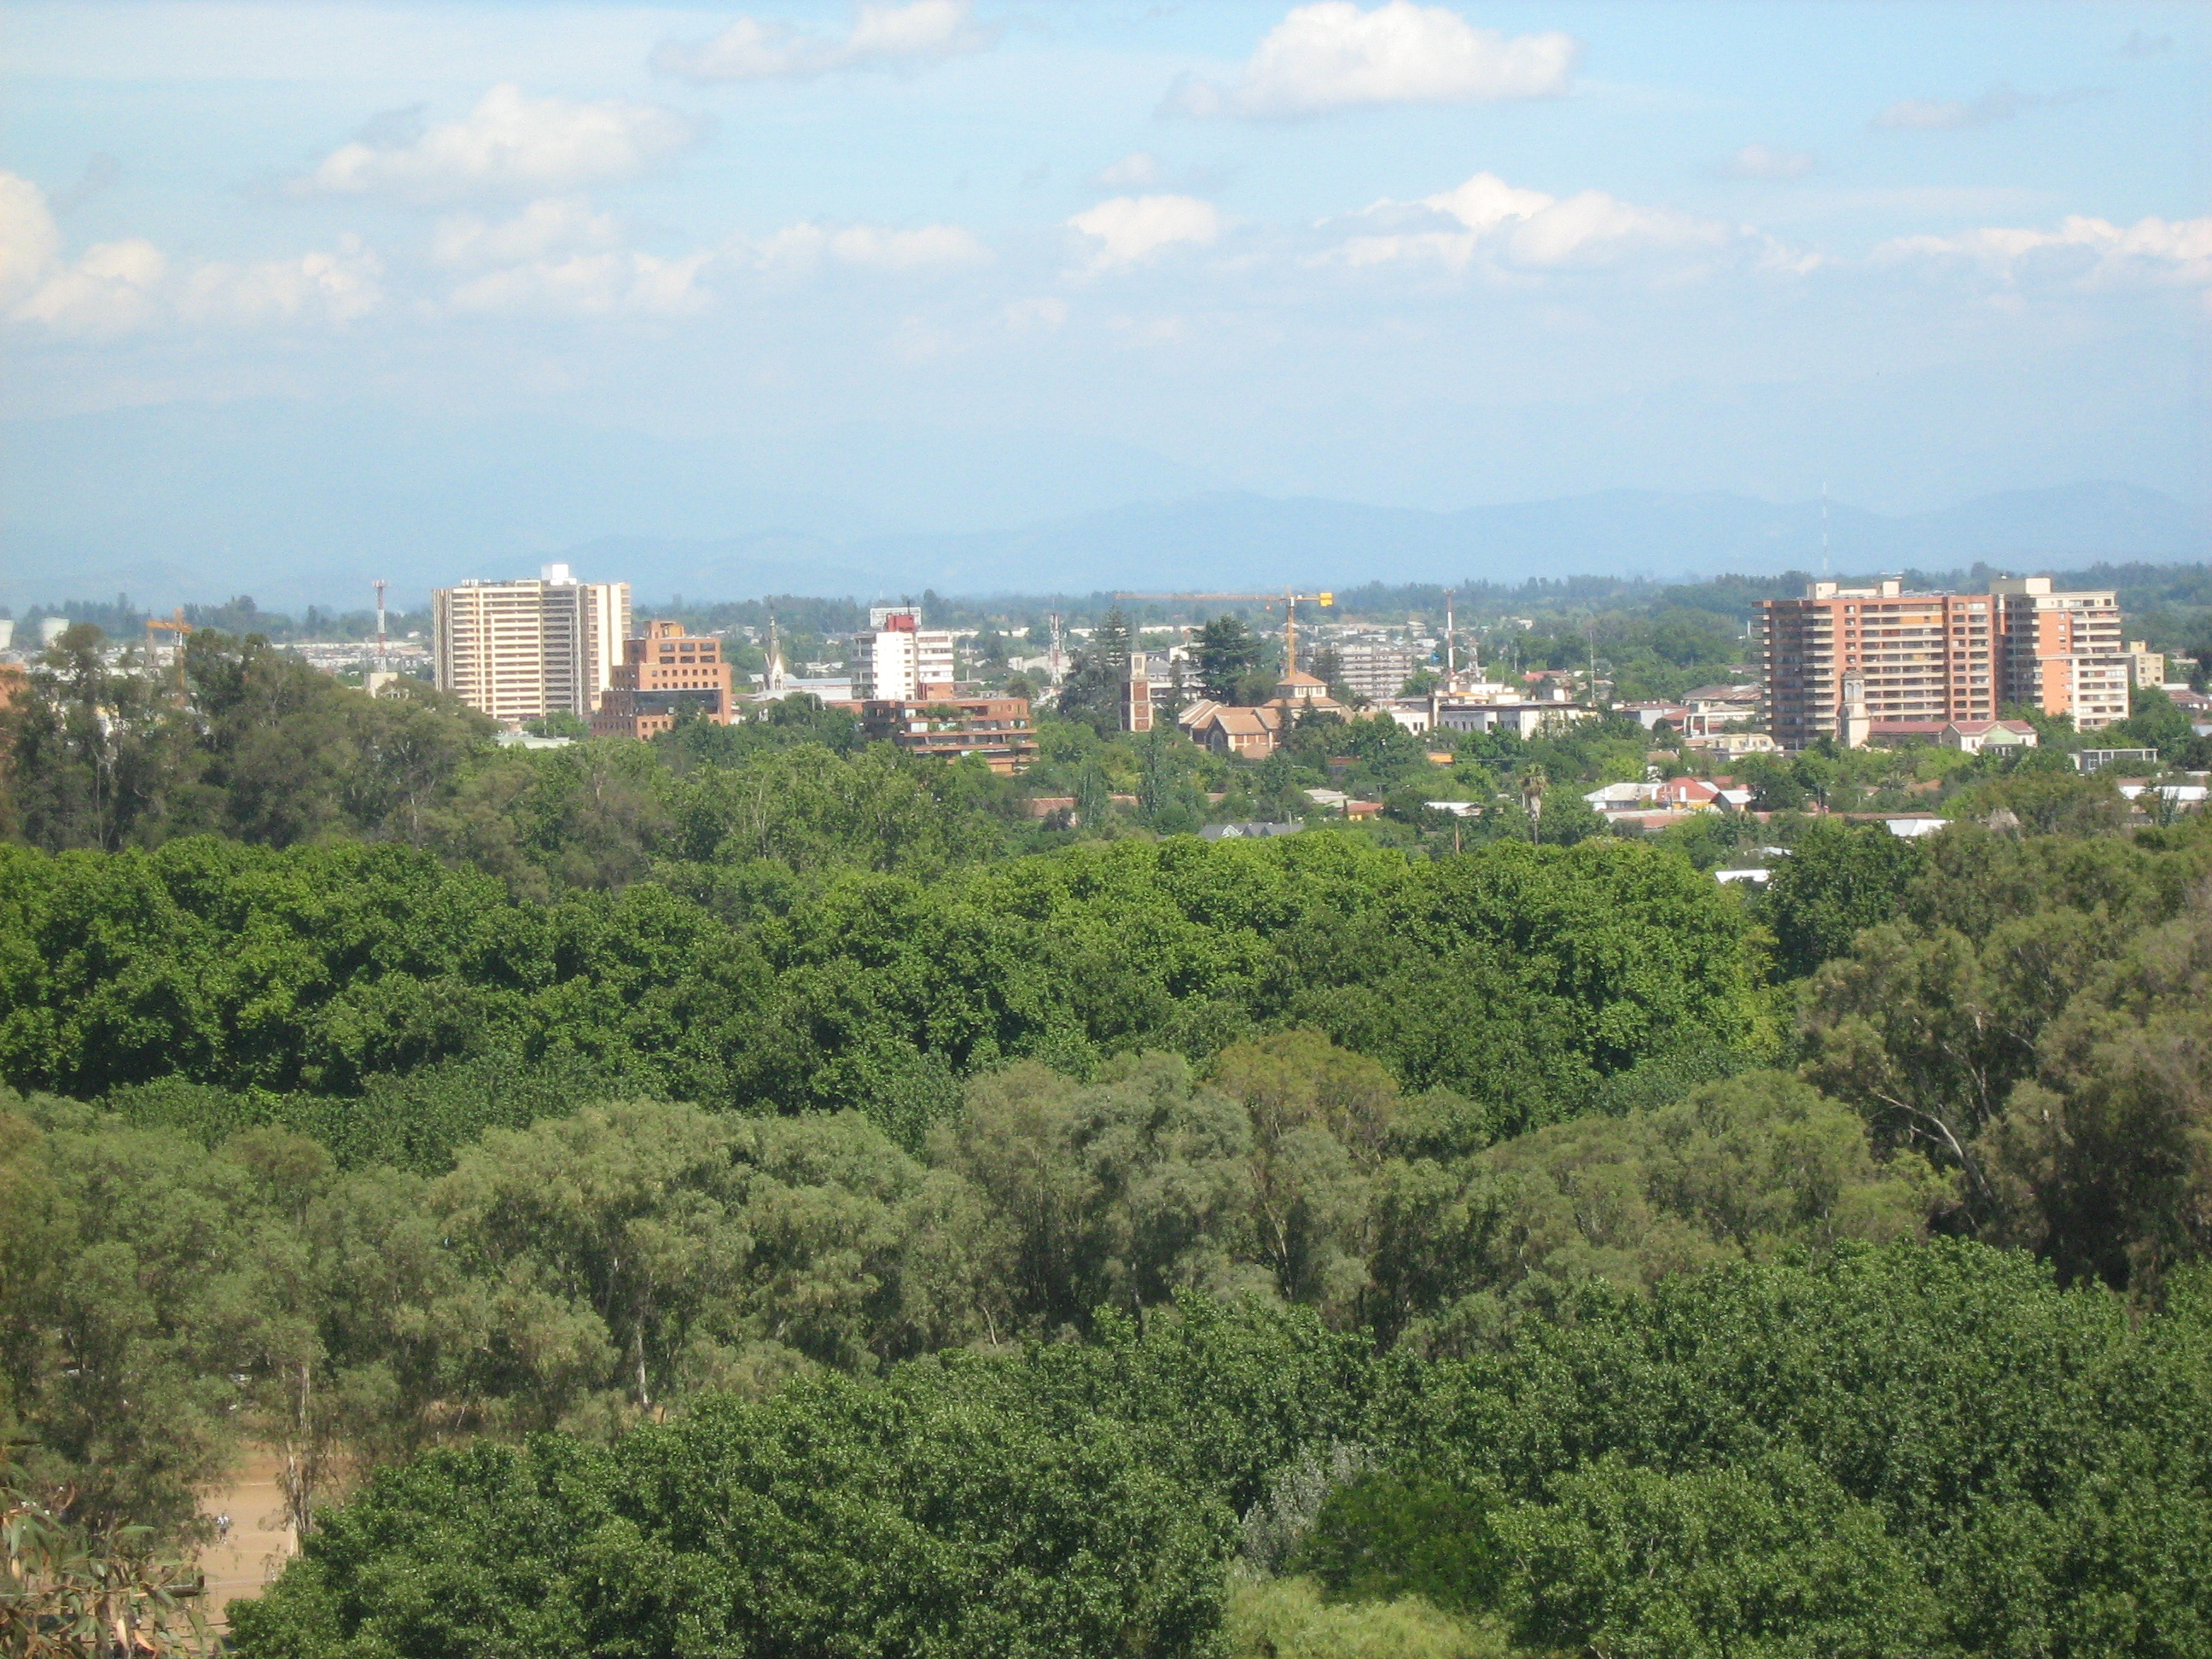

About Our Data
The data on this page is estimated using a number of publicly available tools and resources. It is provided without warranty, and could contain inaccuracies. Use at your own risk.