Categories in San Javier, Chile
Industries
Business Distribution by Industry in San Javier, Chile
| Industry Description | Number of Establishments | Average Google Rating |
|---|---|---|
| Restaurants | 40 | 3.8 |
| Shopping | 36 | 4 |
| Sports and recreation | 28 | 4.1 |
| Construction of houses | 18 | 3.6 |
| Education | 17 | 3.9 |
| Grocery stores and supermarkets | 15 | 4 |
| Winery | 14 | 4.1 |
| Bars, pubs and taverns | 13 | — |
| Fast food restaurants | 12 | 3.6 |
| Hospitals | 10 | 3.9 |
| Pharmacies and drug stores | 10 | 3.3 |
| Construction of buildings | 9 | 5 |
| Department stores | 9 | 4 |
| Clothing stores | 8 | 3.6 |
| Public administration | 8 | 5 |
| Higher education (colleges and universities) | 8 | 4.4 |
| Fitness centers | 8 | — |
| Loan companies | 7 | 3.9 |
| All food and beverage | 7 | 4 |
| Banks | 7 | 4 |
| Dentists | 6 | — |
| Police and law enforcement | 6 | 4 |
| American restaurants | 6 | — |
| Internet cafes | 6 | 5 |
| Creative arts | 6 | — |
San Javier, Chile Facts
| Area | 51.5 km² |
| Population | 33,938 |
| Male Population | 17,016 (50.1%) |
| Female Population | 16,922 (49.9%) |
| Population change (1975 to 2020) | +35.3% |
| Population change (2000 to 2020) | +2.9% |
| Median Age | 32.2 years (Male: 32, Female: 32.5) |
| Area Codes | 73 |
| Local Time | |
| Timezone | Chile Standard Time |
| Lat & Lng | -35.59520, -71.72924 |
| Postal Codes | 3660000 |
Map of San Javier, Chile
Interactive Map
San Javier, Chile Population
Years 1975 to 2020
| Data | 1975 | 1990 | 2000 | 2015 | 2020 |
|---|---|---|---|---|---|
| Population | 25,087 | 32,230 | 32,970 | 32,317 | 33,938 |
| Population Density | 487.1 / km² | 625.8 / km² | 640.2 / km² | 627.5 / km² | 659 / km² |
San Javier, Chile Population change from 2000 to 2015
Decrease of 2% from year 2000 to 2015
| Location | Change since 1975 | Change since 1990 | Change since 2000 |
|---|---|---|---|
| San Javier, Chile | +28.8% | +0.3% | -2% |
| Maule Region | +82.5% | +32.8% | +13.2% |
| Chile | +72.2% | +36.6% | +18.3% |
San Javier, Chile Median Age
Median Age: 32.2 years
| Location | Median Age | Median Age (Female) | Median Age (Male) |
|---|---|---|---|
| San Javier, Chile | 32.2 yrs | 32.5 yrs | 32 yrs |
| Maule Region | 32.1 yrs | 32.6 yrs | 31.6 yrs |
| Chile | 31.3 yrs | 32 yrs | 30.6 yrs |
San Javier, Chile Population Density
Population Density: 659 / km²
| Location | Population | Area | Density |
|---|---|---|---|
| San Javier, Chile | 33,938 | 51.5 km² | 659 / km² |
| Maule Region | 1 million | 30,309.7 km² | 33.9 / km² |
| Chile | 17.8 million | 751,744.8 km² | 23.7 / km² |
San Javier, Chile Historical and Projected Population
Estimated Population from 0 to 2100
- JRC (European Commission's Joint Research Centre) work on the GHS built-up grid
- CIESIN (Center for International Earth Science Information Network)
- [Link] Klein Goldewijk, K., Beusen, A., Doelman, J., and Stehfest, E.: Anthropogenic land use estimates for the Holocene – HYDE 3.2, Earth Syst. Sci. Data, 9, 927–953, https://doi.org/10.5194/essd-9-927-2017, 2017.
Price Distribution
Business distribution by price for San Javier, Chile
Human Development Index (HDI)
Statistic composite index of life expectancy, education, and per capita income.
San Javier, Chile CO2 Emissions
Carbon Dioxide (CO2) Emissions Per Capita in Tonnes Per Year
| Location | CO2 Emissions | CO2 Emissions Per Capita | CO2 Emissions Intensity |
|---|---|---|---|
| San Javier, Chile | 146,020 tn | 4.3 tn | 2,835.3 tons/km² |
| Maule Region | 4,565,743 tn | 4.44 tn | 150.6 tons/km² |
| Chile | 87,296,657 tn | 4.91 tn | 116.1 tons/km² |
| 2013 CO2 emissions (tonnes/year) | 146,020 tn |
| 2013 CO2 emissions (tonnes/year) per capita | 4.3 tn |
| 2013 CO2 emissions intensity (tonnes/km²/year) | 2,835.3 tons/km² |
Natural Hazards Risk
Relative risk out of 10
| Hazard | Risk Level |
|---|---|
| Drought | High (8) |
| Flood | Medium (7) |
| Earthquake | Medium (7) |
| Landslide | Medium (7) |
* Risk, particularly concerning flood or landslide, may not be for the entire area.
- Dilley, M., R.S. Chen, U. Deichmann, A.L. Lerner-Lam, M. Arnold, J. Agwe, P. Buys, O. Kjekstad, B. Lyon, and G. Yetman. 2005. Natural Disaster Hotspots: A Global Risk Analysis. Washington, D.C.: World Bank. https://doi.org/10.1596/0-8213-5930-4.
- Center for Hazards and Risk Research - CHRR - Columbia University, Center for International Earth Science Information Network - CIESIN - Columbia University, and Norwegian Geotechnical Institute - NGI. 2005. Global Landslide Hazard Distribution. Palisades, NY: NASA Socioeconomic Data and Applications Center (SEDAC). https://doi.org/10.7927/H4P848VZ.
- Center for Hazards and Risk Research - CHRR - Columbia University, Center for International Earth Science Information Network - CIESIN - Columbia University, and International Research Institute for Climate and Society - IRI - Columbia University. 2005. Global Drought Hazard Frequency and Distribution. Palisades, NY: NASA Socioeconomic Data and Applications Center (SEDAC). https://doi.org/10.7927/H4VX0DFT.
- Center for Hazards and Risk Research - CHRR - Columbia University, Center for International Earth Science Information Network - CIESIN - Columbia University. 2005. Global Flood Hazard Frequency and Distribution. Palisades, NY: NASA Socioeconomic Data and Applications Center (SEDAC). https://doi.org/10.7927/H4668B3D.
- Center for Hazards and Risk Research - CHRR - Columbia University, Center for International Earth Science Information Network - CIESIN - Columbia University. 2005. Global Earthquake Hazard Distribution - Peak Ground Acceleration. Palisades, NY: NASA Socioeconomic Data and Applications Center (SEDAC). https://doi.org/10.7927/H4BZ63ZS.
Recent Nearby Earthquakes
Magnitude 3.0 and greater
| Date▼ | Time↕ | Magnitude↕ | Distance↕ | Depth↕ | Location↕ | Link |
|---|---|---|---|---|---|---|
| 5/7/19 | 12:50 AM | 3.9 | 19.3 km | 98,260 m | 4km WNW of San Clemente, Chile | usgs.gov |
| 8/10/18 | 7:06 AM | 4.3 | 14.6 km | 84,830 m | 12km SW of San Clemente, Chile | usgs.gov |
| 9/17/17 | 6:36 AM | 4.2 | 11.4 km | 88,680 m | 12km SE of San Javier, Chile | usgs.gov |
| 5/20/17 | 9:11 AM | 4.2 | 25.1 km | 86,060 m | 6km NNE of Talca, Chile | usgs.gov |
| 7/6/16 | 1:19 PM | 4.4 | 14.8 km | 14,240 m | 12km W of San Javier, Chile | usgs.gov |
| 7/15/15 | 4:29 PM | 3.8 | 27.8 km | 63,200 m | 9km NNW of Talca, Chile | usgs.gov |
| 12/21/14 | 12:36 PM | 4.7 | 15.9 km | 83,100 m | 15km NW of Linares, Chile | usgs.gov |
| 10/20/14 | 10:18 AM | 4.6 | 15.9 km | 91,400 m | 9km SW of San Clemente, Chile | usgs.gov |
| 6/28/14 | 5:23 PM | 4 | 18.9 km | 111,700 m | 2km ESE of Talca, Chile | usgs.gov |
| 6/10/13 | 2:29 AM | 4.4 | 13.8 km | 114,400 m | 9km W of San Clemente, Chile | usgs.gov |
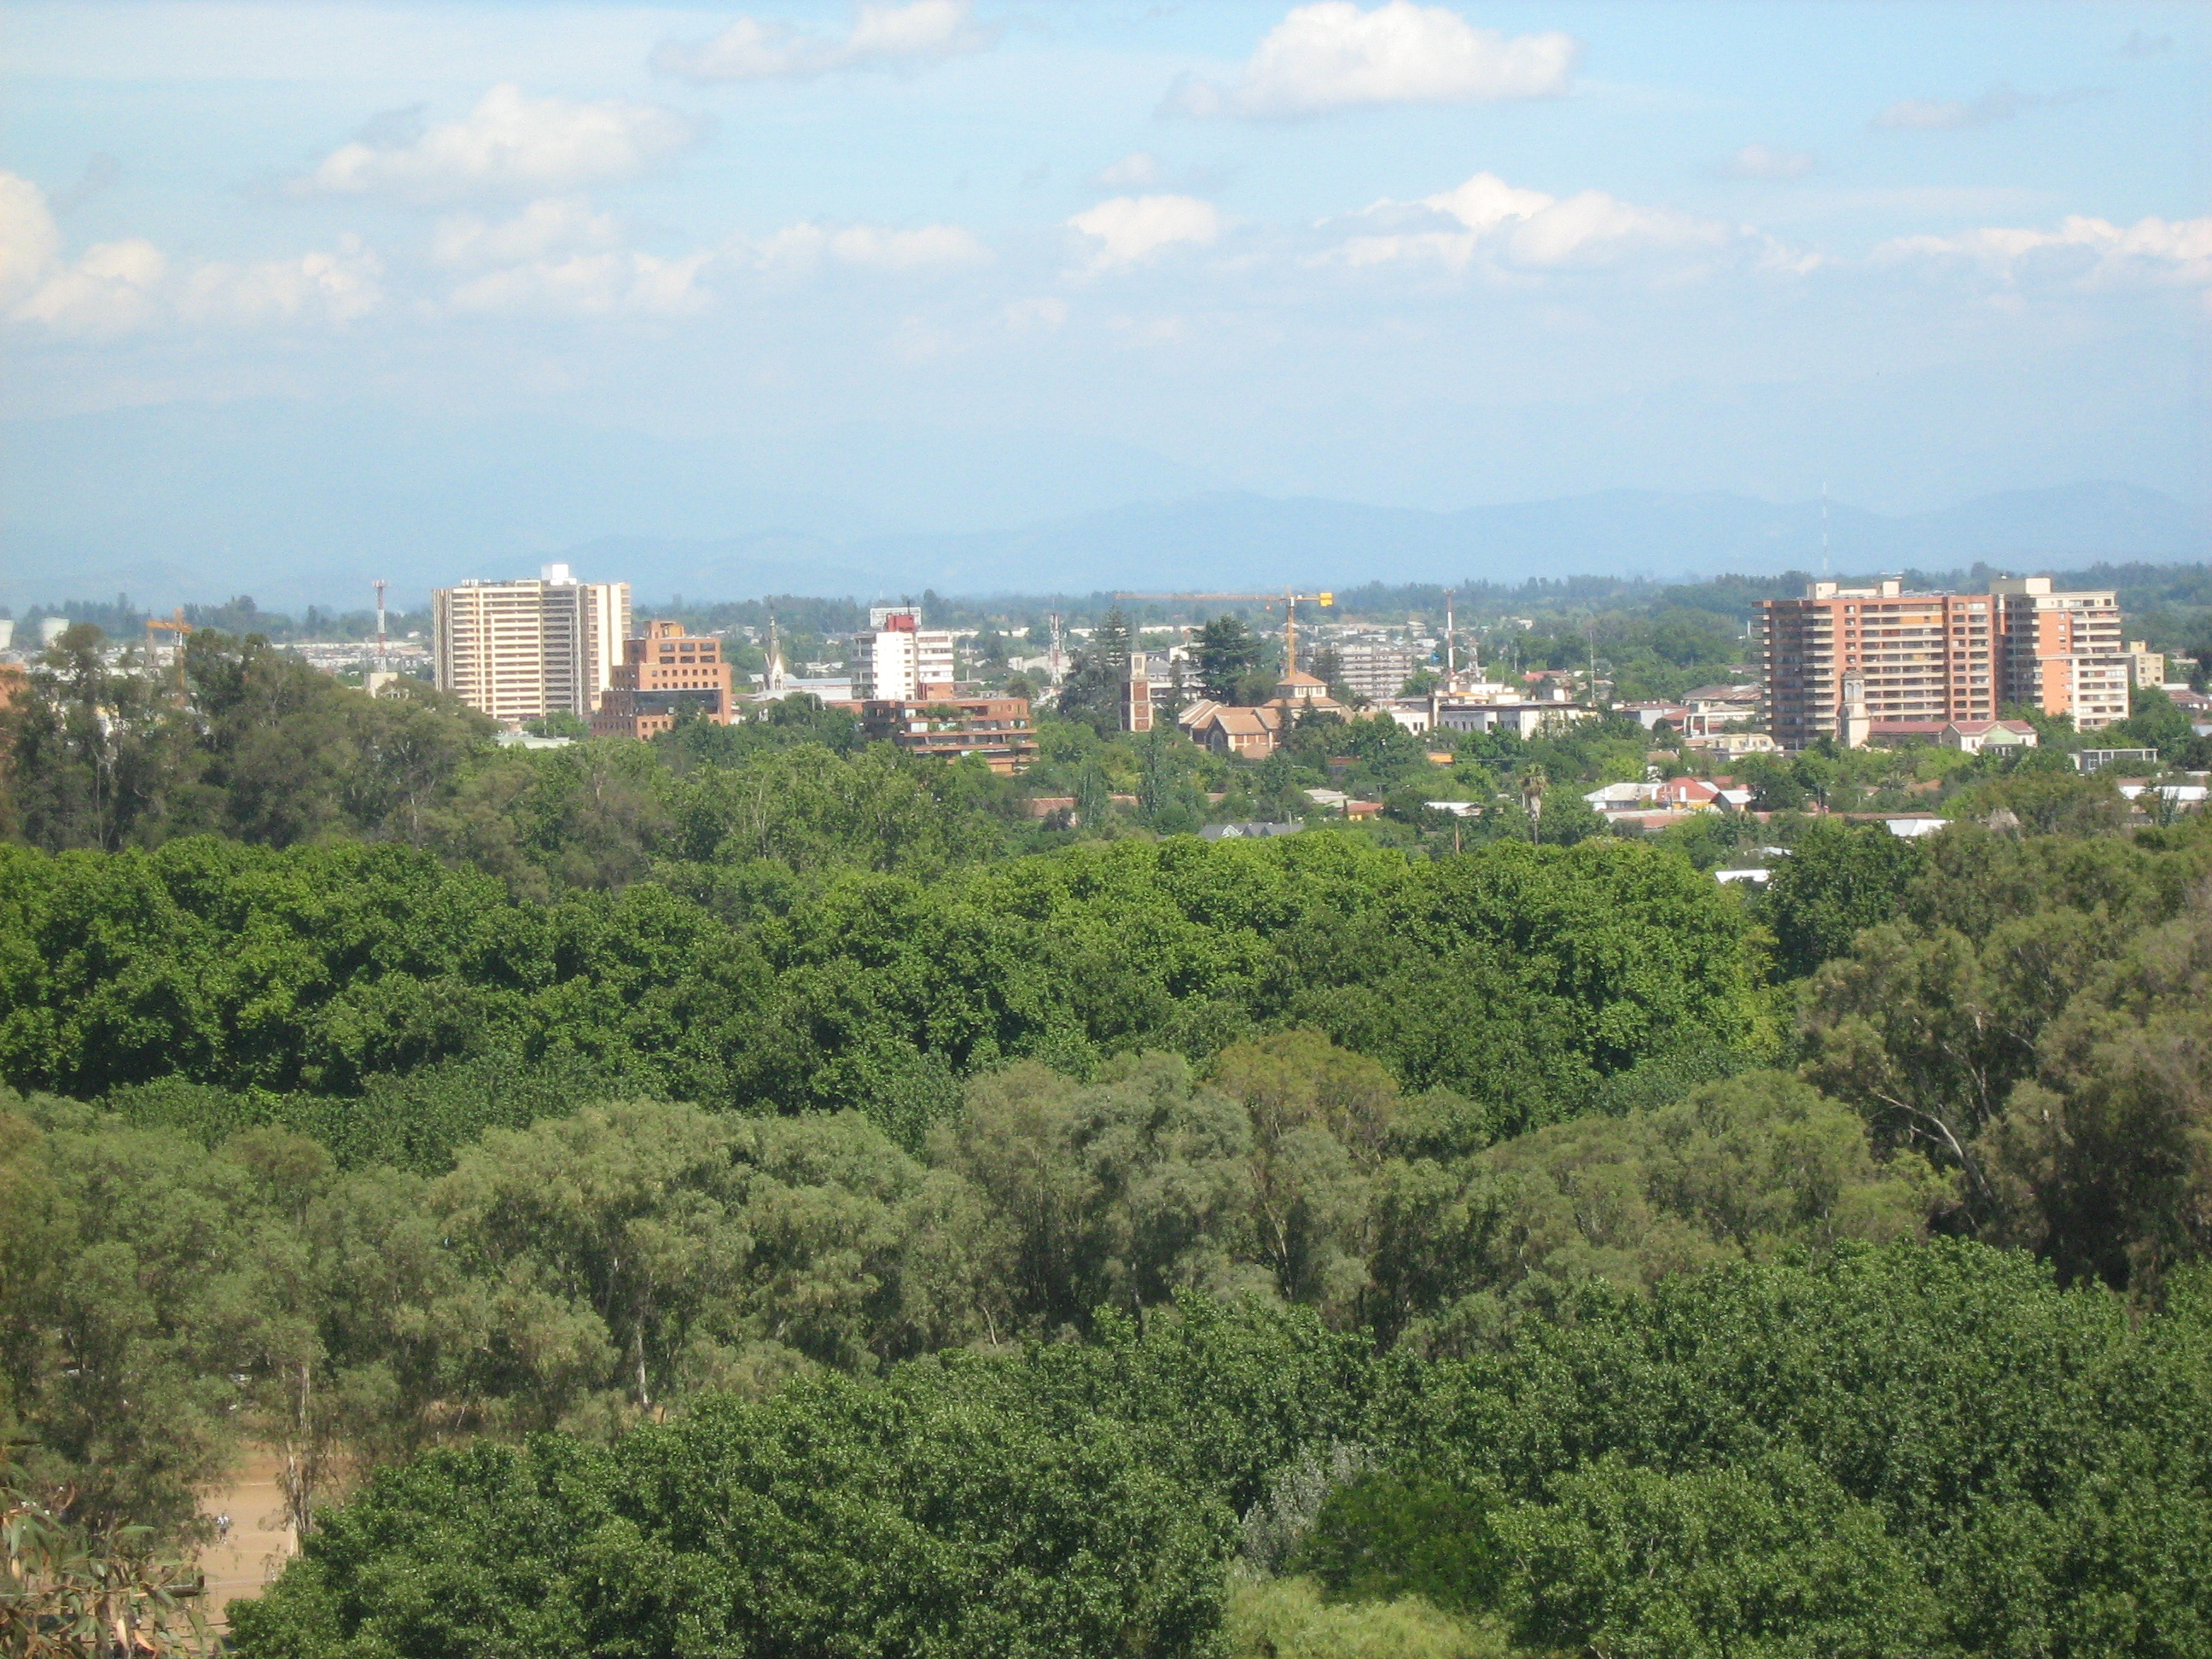
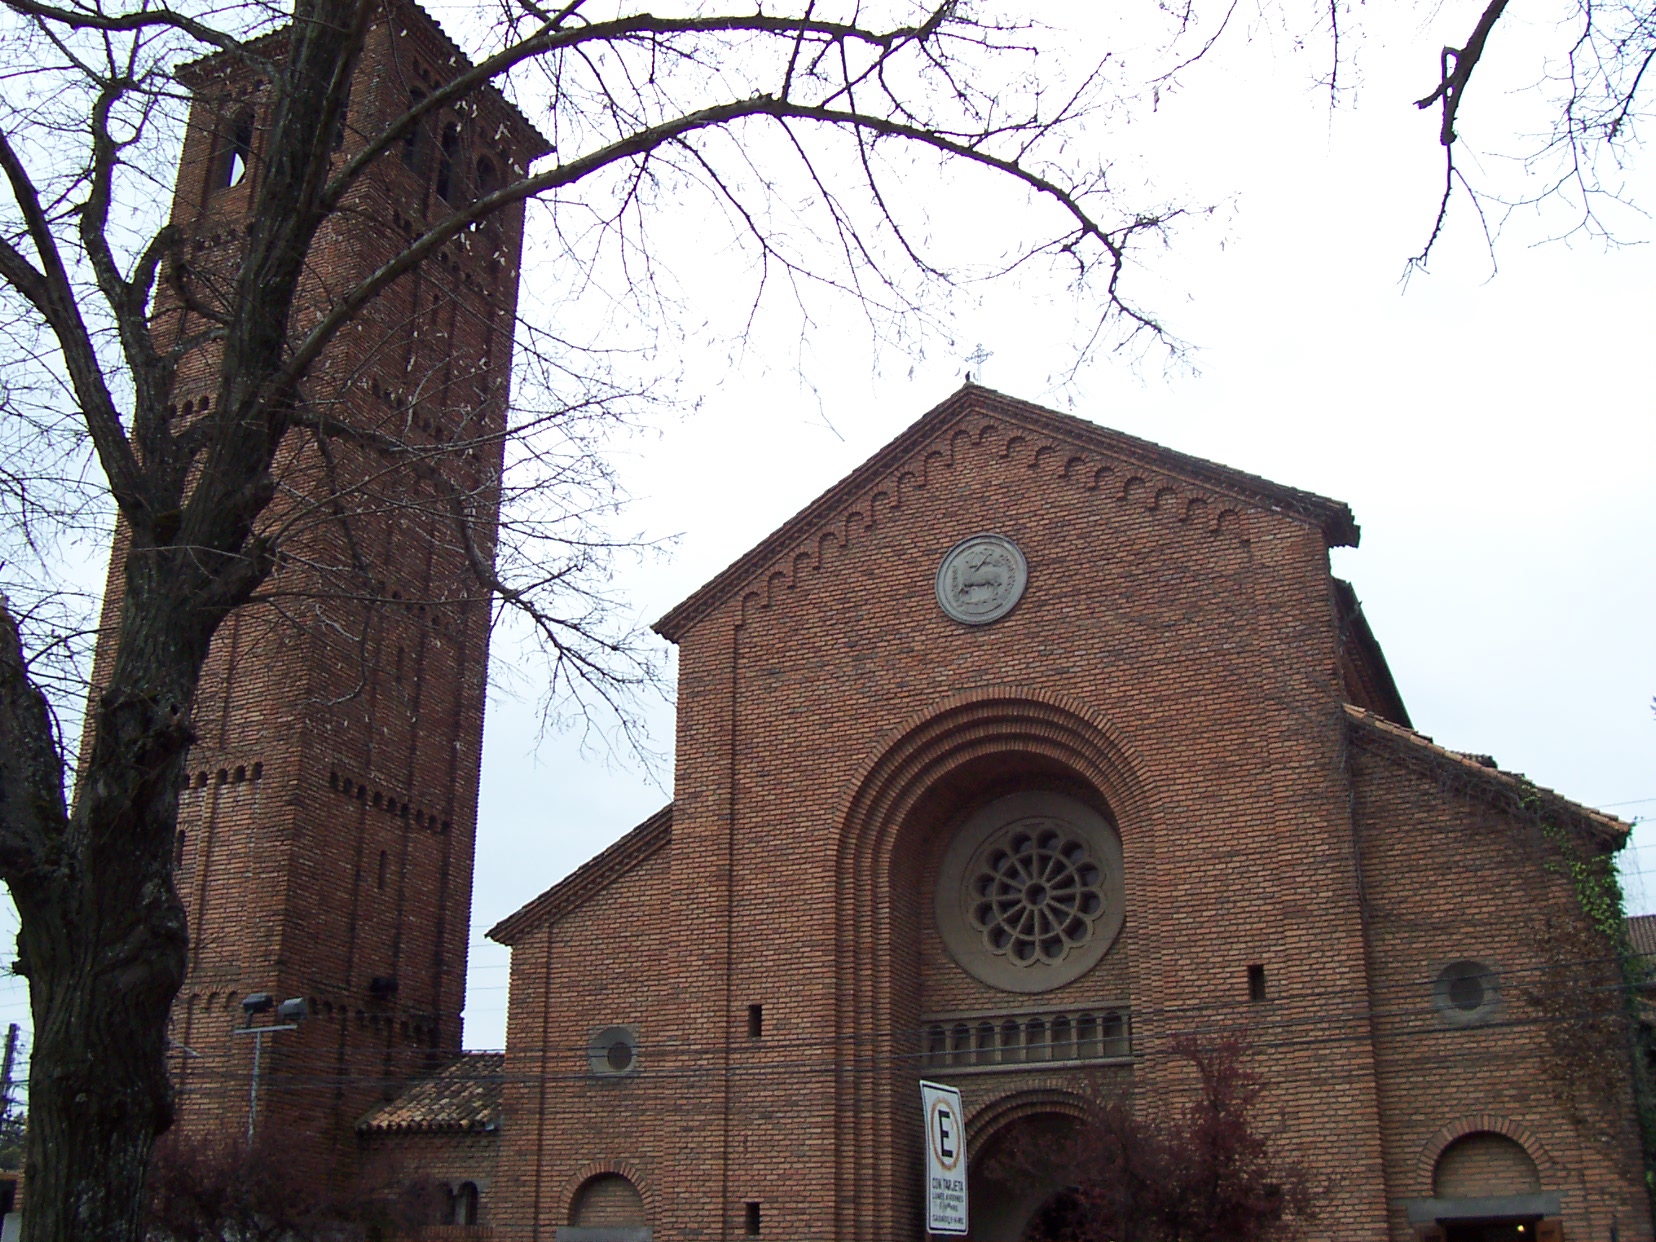
San Javier, Chile
San Javier (Spanish pronunciation: [saŋ xaˈβjer]) is a Chilean city and commune located in the Province of Linares, Maule Region. The city lies in the geographical center of the country, some 270 km (168 mi) south of Santiago, 31 km (19 mi) to the no..
San Javier, Chile Wikipedia Page

About Our Data
The data on this page is estimated using a number of publicly available tools and resources. It is provided without warranty, and could contain inaccuracies. Use at your own risk.