Xingping Facts
| Area | 5.7 km² |
| Population | 13,349 |
| Male Population | 6,866 (51.4%) |
| Female Population | 6,483 (48.6%) |
| Population change (1975 to 2020) | +40.0% |
| Population change (2000 to 2020) | +2.7% |
| Median Age | 36.8 years (Male: 35.6, Female: 37.9) |
| Local Time | |
| Timezone | China Standard Time |
| Lat & Lng | 34.30000, 108.48694 |
Map of Xingping
Interactive Map
Xingping Population
Years 1975 to 2020
| Data | 1975 | 1990 | 2000 | 2015 | 2020 |
|---|---|---|---|---|---|
| Population | 9,538 | 12,164 | 12,995 | 12,981 | 13,349 |
| Population Density | 1,677 / km² | 2,138.7 / km² | 2,284.8 / km² | 2,282.4 / km² | 2,347.1 / km² |
Xingping Population change from 2000 to 2015
Decrease of 0.1% from year 2000 to 2015
| Location | Change since 1975 | Change since 1990 | Change since 2000 |
|---|---|---|---|
| Xingping | +36.1% | +6.7% | -0.1% |
| Shaanxi | +46.3% | +14.3% | +4.9% |
| China | +51.5% | +18.9% | +8.2% |
Xingping Median Age
Median Age: 36.8 years
| Location | Median Age | Median Age (Female) | Median Age (Male) |
|---|---|---|---|
| Xingping | 36.8 yrs | 37.9 yrs | 35.6 yrs |
| Shaanxi | 35.8 yrs | 36.2 yrs | 35.4 yrs |
| China | 36 yrs | 36.4 yrs | 35.6 yrs |
Xingping Population Density
Population Density: 2,347 / km²
| Location | Population | Area | Density |
|---|---|---|---|
| Xingping | 13,349 | 5.7 km² | 2,347 / km² |
| Shaanxi | 38 million | 205,541.3 km² | 185 / km² |
| China | 1,361.3 million | 9,342,862.4 km² | 146 / km² |
Xingping Historical and Projected Population
Estimated Population from 1730 to 2100
- JRC (European Commission's Joint Research Centre) work on the GHS built-up grid
- CIESIN (Center for International Earth Science Information Network)
- [Link] Klein Goldewijk, K., Beusen, A., Doelman, J., and Stehfest, E.: Anthropogenic land use estimates for the Holocene – HYDE 3.2, Earth Syst. Sci. Data, 9, 927–953, https://doi.org/10.5194/essd-9-927-2017, 2017.
Human Development Index (HDI)
Statistic composite index of life expectancy, education, and per capita income.
Xingping CO2 Emissions
Carbon Dioxide (CO2) Emissions Per Capita in Tonnes Per Year
| Location | CO2 Emissions | CO2 Emissions Per Capita | CO2 Emissions Intensity |
|---|---|---|---|
| Xingping | 85,360 tn | 6.39 tn | 15,008.4 tons/km² |
| Shaanxi | 227,790,962 tn | 6 tn | 1,108.2 tons/km² |
| China | 11,912,486,467 tn | 8.75 tn | 1,275 tons/km² |
| 2013 CO2 emissions (tonnes/year) | 85,360 tn |
| 2013 CO2 emissions (tonnes/year) per capita | 6.39 tn |
| 2013 CO2 emissions intensity (tonnes/km²/year) | 15,008.4 tons/km² |
Natural Hazards Risk
Relative risk out of 10
| Hazard | Risk Level |
|---|---|
| Drought | Low (2) |
| Earthquake | Low (2) |
* Risk, particularly concerning flood or landslide, may not be for the entire area.
- Dilley, M., R.S. Chen, U. Deichmann, A.L. Lerner-Lam, M. Arnold, J. Agwe, P. Buys, O. Kjekstad, B. Lyon, and G. Yetman. 2005. Natural Disaster Hotspots: A Global Risk Analysis. Washington, D.C.: World Bank. https://doi.org/10.1596/0-8213-5930-4.
- Center for Hazards and Risk Research - CHRR - Columbia University, Center for International Earth Science Information Network - CIESIN - Columbia University, and International Research Institute for Climate and Society - IRI - Columbia University. 2005. Global Drought Hazard Frequency and Distribution. Palisades, NY: NASA Socioeconomic Data and Applications Center (SEDAC). https://doi.org/10.7927/H4VX0DFT.
- Center for Hazards and Risk Research - CHRR - Columbia University, Center for International Earth Science Information Network - CIESIN - Columbia University. 2005. Global Earthquake Hazard Distribution - Peak Ground Acceleration. Palisades, NY: NASA Socioeconomic Data and Applications Center (SEDAC). https://doi.org/10.7927/H4BZ63ZS.
Recent Nearby Earthquakes
Magnitude 3.0 and greater
| Date▼ | Time↕ | Magnitude↕ | Distance↕ | Depth↕ | Location↕ | Link |
|---|---|---|---|---|---|---|
| 11/4/09 | 11:31 PM | 4.8 | 74 km | 10,000 m | Shaanxi, China | usgs.gov |
| 1/5/98 | 1:36 AM | 4.3 | 55.5 km | 21,800 m | Shaanxi, China | usgs.gov |
| 1/6/88 | 5:47 AM | 4.7 | 19.8 km | 10,000 m | Shaanxi, China | usgs.gov |
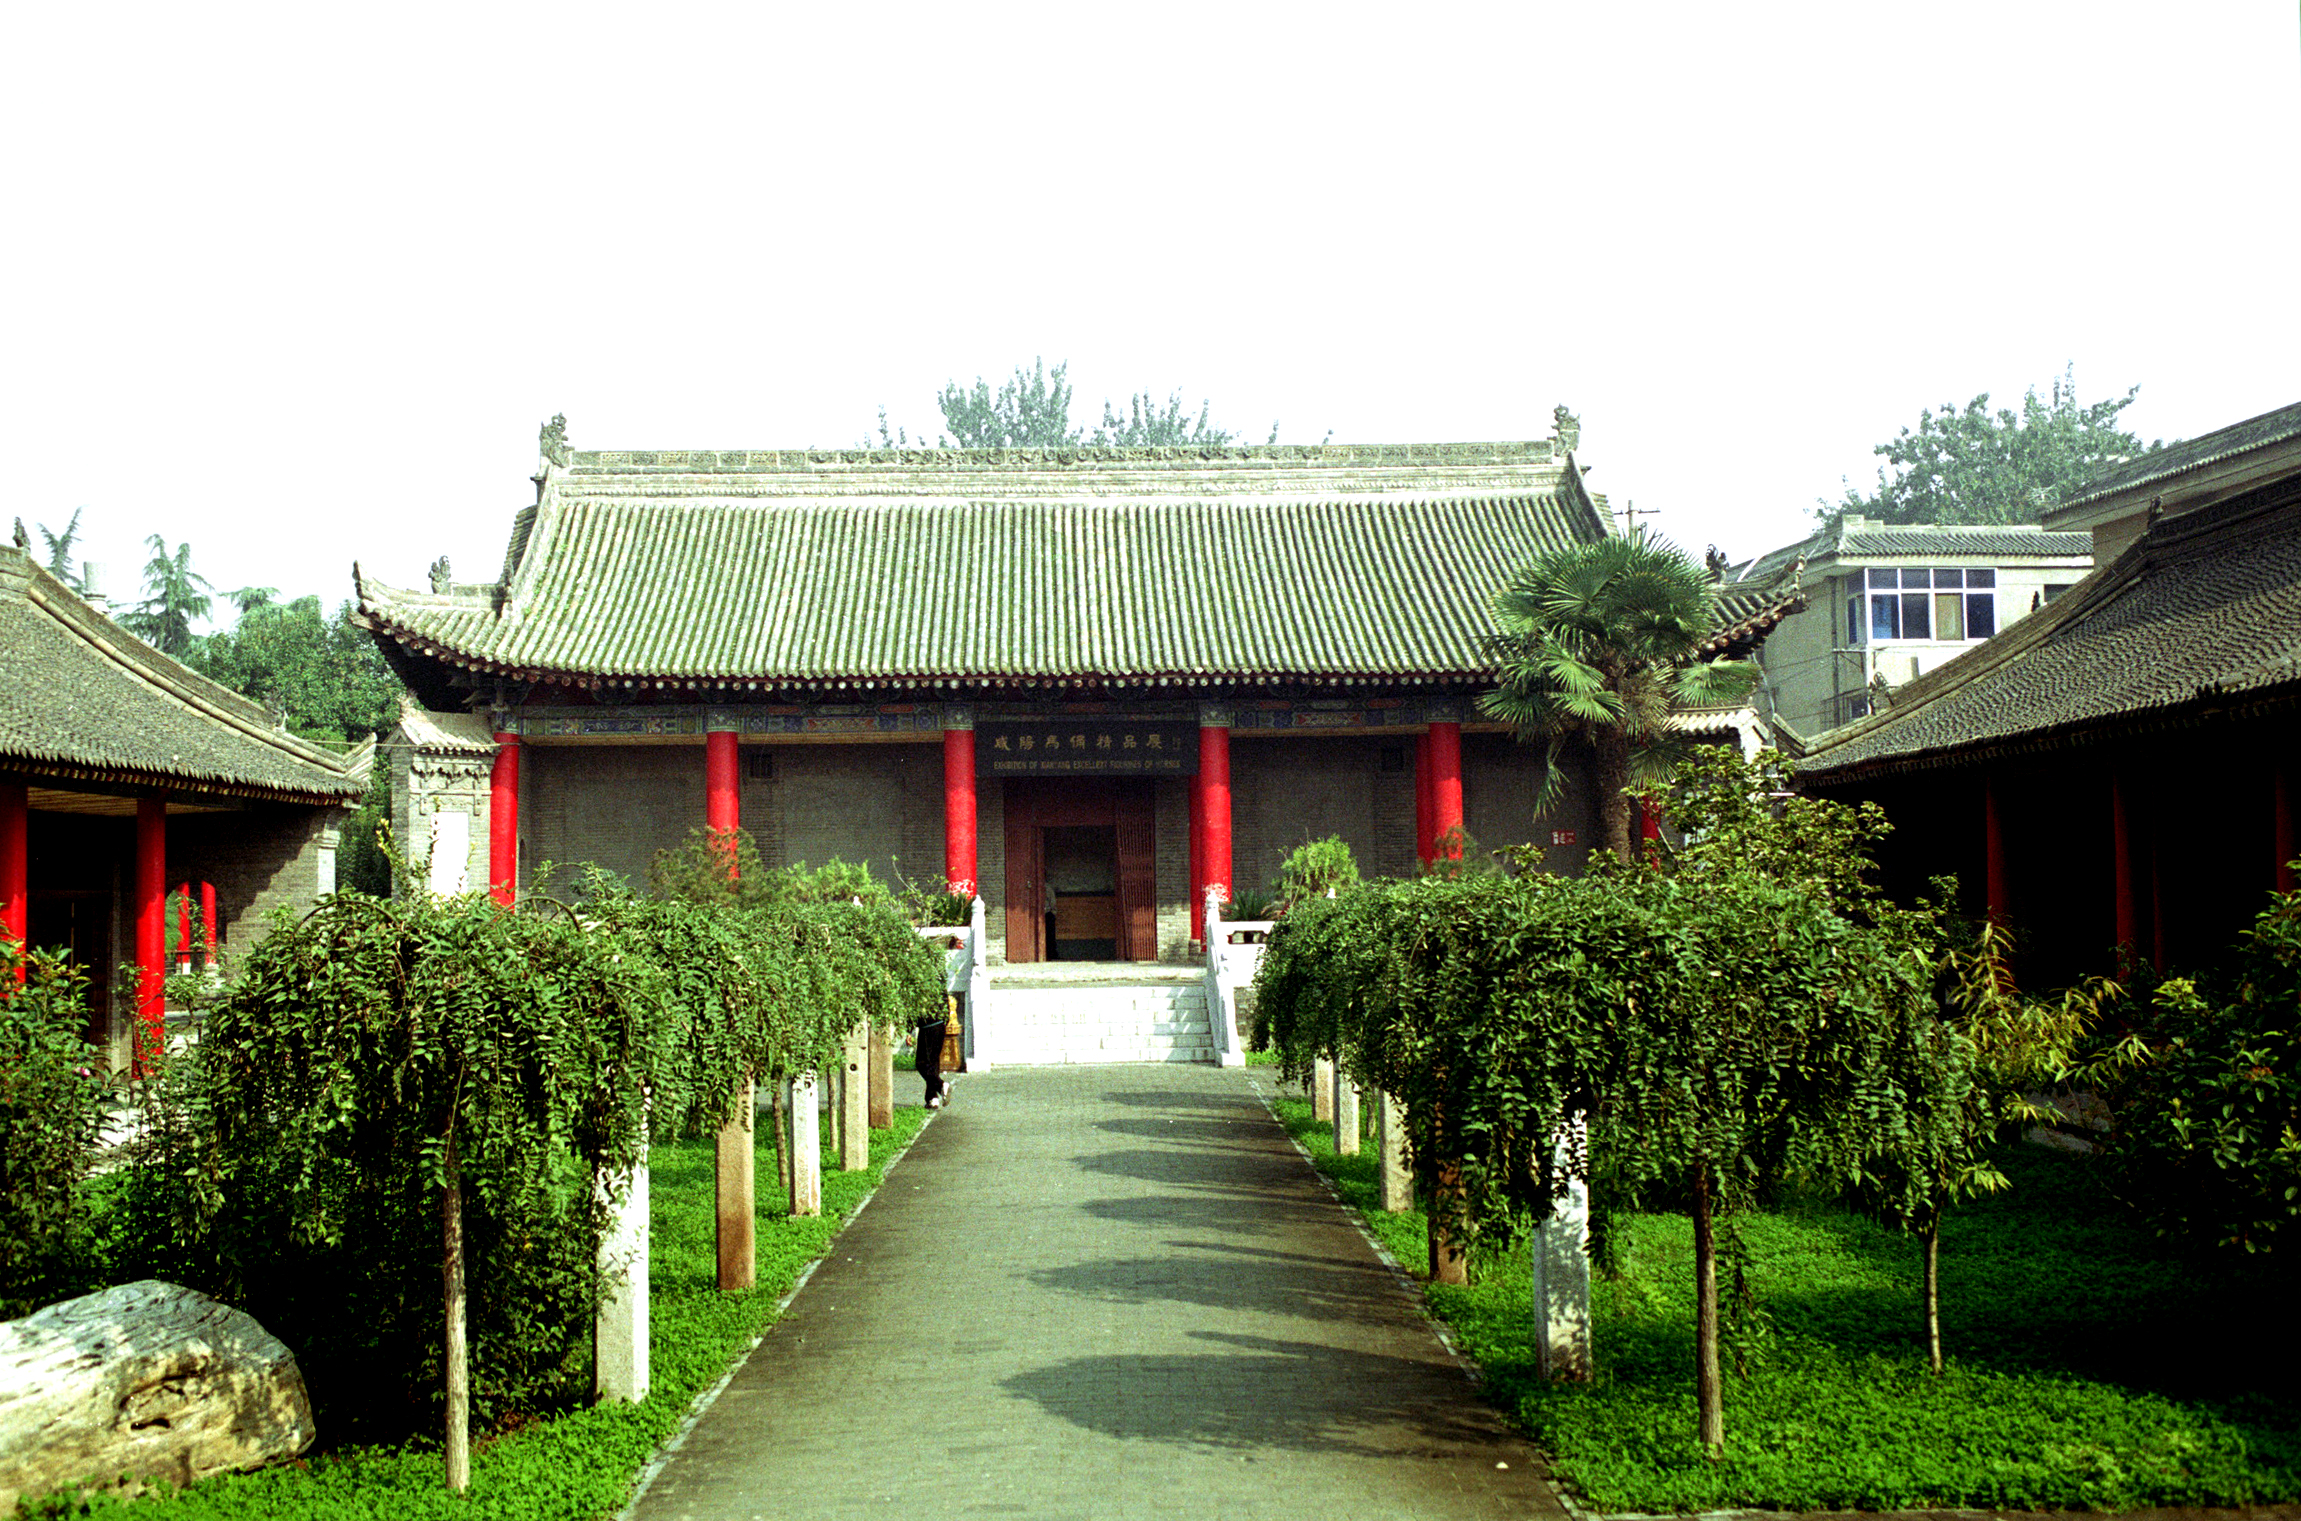
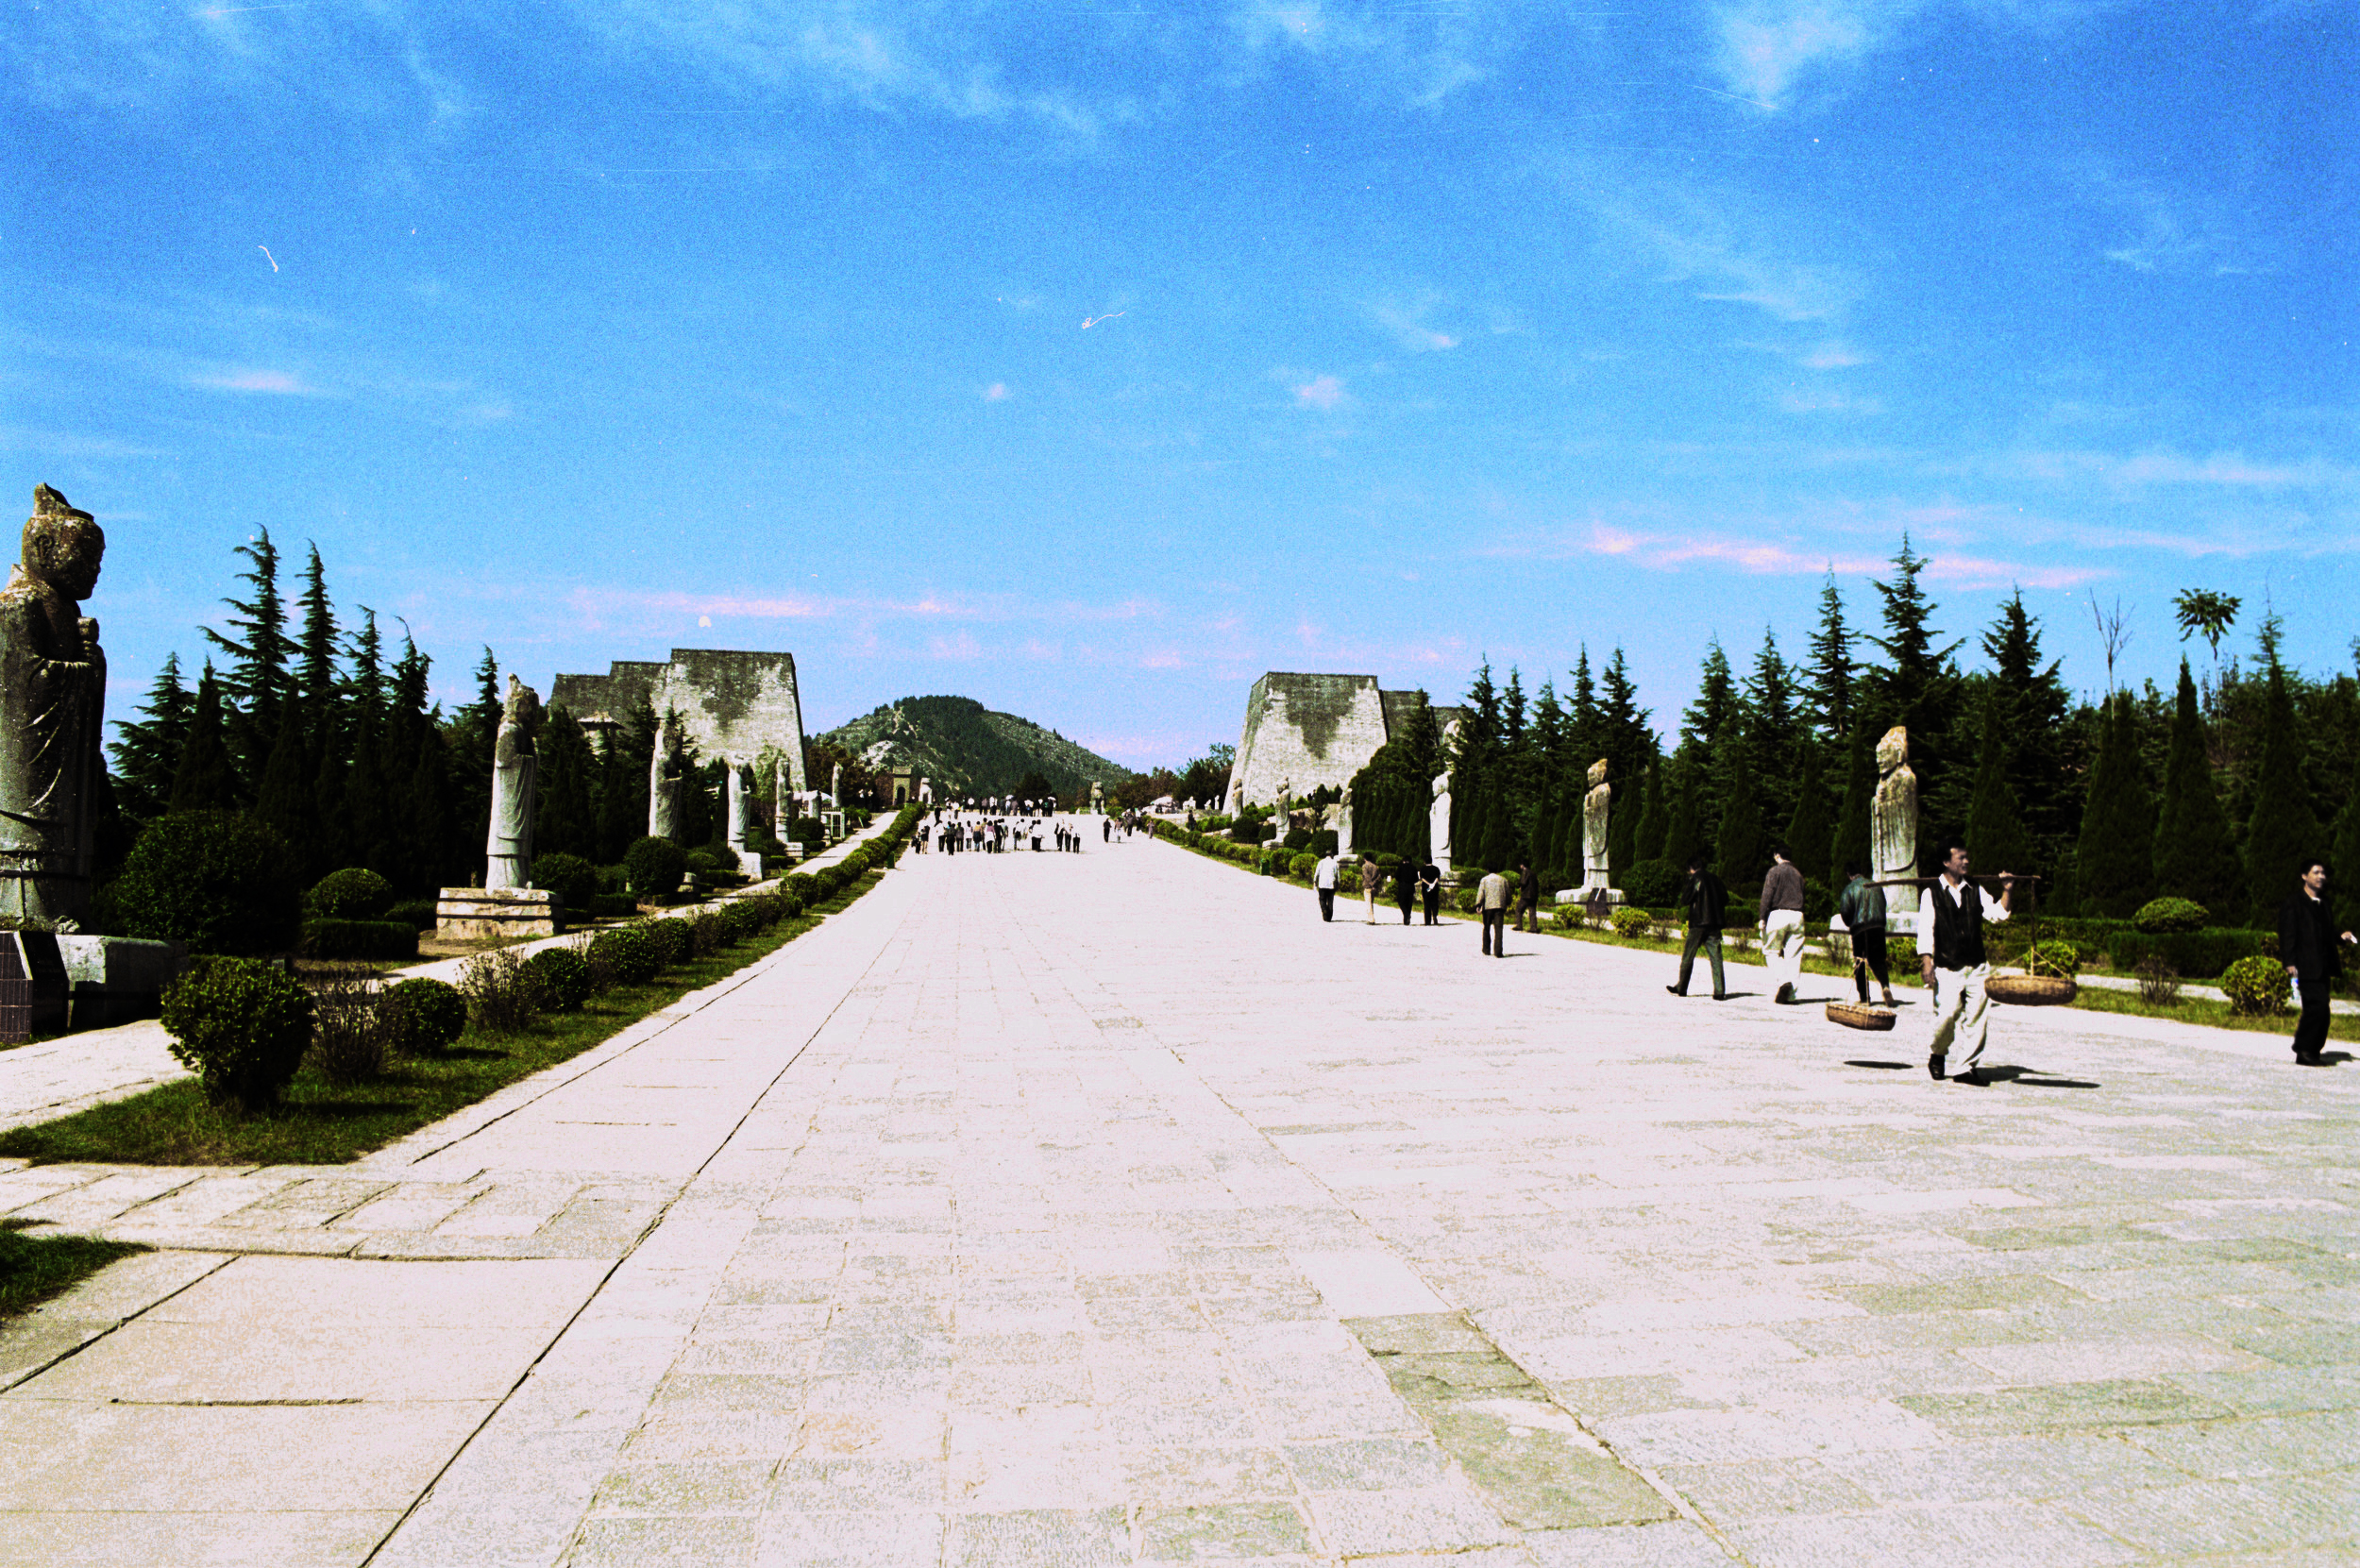
Xingping
Xingping is a city located in the center part of Shaanxi, China. It became a city since 1993 with a total area of 496 square kilometers and a population of 620,000. The annual average temperature is 13.1 ℃ and its annual precipitation of 585 mm. At p..
Xingping Wikipedia Page
About Our Data
The data on this page is estimated using a number of publicly available tools and resources. It is provided without warranty, and could contain inaccuracies. Use at your own risk.