Categories in Labranzagrande
Labranzagrande Facts
| Area | 516.1 km² |
| Population | 5,047 |
| Male Population | 2,521 (50.0%) |
| Female Population | 2,526 (50.0%) |
| Population change (1975 to 2020) | +5.9% |
| Population change (2000 to 2020) | -8.6% |
| Median Age | 25.3 years (Male: 24.4, Female: 26.2) |
| Local Time | |
| Timezone | Colombia Standard Time |
| Lat & Lng | 5.56223, -72.57499 |
| Postal Codes | 151840, 151847 |
Map of Labranzagrande
Interactive Map
Labranzagrande Population
Years 1975 to 2020
| Data | 1975 | 1990 | 2000 | 2015 | 2020 |
|---|---|---|---|---|---|
| Population | 4,764 | 5,519 | 5,522 | 4,884 | 5,047 |
| Population Density | 9.2 / km² | 10.7 / km² | 10.7 / km² | 9.5 / km² | 9.8 / km² |
Sources: JRC (European Commission's Joint Research Centre) work on the GHS built-up grid
Labranzagrande Population change from 2000 to 2015
Decrease of 11.6% from year 2000 to 2015
| Location | Change since 1975 | Change since 1990 | Change since 2000 |
|---|---|---|---|
| Labranzagrande | +2.5% | -11.5% | -11.6% |
| Boyacá Department | +0.2% | -5% | -4.8% |
| Colombia | +94.6% | +40.7% | +19.4% |
Sources: JRC (European Commission's Joint Research Centre) work on the GHS built-up grid
Labranzagrande Median Age
Median Age: 25.3 years
| Location | Median Age | Median Age (Female) | Median Age (Male) |
|---|---|---|---|
| Labranzagrande | 25.3 yrs | 26.2 yrs | 24.4 yrs |
| Boyacá Department | 25.4 yrs | 26.3 yrs | 24.5 yrs |
| Colombia | 24.9 yrs | 25.8 yrs | 24.1 yrs |
Sources: CIESIN (Center for International Earth Science Information Network)
Labranzagrande Population Density
Population Density: 9.8 / km²
| Location | Population | Area | Density |
|---|---|---|---|
| Labranzagrande | 5,047 | 516.1 km² | 9.8 / km² |
| Boyacá Department | 1.2 million | 23,199.7 km² | 52.4 / km² |
| Colombia | 47.8 million | 1,136,620.4 km² | 42.1 / km² |
Sources: JRC (European Commission's Joint Research Centre) work on the GHS built-up grid
Labranzagrande Historical and Projected Population
Estimated Population from 0 to 2100
Sources:
- JRC (European Commission's Joint Research Centre) work on the GHS built-up grid
- CIESIN (Center for International Earth Science Information Network)
- [Link] Klein Goldewijk, K., Beusen, A., Doelman, J., and Stehfest, E.: Anthropogenic land use estimates for the Holocene – HYDE 3.2, Earth Syst. Sci. Data, 9, 927–953, https://doi.org/10.5194/essd-9-927-2017, 2017.
Human Development Index (HDI)
Statistic composite index of life expectancy, education, and per capita income.
Source: [Link] Kummu, M., Taka, M. &Guillaume, J. Gridded global datasets for Gross Domestic Product and Human Development Index over 1990–2015. Sci Data 5, 180004 (2018) doi:10.1038/sdata.2018.4
Labranzagrande CO2 Emissions
Carbon Dioxide (CO2) Emissions Per Capita in Tonnes Per Year
| Location | CO2 Emissions | CO2 Emissions Per Capita | CO2 Emissions Intensity |
|---|---|---|---|
| Labranzagrande | 13,232 tn | 2.62 tn | 25.6 tons/km² |
| Boyacá Department | 3,192,155 tn | 2.62 tn | 137.6 tons/km² |
| Colombia | 116,035,326 tn | 2.43 tn | 102.1 tons/km² |
Sources: [Link] Moran, D., Kanemoto K; Jiborn, M., Wood, R., Többen, J., and Seto, K.C. (2018) Carbon footprints of 13,000 cities. Environmental Research Letters DOI: 10.1088/1748-9326/aac72a
Labranzagrande CO2 Emissions
| 2013 CO2 emissions (tonnes/year) | 13,232 tn |
| 2013 CO2 emissions (tonnes/year) per capita | 2.62 tn |
| 2013 CO2 emissions intensity (tonnes/km²/year) | 25.6 tons/km² |
Natural Hazards Risk
Relative risk out of 10
| Hazard | Risk Level |
|---|---|
| Flood | High (9) |
| Earthquake | Medium (7) |
| Landslide | High (8) |
* Risk, particularly concerning flood or landslide, may not be for the entire area.
Sources:
- Dilley, M., R.S. Chen, U. Deichmann, A.L. Lerner-Lam, M. Arnold, J. Agwe, P. Buys, O. Kjekstad, B. Lyon, and G. Yetman. 2005. Natural Disaster Hotspots: A Global Risk Analysis. Washington, D.C.: World Bank. https://doi.org/10.1596/0-8213-5930-4.
- Center for Hazards and Risk Research - CHRR - Columbia University, Center for International Earth Science Information Network - CIESIN - Columbia University, and Norwegian Geotechnical Institute - NGI. 2005. Global Landslide Hazard Distribution. Palisades, NY: NASA Socioeconomic Data and Applications Center (SEDAC). https://doi.org/10.7927/H4P848VZ.
- Center for Hazards and Risk Research - CHRR - Columbia University, Center for International Earth Science Information Network - CIESIN - Columbia University. 2005. Global Flood Hazard Frequency and Distribution. Palisades, NY: NASA Socioeconomic Data and Applications Center (SEDAC). https://doi.org/10.7927/H4668B3D.
- Center for Hazards and Risk Research - CHRR - Columbia University, Center for International Earth Science Information Network - CIESIN - Columbia University. 2005. Global Earthquake Hazard Distribution - Peak Ground Acceleration. Palisades, NY: NASA Socioeconomic Data and Applications Center (SEDAC). https://doi.org/10.7927/H4BZ63ZS.
Recent Nearby Earthquakes
Magnitude 3.0 and greater
| Date▼ | Time↕ | Magnitude↕ | Distance↕ | Depth↕ | Location↕ | Link |
|---|---|---|---|---|---|---|
| 7/14/19 | 4:21 PM | 4.3 | 84.2 km | 175,580 m | 25km WNW of Cerinza, Colombia | usgs.gov |
| 3/9/19 | 11:33 PM | 4.4 | 83.2 km | 10,000 m | 12km N of Sabanalarga, Colombia | usgs.gov |
| 12/13/18 | 9:28 AM | 4.8 | 79.2 km | 10,000 m | 9km S of Paez, Colombia | usgs.gov |
| 11/9/18 | 11:11 AM | 4.3 | 97.6 km | 190,130 m | 3km NE of Tipacoque, Colombia | usgs.gov |
| 10/25/18 | 5:25 AM | 4.4 | 48.1 km | 47,890 m | 6km SW of Aguazul, Colombia | usgs.gov |
| 3/16/17 | 3:38 PM | 5.2 | 74.1 km | 17,470 m | 17km NNW of Ubala, Colombia | usgs.gov |
| 1/8/16 | 2:55 PM | 4.5 | 33.1 km | 35,000 m | 11km NNE of Aguazul, Colombia | usgs.gov |
| 8/10/15 | 4:59 PM | 4.4 | 30.1 km | 10,000 m | 13km N of Aguazul, Colombia | usgs.gov |
| 5/16/15 | 9:00 AM | 4.4 | 39.7 km | 10,000 m | 8km SSW of Aquitania, Colombia | usgs.gov |
| 3/11/14 | 1:57 PM | 4.7 | 42.5 km | 10,000 m | 11km WSW of Pajarito, Colombia | usgs.gov |
Source: U.S. Geological Survey (USGS)
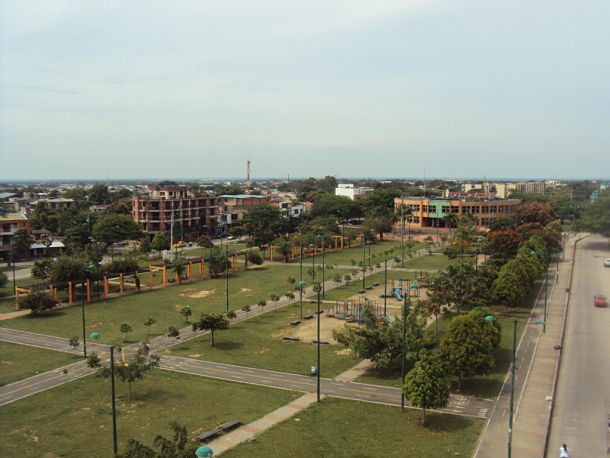
Labranzagrande
Labranzagrande is a town and municipality in the Colombian Department of Boyacá, part of the subregion of the La Libertad Province.
Labranzagrande Wikipedia Page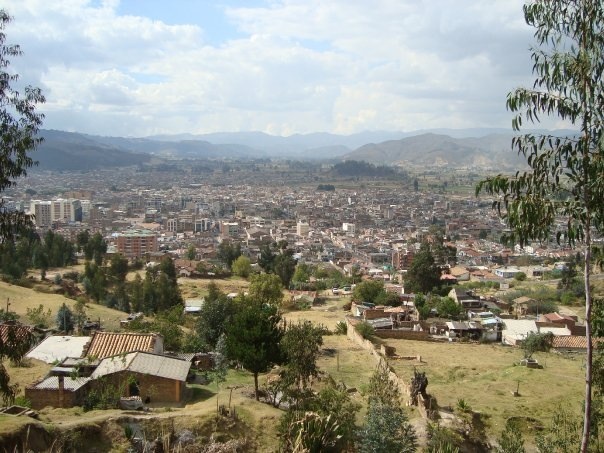

About Our Data
The data on this page is estimated using a number of publicly available tools and resources. It is provided without warranty, and could contain inaccuracies. Use at your own risk.