Categories in Tipacoque
Industries
Business Distribution by Industry in Tipacoque
| Industry Description | Number of Establishments |
|---|---|
| Restaurants | 8 |
Tipacoque Facts
| Area | 55.1 km² |
| Population | 2,606 |
| Male Population | 1,301 (49.9%) |
| Female Population | 1,305 (50.1%) |
| Population change (1975 to 2020) | -50.5% |
| Population change (2000 to 2020) | -39.1% |
| Median Age | 25.4 years (Male: 24.5, Female: 26.3) |
| GDP per capita (PPP) | $11,550 (2022) |
| Local Time | |
| Timezone | Colombia Standard Time |
| Lat & Lng | 6.42031, -72.69184 |
| Postal Codes | 151020, 151027 |
Map of Tipacoque
Interactive Map
Tipacoque Population
Years 1975 to 2030
| Data | 1975 | 1990 | 2000 | 2015 | 2020 | 2025* | 2030* |
|---|---|---|---|---|---|---|---|
| Population | 5,261 | 4,926 | 4,276 | 3,066 | 2,606 | 2,246 | 1,904 |
| Population Density | 95.5 / km² | 89.5 / km² | 77.7 / km² | 55.7 / km² | 47.3 / km² | 40.8 / km² | 34.6 / km² |
Tipacoque Population change from 2000 to 2020
Decrease of 39.1% from year 2000 to 2020
| Location | Change since 1975 | Change since 1990 | Change since 2000 |
|---|---|---|---|
| Tipacoque | -50.5% | -47.1% | -39.1% |
| Boyacá Department | — | — | — |
| Colombia | — | — | — |
Tipacoque Median Age
Median Age: 25.4 years
| Location | Median Age | Median Age (Female) | Median Age (Male) |
|---|---|---|---|
| Tipacoque | 25.4 yrs | 26.3 yrs | 24.5 yrs |
| Boyacá Department | 25.4 yrs | 26.3 yrs | 24.5 yrs |
| Colombia | 24.9 yrs | 25.8 yrs | 24.1 yrs |
Tipacoque Population Density
Population Density: 47.3 / km²
| Location | Population | Area | Density |
|---|---|---|---|
| Tipacoque | 2,606 | 55.1 km² | 47.3 / km² |
| Boyacá Department | 1.2 million | 23,199.7 km² | 52.4 / km² |
| Colombia | 47.8 million | 1,136,620.4 km² | 42.1 / km² |
Tipacoque Historical and Projected Population
Estimated Population from 0 to 2100
- JRC (European Commission's Joint Research Centre) work on the GHS built-up grid
- CIESIN (Center for International Earth Science Information Network)
- [Link] Klein Goldewijk, K., Beusen, A., Doelman, J., and Stehfest, E.: Anthropogenic land use estimates for the Holocene – HYDE 3.2, Earth Syst. Sci. Data, 9, 927–953, https://doi.org/10.5194/essd-9-927-2017, 2017.
Human Development Index (HDI)
Statistic composite index of life expectancy, education, and per capita income.
Tipacoque Gross Domestic Product (GDP)
GDP per capita, PPP (constant 2017 international $)
| Data | 1990 | 1995 | 2000 | 2005 | 2010 | 2015 | 2020 | 2022 |
|---|---|---|---|---|---|---|---|---|
| GDP per capita | $5,356 | $6,937 | $7,488 | $9,697 | $7,077 | $7,504 | $10,492 | $11,550 |
| Total GDP | $20.9M | $25.8M | $25.8M | $29.8M | $18.9M | $17M | $21.4M | $22.2M |
Tipacoque CO2 Emissions
Carbon Dioxide (CO2) Emissions Per Capita in Tonnes Per Year
| Location | CO2 Emissions | CO2 Emissions Per Capita | CO2 Emissions Intensity |
|---|---|---|---|
| Tipacoque | 6,832 tn | 2.62 tn | 124.1 tons/km² |
| Boyacá Department | 3,192,155 tn | 2.62 tn | 137.6 tons/km² |
| Colombia | 116,035,326 tn | 2.43 tn | 102.1 tons/km² |
| 2013 CO2 emissions (tonnes/year) | 6,832 tn |
| 2013 CO2 emissions (tonnes/year) per capita | 2.62 tn |
| 2013 CO2 emissions intensity (tonnes/km²/year) | 124.1 tons/km² |
Natural Hazards Risk
Relative risk out of 10
| Hazard | Risk Level |
|---|---|
| Flood | High (9) |
| Earthquake | Medium (7) |
| Landslide | Medium (7) |
* Risk, particularly concerning flood or landslide, may not be for the entire area.
- Dilley, M., R.S. Chen, U. Deichmann, A.L. Lerner-Lam, M. Arnold, J. Agwe, P. Buys, O. Kjekstad, B. Lyon, and G. Yetman. 2005. Natural Disaster Hotspots: A Global Risk Analysis. Washington, D.C.: World Bank. https://doi.org/10.1596/0-8213-5930-4.
- Center for Hazards and Risk Research - CHRR - Columbia University, Center for International Earth Science Information Network - CIESIN - Columbia University, and Norwegian Geotechnical Institute - NGI. 2005. Global Landslide Hazard Distribution. Palisades, NY: NASA Socioeconomic Data and Applications Center (SEDAC). https://doi.org/10.7927/H4P848VZ.
- Center for Hazards and Risk Research - CHRR - Columbia University, Center for International Earth Science Information Network - CIESIN - Columbia University. 2005. Global Flood Hazard Frequency and Distribution. Palisades, NY: NASA Socioeconomic Data and Applications Center (SEDAC). https://doi.org/10.7927/H4668B3D.
- Center for Hazards and Risk Research - CHRR - Columbia University, Center for International Earth Science Information Network - CIESIN - Columbia University. 2005. Global Earthquake Hazard Distribution - Peak Ground Acceleration. Palisades, NY: NASA Socioeconomic Data and Applications Center (SEDAC). https://doi.org/10.7927/H4BZ63ZS.
Recent Nearby Earthquakes
Magnitude 3.0 and greater
| Date▼ | Time↕ | Magnitude↕ | Distance↕ | Depth↕ | Location↕ | Link |
|---|---|---|---|---|---|---|
| 6/7/19 | 10:59 AM | 4.2 | 29.4 km | 172,590 m | 8km SW of Molagavita, Colombia | usgs.gov |
| 11/9/18 | 11:11 AM | 4.3 | 3.4 km | 190,130 m | 3km NE of Tipacoque, Colombia | usgs.gov |
| 10/8/18 | 2:45 PM | 4.1 | 12.9 km | 172,700 m | 5km W of Capitanejo, Colombia | usgs.gov |
| 3/20/18 | 4:16 PM | 4.1 | 16.1 km | 165,660 m | 4km N of Capitanejo, Colombia | usgs.gov |
| 3/22/17 | 1:50 AM | 4.2 | 16.8 km | 175,110 m | 11km W of Capitanejo, Colombia | usgs.gov |
| 11/29/16 | 1:19 PM | 4.2 | 29.1 km | 169,500 m | 8km SW of Molagavita, Colombia | usgs.gov |
| 10/28/16 | 11:55 AM | 4.3 | 18.2 km | 175,030 m | 10km WNW of Capitanejo, Colombia | usgs.gov |
| 4/6/15 | 10:20 PM | 4.2 | 27.7 km | 170,250 m | 6km SSW of Molagavita, Colombia | usgs.gov |
| 10/11/14 | 9:42 PM | 4.2 | 16.3 km | 179,800 m | 7km WNW of Capitanejo, Colombia | usgs.gov |
| 4/14/13 | 3:23 PM | 4.3 | 22.7 km | 176,000 m | 8km SSE of Molagavita, Colombia | usgs.gov |
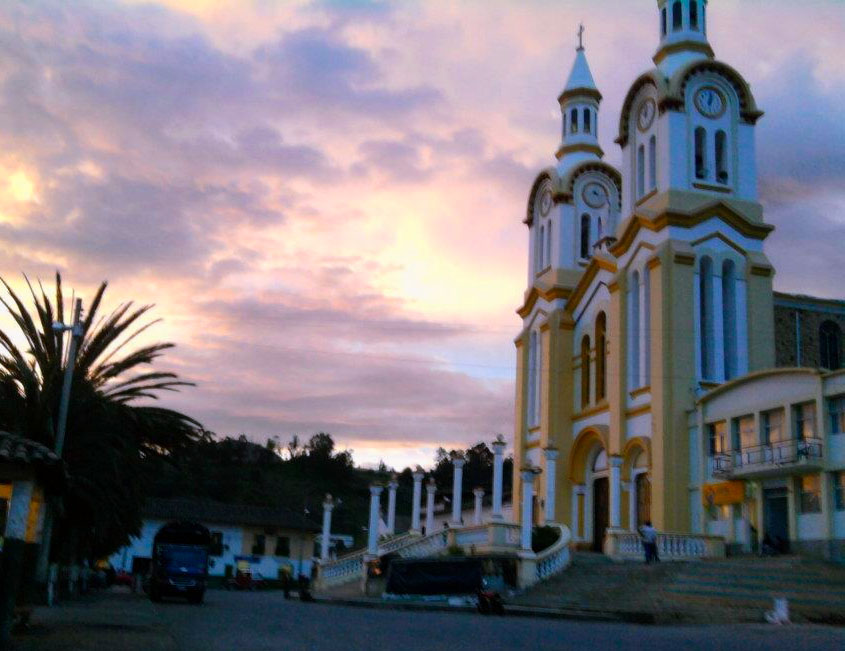
Tipacoque
Tipacoque is a municipality and town in Boyacá Department, Colombia, located on the eastern mountain range on the western flank of the Chicamocha river canyon. It is also part of the sub-region of the Northern Boyacá Province.
Tipacoque Wikipedia Page


About Our Data
The data on this page is estimated using a number of publicly available tools and resources. It is provided without warranty, and could contain inaccuracies. Use at your own risk.