Maisí Facts
| Area | 426.3 km² |
| Population | 27,686 |
| Male Population | 14,626 (52.8%) |
| Female Population | 13,060 (47.2%) |
| Population change (1975 to 2020) | +23.7% |
| Population change (2000 to 2020) | +1.5% |
| Median Age | 36 years (Male: 35.2, Female: 36.8) |
| Local Time | |
| Timezone | Cuba Daylight Time |
| Lat & Lng | 20.24673, -74.15181 |
| Postal Codes | 99370 |
Map of Maisí
Interactive Map
Maisí Population
Years 1975 to 2020
| Data | 1975 | 1990 | 2000 | 2015 | 2020 |
|---|---|---|---|---|---|
| Population | 22,384 | 25,607 | 27,272 | 28,041 | 27,686 |
| Population Density | 52.5 / km² | 60.1 / km² | 64 / km² | 65.8 / km² | 65 / km² |
Sources: JRC (European Commission's Joint Research Centre) work on the GHS built-up grid
Maisí Population change from 2000 to 2015
Increase of 2.8% from year 2000 to 2015
| Location | Change since 1975 | Change since 1990 | Change since 2000 |
|---|---|---|---|
| Maisí | +25.3% | +9.5% | +2.8% |
| Guantánamo Province | +32.9% | +13.7% | +5.3% |
| Cuba | +20.8% | +7.6% | +2.4% |
Sources: JRC (European Commission's Joint Research Centre) work on the GHS built-up grid
Maisí Median Age
Median Age: 36 years
| Location | Median Age | Median Age (Female) | Median Age (Male) |
|---|---|---|---|
| Maisí | 36 yrs | 36.8 yrs | 35.2 yrs |
| Guantánamo Province | 36.2 yrs | 37 yrs | 35.4 yrs |
| Cuba | 39.5 yrs | 40.4 yrs | 38.6 yrs |
Sources: CIESIN (Center for International Earth Science Information Network)
Maisí Population Density
Population Density: 65 / km²
| Location | Population | Area | Density |
|---|---|---|---|
| Maisí | 27,686 | 426.3 km² | 65 / km² |
| Guantánamo Province | 500,934 | 6,222.2 km² | 80.5 / km² |
| Cuba | 11.2 million | 111,150.7 km² | 101 / km² |
Sources: JRC (European Commission's Joint Research Centre) work on the GHS built-up grid
Maisí Historical and Projected Population
Estimated Population from 1740 to 2100
Sources:
- JRC (European Commission's Joint Research Centre) work on the GHS built-up grid
- CIESIN (Center for International Earth Science Information Network)
- [Link] Klein Goldewijk, K., Beusen, A., Doelman, J., and Stehfest, E.: Anthropogenic land use estimates for the Holocene – HYDE 3.2, Earth Syst. Sci. Data, 9, 927–953, https://doi.org/10.5194/essd-9-927-2017, 2017.
Human Development Index (HDI)
Statistic composite index of life expectancy, education, and per capita income.
Source: [Link] Kummu, M., Taka, M. &Guillaume, J. Gridded global datasets for Gross Domestic Product and Human Development Index over 1990–2015. Sci Data 5, 180004 (2018) doi:10.1038/sdata.2018.4
Maisí CO2 Emissions
Carbon Dioxide (CO2) Emissions Per Capita in Tonnes Per Year
| Location | CO2 Emissions | CO2 Emissions Per Capita | CO2 Emissions Intensity |
|---|---|---|---|
| Maisí | 96,570 tn | 3.49 tn | 226.6 tons/km² |
| Guantánamo Province | 1,800,332 tn | 3.59 tn | 289.3 tons/km² |
| Cuba | 38,319,156 tn | 3.41 tn | 344.7 tons/km² |
Sources: [Link] Moran, D., Kanemoto K; Jiborn, M., Wood, R., Többen, J., and Seto, K.C. (2018) Carbon footprints of 13,000 cities. Environmental Research Letters DOI: 10.1088/1748-9326/aac72a
Maisí CO2 Emissions
| 2013 CO2 emissions (tonnes/year) | 96,570 tn |
| 2013 CO2 emissions (tonnes/year) per capita | 3.49 tn |
| 2013 CO2 emissions intensity (tonnes/km²/year) | 226.6 tons/km² |
Natural Hazards Risk
Relative risk out of 10
| Hazard | Risk Level |
|---|---|
| Flood | Medium (7) |
| Earthquake | Medium (5.8) |
| Cyclone | Medium (5) |
* Risk, particularly concerning flood or landslide, may not be for the entire area.
Sources:
- Dilley, M., R.S. Chen, U. Deichmann, A.L. Lerner-Lam, M. Arnold, J. Agwe, P. Buys, O. Kjekstad, B. Lyon, and G. Yetman. 2005. Natural Disaster Hotspots: A Global Risk Analysis. Washington, D.C.: World Bank. https://doi.org/10.1596/0-8213-5930-4.
- Center for Hazards and Risk Research - CHRR - Columbia University, Center for International Earth Science Information Network - CIESIN - Columbia University, International Bank for Reconstruction and Development - The World Bank, and United Nations Environment Programme Global Resource Information Database Geneva - UNEP/GRID-Geneva. 2005. Global Cyclone Hazard Frequency and Distribution. Palisades, NY: NASA Socioeconomic Data and Applications Center (SEDAC). https://doi.org/10.7927/H4CZ353K.
- Center for Hazards and Risk Research - CHRR - Columbia University, Center for International Earth Science Information Network - CIESIN - Columbia University. 2005. Global Flood Hazard Frequency and Distribution. Palisades, NY: NASA Socioeconomic Data and Applications Center (SEDAC). https://doi.org/10.7927/H4668B3D.
- Center for Hazards and Risk Research - CHRR - Columbia University, Center for International Earth Science Information Network - CIESIN - Columbia University. 2005. Global Earthquake Hazard Distribution - Peak Ground Acceleration. Palisades, NY: NASA Socioeconomic Data and Applications Center (SEDAC). https://doi.org/10.7927/H4BZ63ZS.
Recent Nearby Earthquakes
Magnitude 3.0 and greater
| Date▼ | Time↕ | Magnitude↕ | Distance↕ | Depth↕ | Location↕ | Link |
|---|---|---|---|---|---|---|
| 8/5/19 | 12:34 AM | 4.3 | 76.3 km | 10,000 m | 91km SSE of Baracoa, Cuba | usgs.gov |
| 9/30/16 | 11:06 PM | 5 | 46.7 km | 10,000 m | 52km SSE of Baracoa, Cuba | usgs.gov |
| 3/28/16 | 1:57 PM | 4.4 | 36.5 km | 10,000 m | 58km WNW of Mole Saint-Nicolas, Haiti | usgs.gov |
| 3/23/15 | 6:11 AM | 4.3 | 90.4 km | 10,000 m | 54km WSW of Bombardopolis, Haiti | usgs.gov |
| 10/19/14 | 5:25 AM | 4.4 | 61.9 km | 10,430 m | 62km S of Baracoa, Cuba | usgs.gov |
| 2/12/10 | 12:09 PM | 5.3 | 49.4 km | 10,000 m | Cuba region | usgs.gov |
| 9/1/05 | 1:09 AM | 4.2 | 90.1 km | 35,000 m | Haiti region | usgs.gov |
| 1/5/99 | 9:26 PM | 4.7 | 92 km | 10,000 m | Cuba region | usgs.gov |
| 1/5/99 | 3:50 PM | 4.9 | 89.7 km | 10,000 m | Cuba region | usgs.gov |
| 12/28/98 | 7:23 AM | 5.6 | 80.3 km | 10,000 m | Cuba region | usgs.gov |
Source: U.S. Geological Survey (USGS)
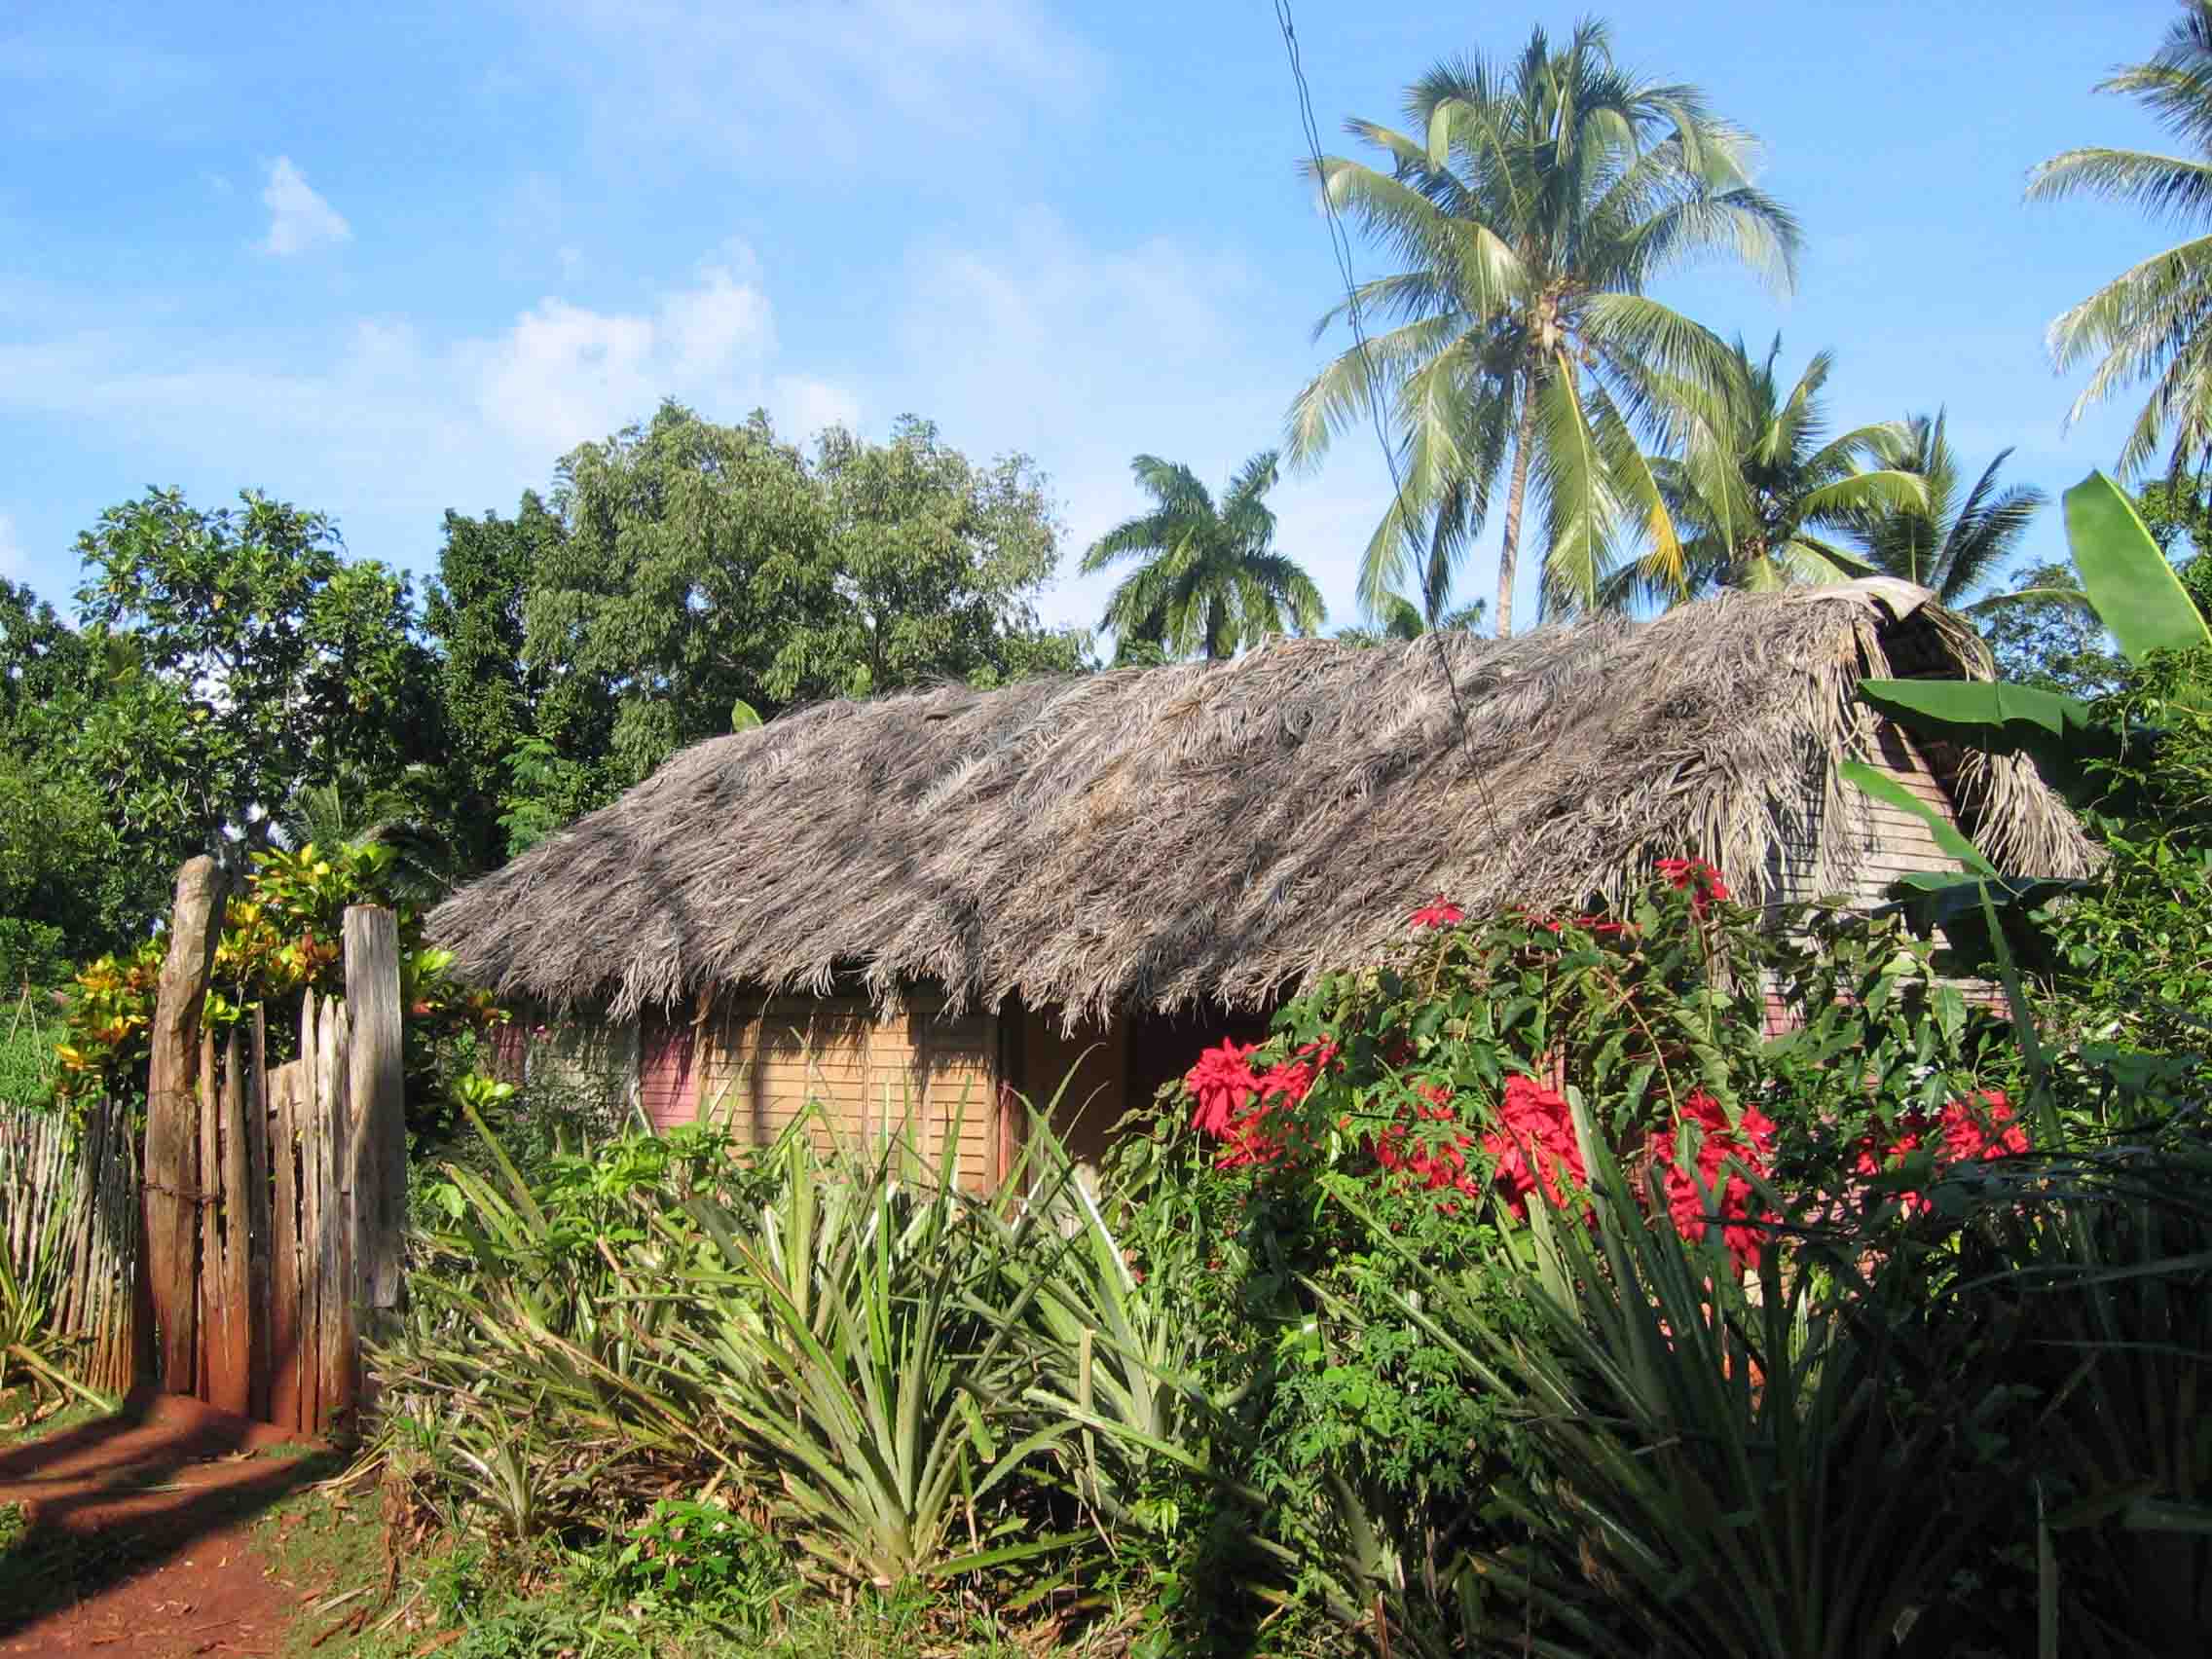
Maisí
Maisí is a municipality and town in the Guantánamo Province of Cuba. Its administrative seat is located in the town of La Máquina.
Maisí Wikipedia Page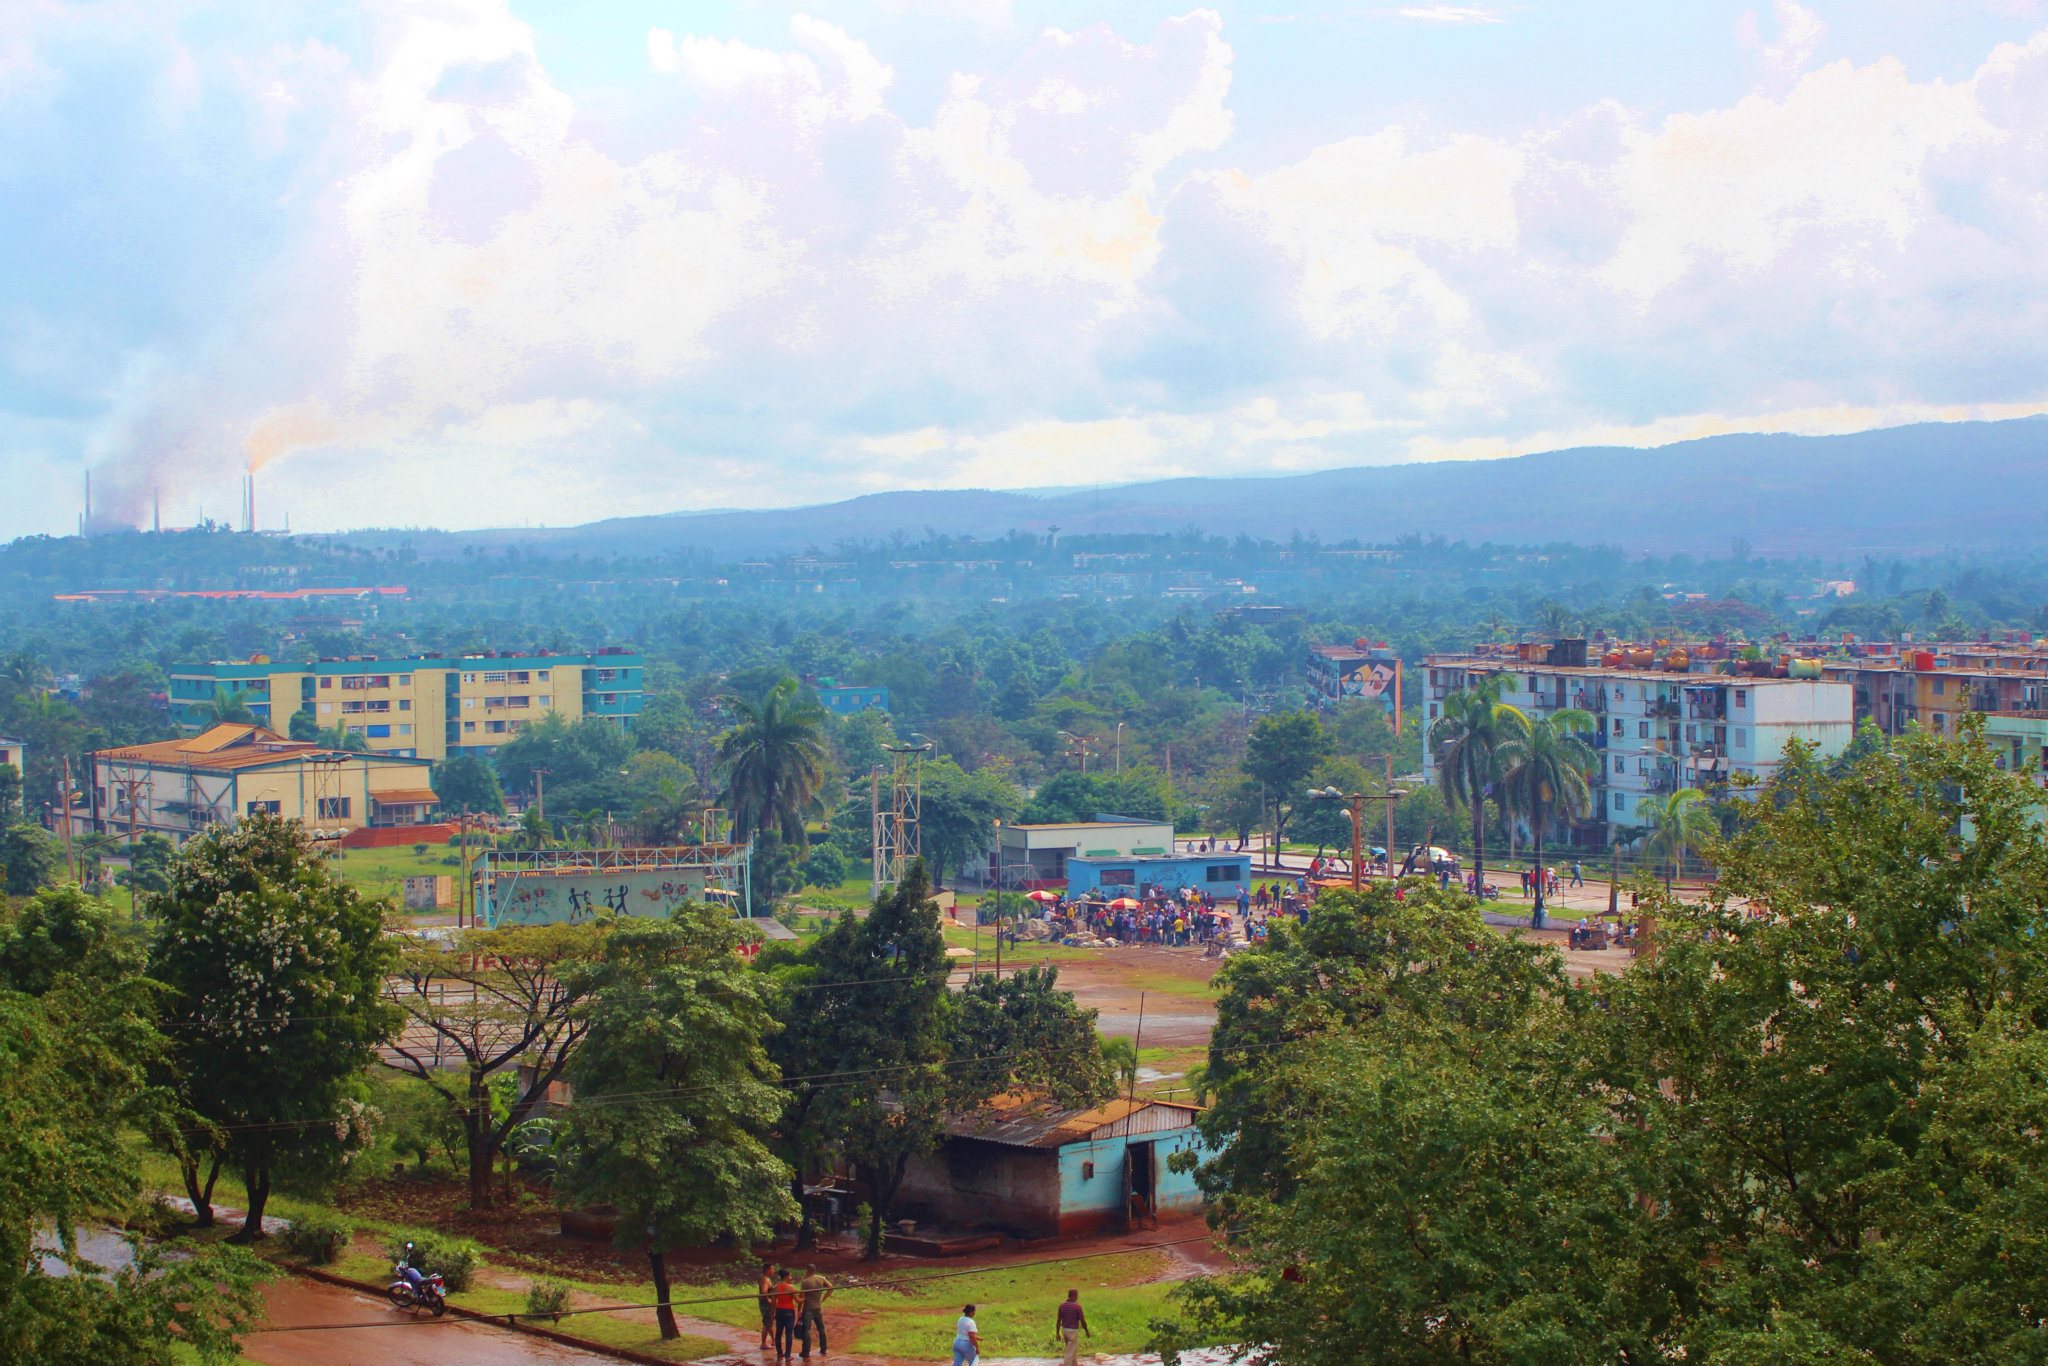
About Our Data
The data on this page is estimated using a number of publicly available tools and resources. It is provided without warranty, and could contain inaccuracies. Use at your own risk.