Categories in Jirkov
Industries
Business Distribution by Industry in Jirkov
| Industry Description | Number of Establishments |
|---|---|
| Wholesalers | 156 |
| Restaurants | 106 |
| Technical construction services | 84 |
| Real estate | 59 |
| Shopping | 56 |
| Accountants | 54 |
| Demolition and site preparation | 53 |
| Beauty salons | 53 |
| Financial services | 52 |
| Manufacture of minerals and metals | 48 |
| Car repair | 38 |
| Secondary education | 32 |
| Construction | 32 |
| Corporate management | 30 |
| Other transport activities | 29 |
| Other construction | 21 |
| Finance other | 20 |
| Travel and transportation | 20 |
Jirkov Facts
| Area | 4.4 km² |
| Population | 15,273 |
| Male Population | 7,402 (48.5%) |
| Female Population | 7,871 (51.5%) |
| Population change (1975 to 2020) | -29.4% |
| Population change (2000 to 2020) | -18.9% |
| Median Age | 37.5 years (Male: 36.2, Female: 38.8) |
| GDP per capita (PPP) | $31,485 (2022) |
| Neighborhoods | Jirkov, Drmaly, Chomutov, Březenec, Červený Hrádek |
| Local Time | |
| Timezone | Central European Summer Time |
| Lat & Lng | 50.49979, 13.44769 |
Map of Jirkov
Interactive Map
Jirkov Population
Years 1975 to 2030
| Data | 1975 | 1990 | 2000 | 2015 | 2020 | 2025* | 2030* |
|---|---|---|---|---|---|---|---|
| Population | 21,647 | 20,352 | 18,832 | 16,551 | 15,273 | 14,655 | 14,189 |
| Population Density | 4,947.9 / km² | 4,651.9 / km² | 4,304.5 / km² | 3,783.1 / km² | 3,491 / km² | 3,349.7 / km² | 3,243.2 / km² |
Jirkov Population change from 2000 to 2020
Decrease of 18.9% from year 2000 to 2020
| Location | Change since 1975 | Change since 1990 | Change since 2000 |
|---|---|---|---|
| Jirkov | -29.4% | -25% | -18.9% |
| Ústí nad Labem Region | — | — | — |
| Czech Republic | — | — | — |
Jirkov Median Age
Median Age: 37.5 years
| Location | Median Age | Median Age (Female) | Median Age (Male) |
|---|---|---|---|
| Jirkov | 37.5 yrs | 38.8 yrs | 36.2 yrs |
| Ústí nad Labem Region | 39.9 yrs | 41.6 yrs | 38.7 yrs |
| Czech Republic | 40 yrs | 41.7 yrs | 38.7 yrs |
Jirkov Population Density
Population Density: 3,491 / km²
| Location | Population | Area | Density |
|---|---|---|---|
| Jirkov | 15,273 | 4.375 km² | 3,491 / km² |
| Ústí nad Labem Region | 805,226 | 5,333.1 km² | 151 / km² |
| Czech Republic | 10.5 million | 78,907.6 km² | 134 / km² |
Jirkov Historical and Projected Population
Estimated Population from 0 to 2100
- JRC (European Commission's Joint Research Centre) work on the GHS built-up grid
- CIESIN (Center for International Earth Science Information Network)
- [Link] Klein Goldewijk, K., Beusen, A., Doelman, J., and Stehfest, E.: Anthropogenic land use estimates for the Holocene – HYDE 3.2, Earth Syst. Sci. Data, 9, 927–953, https://doi.org/10.5194/essd-9-927-2017, 2017.
Area Codes
Percentage Area Codes used by businesses in Jirkov
Price Distribution
Business distribution by price for Jirkov
Human Development Index (HDI)
Statistic composite index of life expectancy, education, and per capita income.
Jirkov Gross Domestic Product (GDP)
GDP per capita, PPP (constant 2017 international $)
| Data | 1990 | 1995 | 2000 | 2005 | 2010 | 2015 | 2020 | 2022 |
|---|---|---|---|---|---|---|---|---|
| GDP per capita | $21,644 | $21,595 | $21,015 | $25,907 | $29,599 | $33,329 | $29,629 | $31,485 |
| Total GDP | $6.7M | $6.7M | $6.8M | $9.3M | $12M | $14.3M | $12.5M | $13M |
Jirkov CO2 Emissions
Carbon Dioxide (CO2) Emissions Per Capita in Tonnes Per Year
| Location | CO2 Emissions | CO2 Emissions Per Capita | CO2 Emissions Intensity |
|---|---|---|---|
| Jirkov | 145,917 tn | 9.55 tn | 33,352.5 tons/km² |
| Ústí nad Labem Region | 7,544,516 tn | 9.37 tn | 1,414.7 tons/km² |
| Czech Republic | 95,143,045 tn | 9.02 tn | 1,205.8 tons/km² |
| 2013 CO2 emissions (tonnes/year) | 145,917 tn |
| 2013 CO2 emissions (tonnes/year) per capita | 9.55 tn |
| 2013 CO2 emissions intensity (tonnes/km²/year) | 33,352.5 tons/km² |
Natural Hazards Risk
Relative risk out of 10
| Hazard | Risk Level |
|---|---|
| Flood | Medium (7) |
| Earthquake | Low (2) |
* Risk, particularly concerning flood or landslide, may not be for the entire area.
- Dilley, M., R.S. Chen, U. Deichmann, A.L. Lerner-Lam, M. Arnold, J. Agwe, P. Buys, O. Kjekstad, B. Lyon, and G. Yetman. 2005. Natural Disaster Hotspots: A Global Risk Analysis. Washington, D.C.: World Bank. https://doi.org/10.1596/0-8213-5930-4.
- Center for Hazards and Risk Research - CHRR - Columbia University, Center for International Earth Science Information Network - CIESIN - Columbia University. 2005. Global Flood Hazard Frequency and Distribution. Palisades, NY: NASA Socioeconomic Data and Applications Center (SEDAC). https://doi.org/10.7927/H4668B3D.
- Center for Hazards and Risk Research - CHRR - Columbia University, Center for International Earth Science Information Network - CIESIN - Columbia University. 2005. Global Earthquake Hazard Distribution - Peak Ground Acceleration. Palisades, NY: NASA Socioeconomic Data and Applications Center (SEDAC). https://doi.org/10.7927/H4BZ63ZS.
Recent Nearby Earthquakes
Magnitude 3.0 and greater
| Date▼ | Time↕ | Magnitude↕ | Distance↕ | Depth↕ | Location↕ | Link |
|---|---|---|---|---|---|---|
| 5/22/18 | 7:54 PM | 3.2 | 76.3 km | 10,000 m | 2km ENE of Luby, Czech Republic | usgs.gov |
| 9/4/11 | 3:52 AM | 4 | 78.2 km | 2,000 m | Czech Republic | usgs.gov |
| 10/28/08 | 2:51 PM | 3.3 | 76.3 km | 9,400 m | Czech Republic | usgs.gov |
| 10/28/08 | 8:30 AM | 4.2 | 77.6 km | 10,000 m | Czech Republic | usgs.gov |
| 10/28/08 | 8:27 AM | 3.3 | 77.2 km | 8,400 m | Czech Republic | usgs.gov |
| 10/21/08 | 2:14 AM | 3.5 | 77.5 km | 10,000 m | Czech Republic | usgs.gov |
| 10/16/08 | 10:48 AM | 3.2 | 75.9 km | 0 m | Czech Republic | usgs.gov |
| 10/14/08 | 5:49 AM | 3.1 | 76.8 km | 11,100 m | Czech Republic | usgs.gov |
| 10/14/08 | 4:01 AM | 3.4 | 78.2 km | 10,300 m | Czech Republic | usgs.gov |
| 10/12/08 | 3:09 PM | 3.2 | 77.8 km | 10,000 m | Czech Republic | usgs.gov |
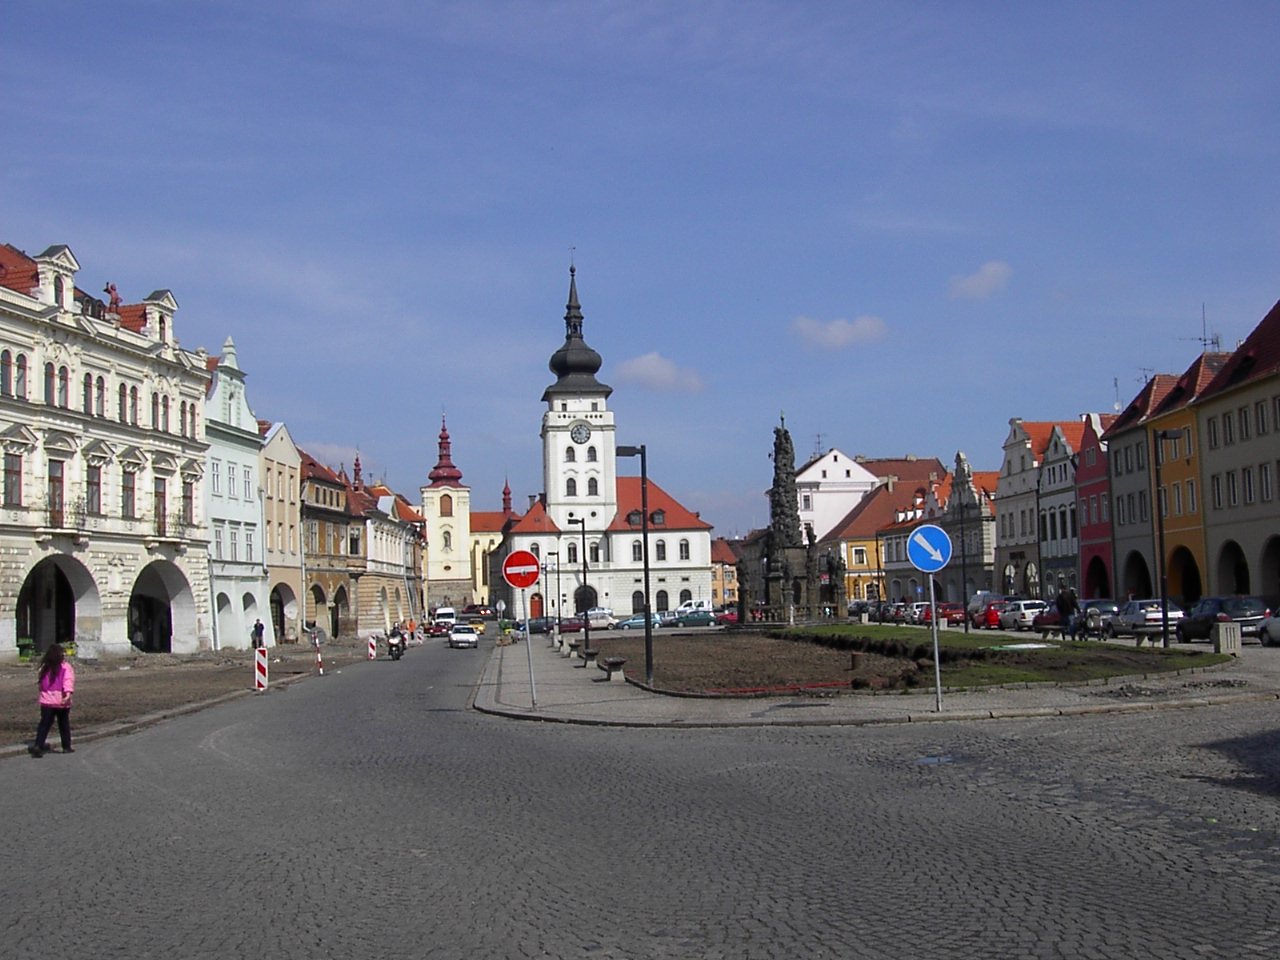
Jirkov
Jirkov (Czech pronunciation: [ˈjɪrkof]; German: Görkau) is a small town situated between Most and Chomutov in the Ústí nad Labem Region of the Czech Republic and is situated on the Chomutov - Ústi nad Labem railway line. Although geographically close..
Jirkov Wikipedia Page


About Our Data
The data on this page is estimated using a number of publicly available tools and resources. It is provided without warranty, and could contain inaccuracies. Use at your own risk.