Industries
Business Distribution by Industry in Krasov
| Industry Description | Number of Establishments |
|---|---|
| Forestry and logging | 5 |
Krasov Facts
| Area | 32.9 km² |
| Population | 310 |
| Male Population | 170 (54.7%) |
| Female Population | 140 (45.3%) |
| Population change (1975 to 2020) | -17.8% |
| Population change (2000 to 2020) | -11.4% |
| Median Age | 39.3 years (Male: 37.7, Female: 42.9) |
| GDP per capita (PPP) | $33,165 (2022) |
| Neighborhoods | Krasov |
| Local Time | |
| Timezone | Central European Summer Time |
| Lat & Lng | 50.09177, 17.54610 |
Map of Krasov
Interactive Map
Krasov Population
Years 1975 to 2030
| Data | 1975 | 1990 | 2000 | 2015 | 2020 | 2025* | 2030* |
|---|---|---|---|---|---|---|---|
| Population | 377 | 368 | 350 | 328 | 310 | 293 | 277 |
| Population Density | 11.5 / km² | 11.2 / km² | 10.6 / km² | 10 / km² | 9.4 / km² | 8.9 / km² | 8.4 / km² |
Krasov Population change from 2000 to 2020
Decrease of 11.4% from year 2000 to 2020
| Location | Change since 1975 | Change since 1990 | Change since 2000 |
|---|---|---|---|
| Krasov | -17.8% | -15.8% | -11.4% |
| Czech Republic | — | — | — |
Krasov Median Age
Median Age: 39.3 years
| Location | Median Age | Median Age (Female) | Median Age (Male) |
|---|---|---|---|
| Krasov | 39.3 yrs | 42.9 yrs | 37.7 yrs |
| Czech Republic | 40 yrs | 41.7 yrs | 38.7 yrs |
Krasov Population Density
Population Density: 9.4 / km²
| Location | Population | Area | Density |
|---|---|---|---|
| Krasov | 310 | 32.9 km² | 9.4 / km² |
| Czech Republic | 10.5 million | 78,907.6 km² | 134 / km² |
Krasov Historical and Projected Population
Estimated Population from 0 to 2100
- JRC (European Commission's Joint Research Centre) work on the GHS built-up grid
- CIESIN (Center for International Earth Science Information Network)
- [Link] Klein Goldewijk, K., Beusen, A., Doelman, J., and Stehfest, E.: Anthropogenic land use estimates for the Holocene – HYDE 3.2, Earth Syst. Sci. Data, 9, 927–953, https://doi.org/10.5194/essd-9-927-2017, 2017.
Human Development Index (HDI)
Statistic composite index of life expectancy, education, and per capita income.
Krasov Gross Domestic Product (GDP)
GDP per capita, PPP (constant 2017 international $)
| Data | 1990 | 1995 | 2000 | 2005 | 2010 | 2015 | 2020 | 2022 |
|---|---|---|---|---|---|---|---|---|
| GDP per capita | $17,953 | $18,216 | $17,090 | $21,790 | $26,829 | $29,847 | $29,198 | $33,165 |
| Total GDP | $109.8M | $107.6M | $96.1M | $116.9M | $139.1M | $146.6M | $136.2M | $151.1M |
Krasov CO2 Emissions
Carbon Dioxide (CO2) Emissions Per Capita in Tonnes Per Year
| Location | CO2 Emissions | CO2 Emissions Per Capita | CO2 Emissions Intensity |
|---|---|---|---|
| Krasov | 3,000 tn | 9.68 tn | 91.3 tons/km² |
| Czech Republic | 95,143,045 tn | 9.02 tn | 1,205.8 tons/km² |
| 2013 CO2 emissions (tonnes/year) | 3,000 tn |
| 2013 CO2 emissions (tonnes/year) per capita | 9.68 tn |
| 2013 CO2 emissions intensity (tonnes/km²/year) | 91.3 tons/km² |
Natural Hazards Risk
Relative risk out of 10
| Hazard | Risk Level |
|---|---|
| Flood | Medium (4) |
| Earthquake | Low (2) |
* Risk, particularly concerning flood or landslide, may not be for the entire area.
- Dilley, M., R.S. Chen, U. Deichmann, A.L. Lerner-Lam, M. Arnold, J. Agwe, P. Buys, O. Kjekstad, B. Lyon, and G. Yetman. 2005. Natural Disaster Hotspots: A Global Risk Analysis. Washington, D.C.: World Bank. https://doi.org/10.1596/0-8213-5930-4.
- Center for Hazards and Risk Research - CHRR - Columbia University, Center for International Earth Science Information Network - CIESIN - Columbia University. 2005. Global Flood Hazard Frequency and Distribution. Palisades, NY: NASA Socioeconomic Data and Applications Center (SEDAC). https://doi.org/10.7927/H4668B3D.
- Center for Hazards and Risk Research - CHRR - Columbia University, Center for International Earth Science Information Network - CIESIN - Columbia University. 2005. Global Earthquake Hazard Distribution - Peak Ground Acceleration. Palisades, NY: NASA Socioeconomic Data and Applications Center (SEDAC). https://doi.org/10.7927/H4BZ63ZS.
Recent Nearby Earthquakes
Magnitude 3.0 and greater
| Date▼ | Time↕ | Magnitude↕ | Distance↕ | Depth↕ | Location↕ | Link |
|---|---|---|---|---|---|---|
| 1/22/19 | 10:35 PM | 3.9 | 65.1 km | 5,500 m | 0km W of Jejkowice, Poland | usgs.gov |
| 12/4/08 | 6:54 AM | 3.2 | 70.9 km | 0 m | Czech Republic | usgs.gov |
| 11/22/08 | 10:27 PM | 4.1 | 68.1 km | 2,000 m | Czech Republic | usgs.gov |
| 2/6/08 | 1:55 AM | 3.4 | 70.2 km | 10,000 m | Czech Republic | usgs.gov |
| 10/14/07 | 1:58 PM | 3.4 | 70 km | 5,000 m | Czech Republic | usgs.gov |
| 7/16/07 | 4:42 AM | 3.2 | 64.6 km | 5,000 m | Czech Republic | usgs.gov |
| 6/7/07 | 7:48 AM | 3.3 | 67.9 km | 5,000 m | Czech Republic | usgs.gov |
| 2/13/07 | 4:03 PM | 3.2 | 68.2 km | 5,000 m | Czech Republic | usgs.gov |
| 12/26/06 | 10:16 PM | 3 | 64.6 km | 10,000 m | Poland-Czech Republic-Slovakia Border Region | usgs.gov |
| 12/19/06 | 2:35 AM | 3.5 | 62.7 km | 5,000 m | Poland | usgs.gov |
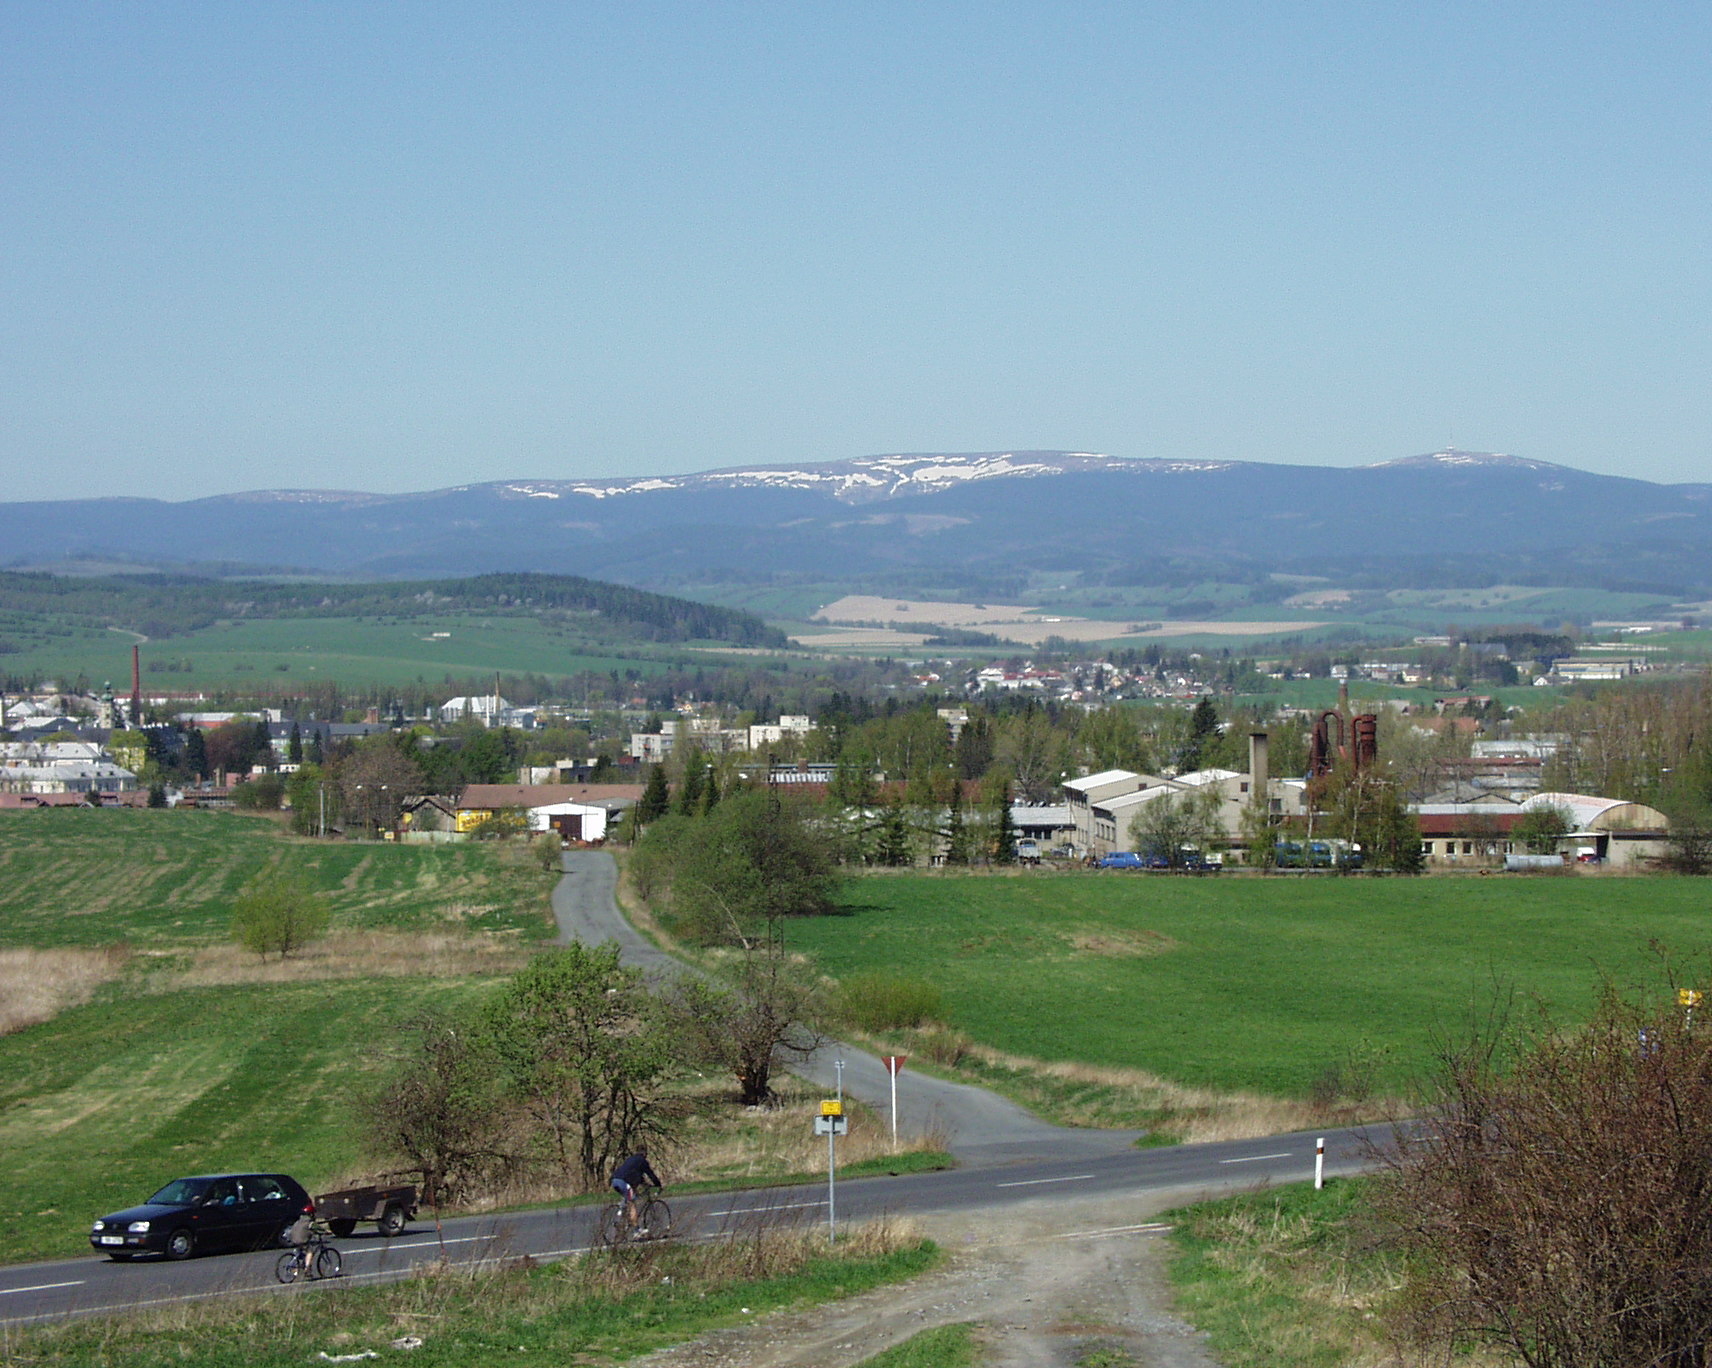
Krasov
Krasov (German: Kronsdorf) is a village and municipality in Bruntál District in the Moravian-Silesian Region of the Czech Republic.
Krasov Wikipedia Page


About Our Data
The data on this page is estimated using a number of publicly available tools and resources. It is provided without warranty, and could contain inaccuracies. Use at your own risk.