Categories in Dechow
Industries
Business Distribution by Industry in Dechow
| Industry Description | Number of Establishments |
|---|---|
| Tractors and farm equipment | 13 |
Dechow Facts
| Area | 27.7 km² |
| Population | 219 |
| Male Population | 111 (50.5%) |
| Female Population | 108 (49.5%) |
| Population change (1975 to 2020) | -9.1% |
| Population change (2000 to 2020) | -10.6% |
| Median Age | 47.4 years (Male: 46.2, Female: 48.7) |
| Area Codes | 38873, 38876 |
| Neighborhoods | Groß Thurow |
| Local Time | |
| Timezone | Central European Summer Time |
| Lat & Lng | 53.71951, 10.92195 |
| Postal Codes | 19217 |
Map of Dechow
Interactive Map
Dechow Population
Years 1975 to 2020
| Data | 1975 | 1990 | 2000 | 2015 | 2020 |
|---|---|---|---|---|---|
| Population | 241 | 227 | 245 | 227 | 219 |
| Population Density | 8.7 / km² | 8.2 / km² | 8.8 / km² | 8.2 / km² | 7.9 / km² |
Sources: JRC (European Commission's Joint Research Centre) work on the GHS built-up grid
Dechow Population change from 2000 to 2015
Decrease of 7.3% from year 2000 to 2015
| Location | Change since 1975 | Change since 1990 | Change since 2000 |
|---|---|---|---|
| Dechow | -5.8% | +0% | -7.3% |
| Mecklenburg-Vorpommern | -19.6% | -12.3% | -10.1% |
| Germany | +2.6% | +2.2% | -1.5% |
Sources: JRC (European Commission's Joint Research Centre) work on the GHS built-up grid
Dechow Median Age
Median Age: 47.4 years
| Location | Median Age | Median Age (Female) | Median Age (Male) |
|---|---|---|---|
| Dechow | 47.4 yrs | 48.7 yrs | 46.2 yrs |
| Mecklenburg-Vorpommern | 47.5 yrs | 49.1 yrs | 46 yrs |
| Germany | 44.8 yrs | 46 yrs | 43.6 yrs |
Sources: CIESIN (Center for International Earth Science Information Network)
Dechow Population Density
Population Density: 7.9 / km²
| Location | Population | Area | Density |
|---|---|---|---|
| Dechow | 219 | 27.7 km² | 7.9 / km² |
| Mecklenburg-Vorpommern | 1.6 million | 23,289 km² | 66.9 / km² |
| Germany | 80.7 million | 358,179.8 km² | 225 / km² |
Sources: JRC (European Commission's Joint Research Centre) work on the GHS built-up grid
Dechow Historical and Projected Population
Estimated Population from 0 to 2100
Sources:
- JRC (European Commission's Joint Research Centre) work on the GHS built-up grid
- CIESIN (Center for International Earth Science Information Network)
- [Link] Klein Goldewijk, K., Beusen, A., Doelman, J., and Stehfest, E.: Anthropogenic land use estimates for the Holocene – HYDE 3.2, Earth Syst. Sci. Data, 9, 927–953, https://doi.org/10.5194/essd-9-927-2017, 2017.
Area Codes
Percentage Area Codes used by businesses in Dechow
Human Development Index (HDI)
Statistic composite index of life expectancy, education, and per capita income.
Source: [Link] Kummu, M., Taka, M. &Guillaume, J. Gridded global datasets for Gross Domestic Product and Human Development Index over 1990–2015. Sci Data 5, 180004 (2018) doi:10.1038/sdata.2018.4
Dechow CO2 Emissions
Carbon Dioxide (CO2) Emissions Per Capita in Tonnes Per Year
| Location | CO2 Emissions | CO2 Emissions Per Capita | CO2 Emissions Intensity |
|---|---|---|---|
| Dechow | 2,050 tn | 9.36 tn | 74.1 tons/km² |
| Mecklenburg-Vorpommern | 14,301,725 tn | 9.18 tn | 614.1 tons/km² |
| Germany | 755,339,039 tn | 9.36 tn | 2,108.8 tons/km² |
Sources: [Link] Moran, D., Kanemoto K; Jiborn, M., Wood, R., Többen, J., and Seto, K.C. (2018) Carbon footprints of 13,000 cities. Environmental Research Letters DOI: 10.1088/1748-9326/aac72a
Dechow CO2 Emissions
| 2013 CO2 emissions (tonnes/year) | 2,050 tn |
| 2013 CO2 emissions (tonnes/year) per capita | 9.36 tn |
| 2013 CO2 emissions intensity (tonnes/km²/year) | 74.1 tons/km² |
Recent Nearby Earthquakes
Magnitude 3.0 and greater
| Date▼ | Time↕ | Magnitude↕ | Distance↕ | Depth↕ | Location↕ | Link |
|---|---|---|---|---|---|---|
| 5/19/00 | 7:22 PM | 3.5 | 34.9 km | 10,000 m | Germany | usgs.gov |
Source: U.S. Geological Survey (USGS)
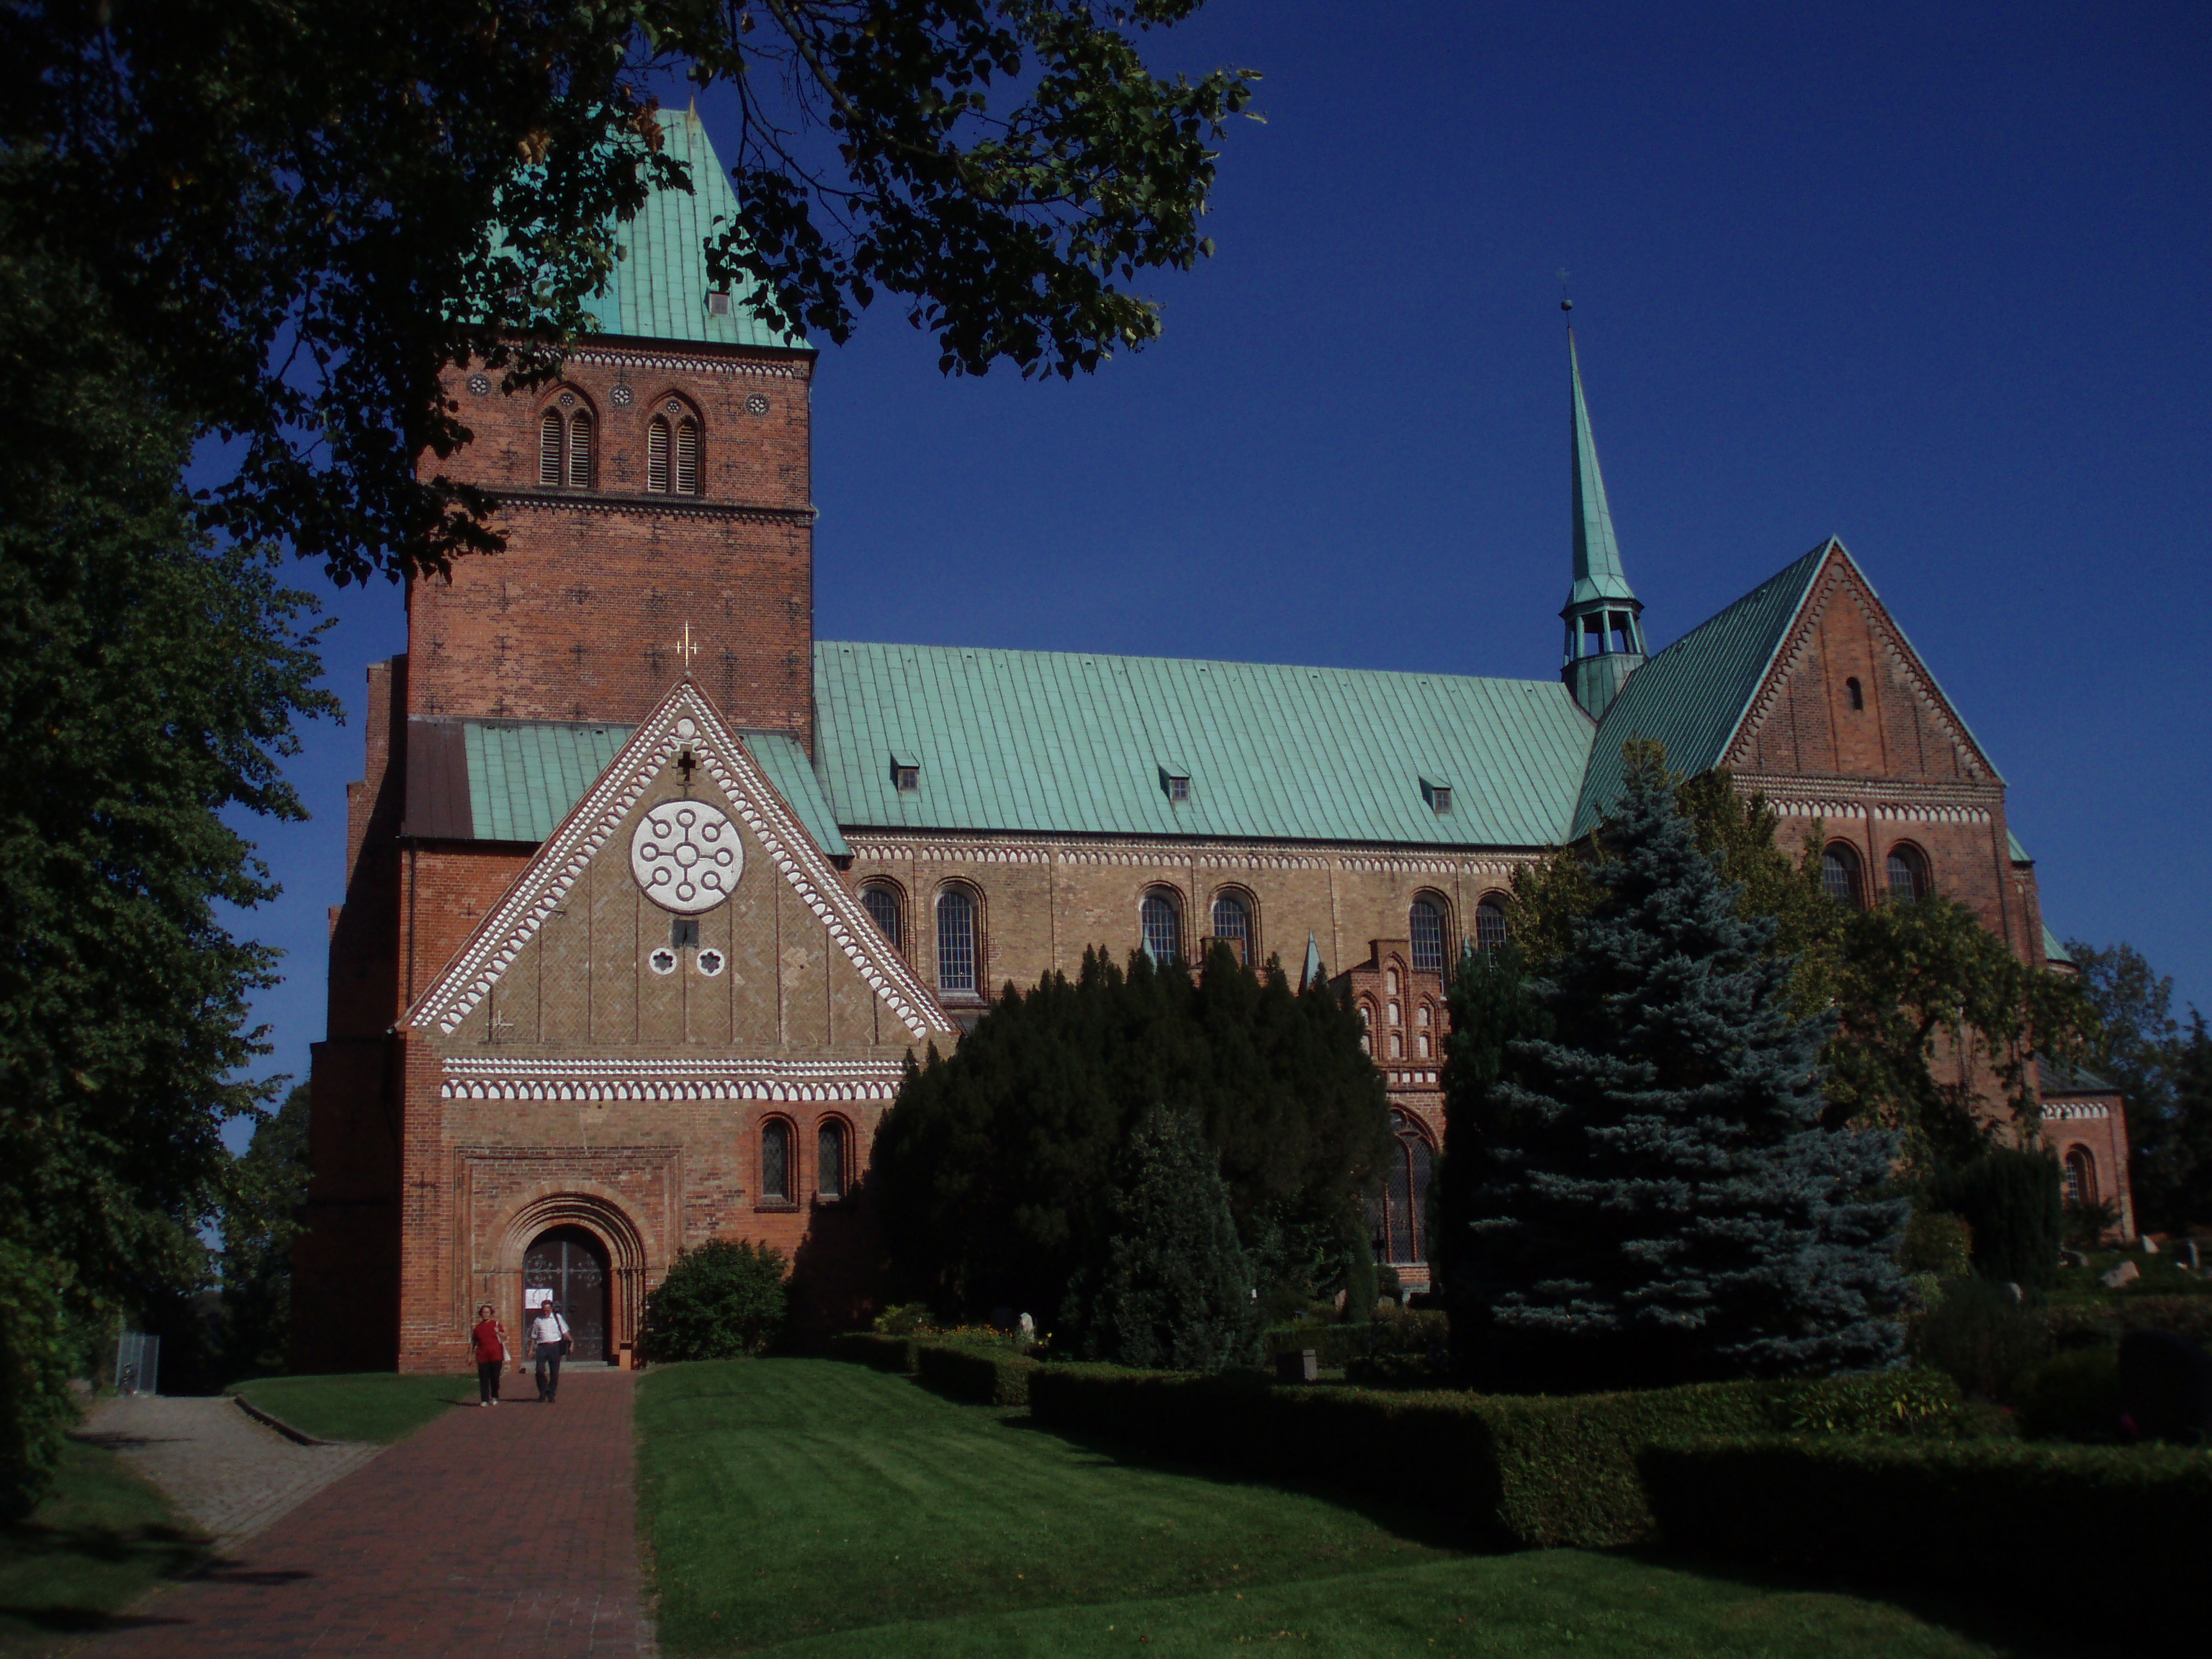
Dechow
Dechow is a municipality in the Nordwestmecklenburg district, in Mecklenburg-Vorpommern, Germany.
Dechow Wikipedia Page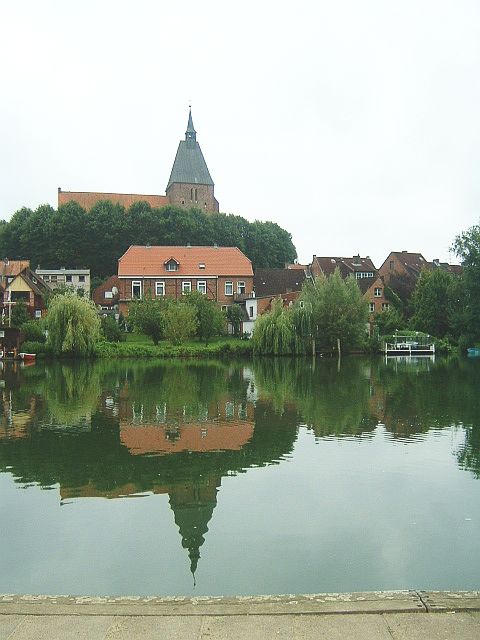

About Our Data
The data on this page is estimated using a number of publicly available tools and resources. It is provided without warranty, and could contain inaccuracies. Use at your own risk.