Diebzig Facts
| Area | 0.3 km² |
| Population | 132 |
| Population change (1975 to 2020) | -55.1% |
| Population change (2000 to 2020) | -27.1% |
| Area Codes | 34979 |
| Local Time | |
| Timezone | Central European Summer Time |
| Lat & Lng | 51.86531, 11.93872 |
Map of Diebzig
Interactive Map
Diebzig Population
Years 1975 to 2020
| Data | 1975 | 1990 | 2000 | 2015 | 2020 |
|---|---|---|---|---|---|
| Population | 294 | 215 | 181 | 134 | 132 |
| Population Density | 1,176 / km² | 860 / km² | 724 / km² | 536 / km² | 528 / km² |
Diebzig Population change from 2000 to 2015
Decrease of 26% from year 2000 to 2015
| Location | Change since 1975 | Change since 1990 | Change since 2000 |
|---|---|---|---|
| Diebzig | -54.4% | -37.7% | -26% |
| Saxony-Anhalt | -30.3% | -19.5% | -14.5% |
| Germany | +2.6% | +2.2% | -1.5% |
Diebzig Population Density
Population Density: 528 / km²
| Location | Population | Area | Density |
|---|---|---|---|
| Diebzig | 132 | 0.25 km² | 528 / km² |
| Saxony-Anhalt | 2.2 million | 20,550.4 km² | 107 / km² |
| Germany | 80.7 million | 358,179.8 km² | 225 / km² |
Diebzig Historical and Projected Population
Estimated Population from 0 to 2100
- JRC (European Commission's Joint Research Centre) work on the GHS built-up grid
- CIESIN (Center for International Earth Science Information Network)
- [Link] Klein Goldewijk, K., Beusen, A., Doelman, J., and Stehfest, E.: Anthropogenic land use estimates for the Holocene – HYDE 3.2, Earth Syst. Sci. Data, 9, 927–953, https://doi.org/10.5194/essd-9-927-2017, 2017.
Human Development Index (HDI)
Statistic composite index of life expectancy, education, and per capita income.
Diebzig CO2 Emissions
Carbon Dioxide (CO2) Emissions Per Capita in Tonnes Per Year
| Location | CO2 Emissions | CO2 Emissions Per Capita | CO2 Emissions Intensity |
|---|---|---|---|
| Diebzig | 1,226 tn | 9.29 tn | 4,903.7 tons/km² |
| Saxony-Anhalt | 20,564,701 tn | 9.33 tn | 1,000.7 tons/km² |
| Germany | 755,339,039 tn | 9.36 tn | 2,108.8 tons/km² |
| 2013 CO2 emissions (tonnes/year) | 1,226 tn |
| 2013 CO2 emissions (tonnes/year) per capita | 9.29 tn |
| 2013 CO2 emissions intensity (tonnes/km²/year) | 4,903.7 tons/km² |
Natural Hazards Risk
Relative risk out of 10
| Hazard | Risk Level |
|---|---|
| Flood | Medium (7) |
* Risk, particularly concerning flood or landslide, may not be for the entire area.
- Dilley, M., R.S. Chen, U. Deichmann, A.L. Lerner-Lam, M. Arnold, J. Agwe, P. Buys, O. Kjekstad, B. Lyon, and G. Yetman. 2005. Natural Disaster Hotspots: A Global Risk Analysis. Washington, D.C.: World Bank. https://doi.org/10.1596/0-8213-5930-4.
- Center for Hazards and Risk Research - CHRR - Columbia University, Center for International Earth Science Information Network - CIESIN - Columbia University. 2005. Global Flood Hazard Frequency and Distribution. Palisades, NY: NASA Socioeconomic Data and Applications Center (SEDAC). https://doi.org/10.7927/H4668B3D.
Recent Nearby Earthquakes
Magnitude 3.0 and greater
| Date▼ | Time↕ | Magnitude↕ | Distance↕ | Depth↕ | Location↕ | Link |
|---|---|---|---|---|---|---|
| 4/16/15 | 6:38 AM | 3.3 | 49.1 km | 20,600 m | 1km NE of Grobers, Germany | usgs.gov |
| 9/11/96 | 3:36 AM | 4.9 | 62.5 km | 10,000 m | Germany | usgs.gov |
| 2/25/96 | 2:23 PM | 3.1 | 51.7 km | 10,000 m | Germany | usgs.gov |
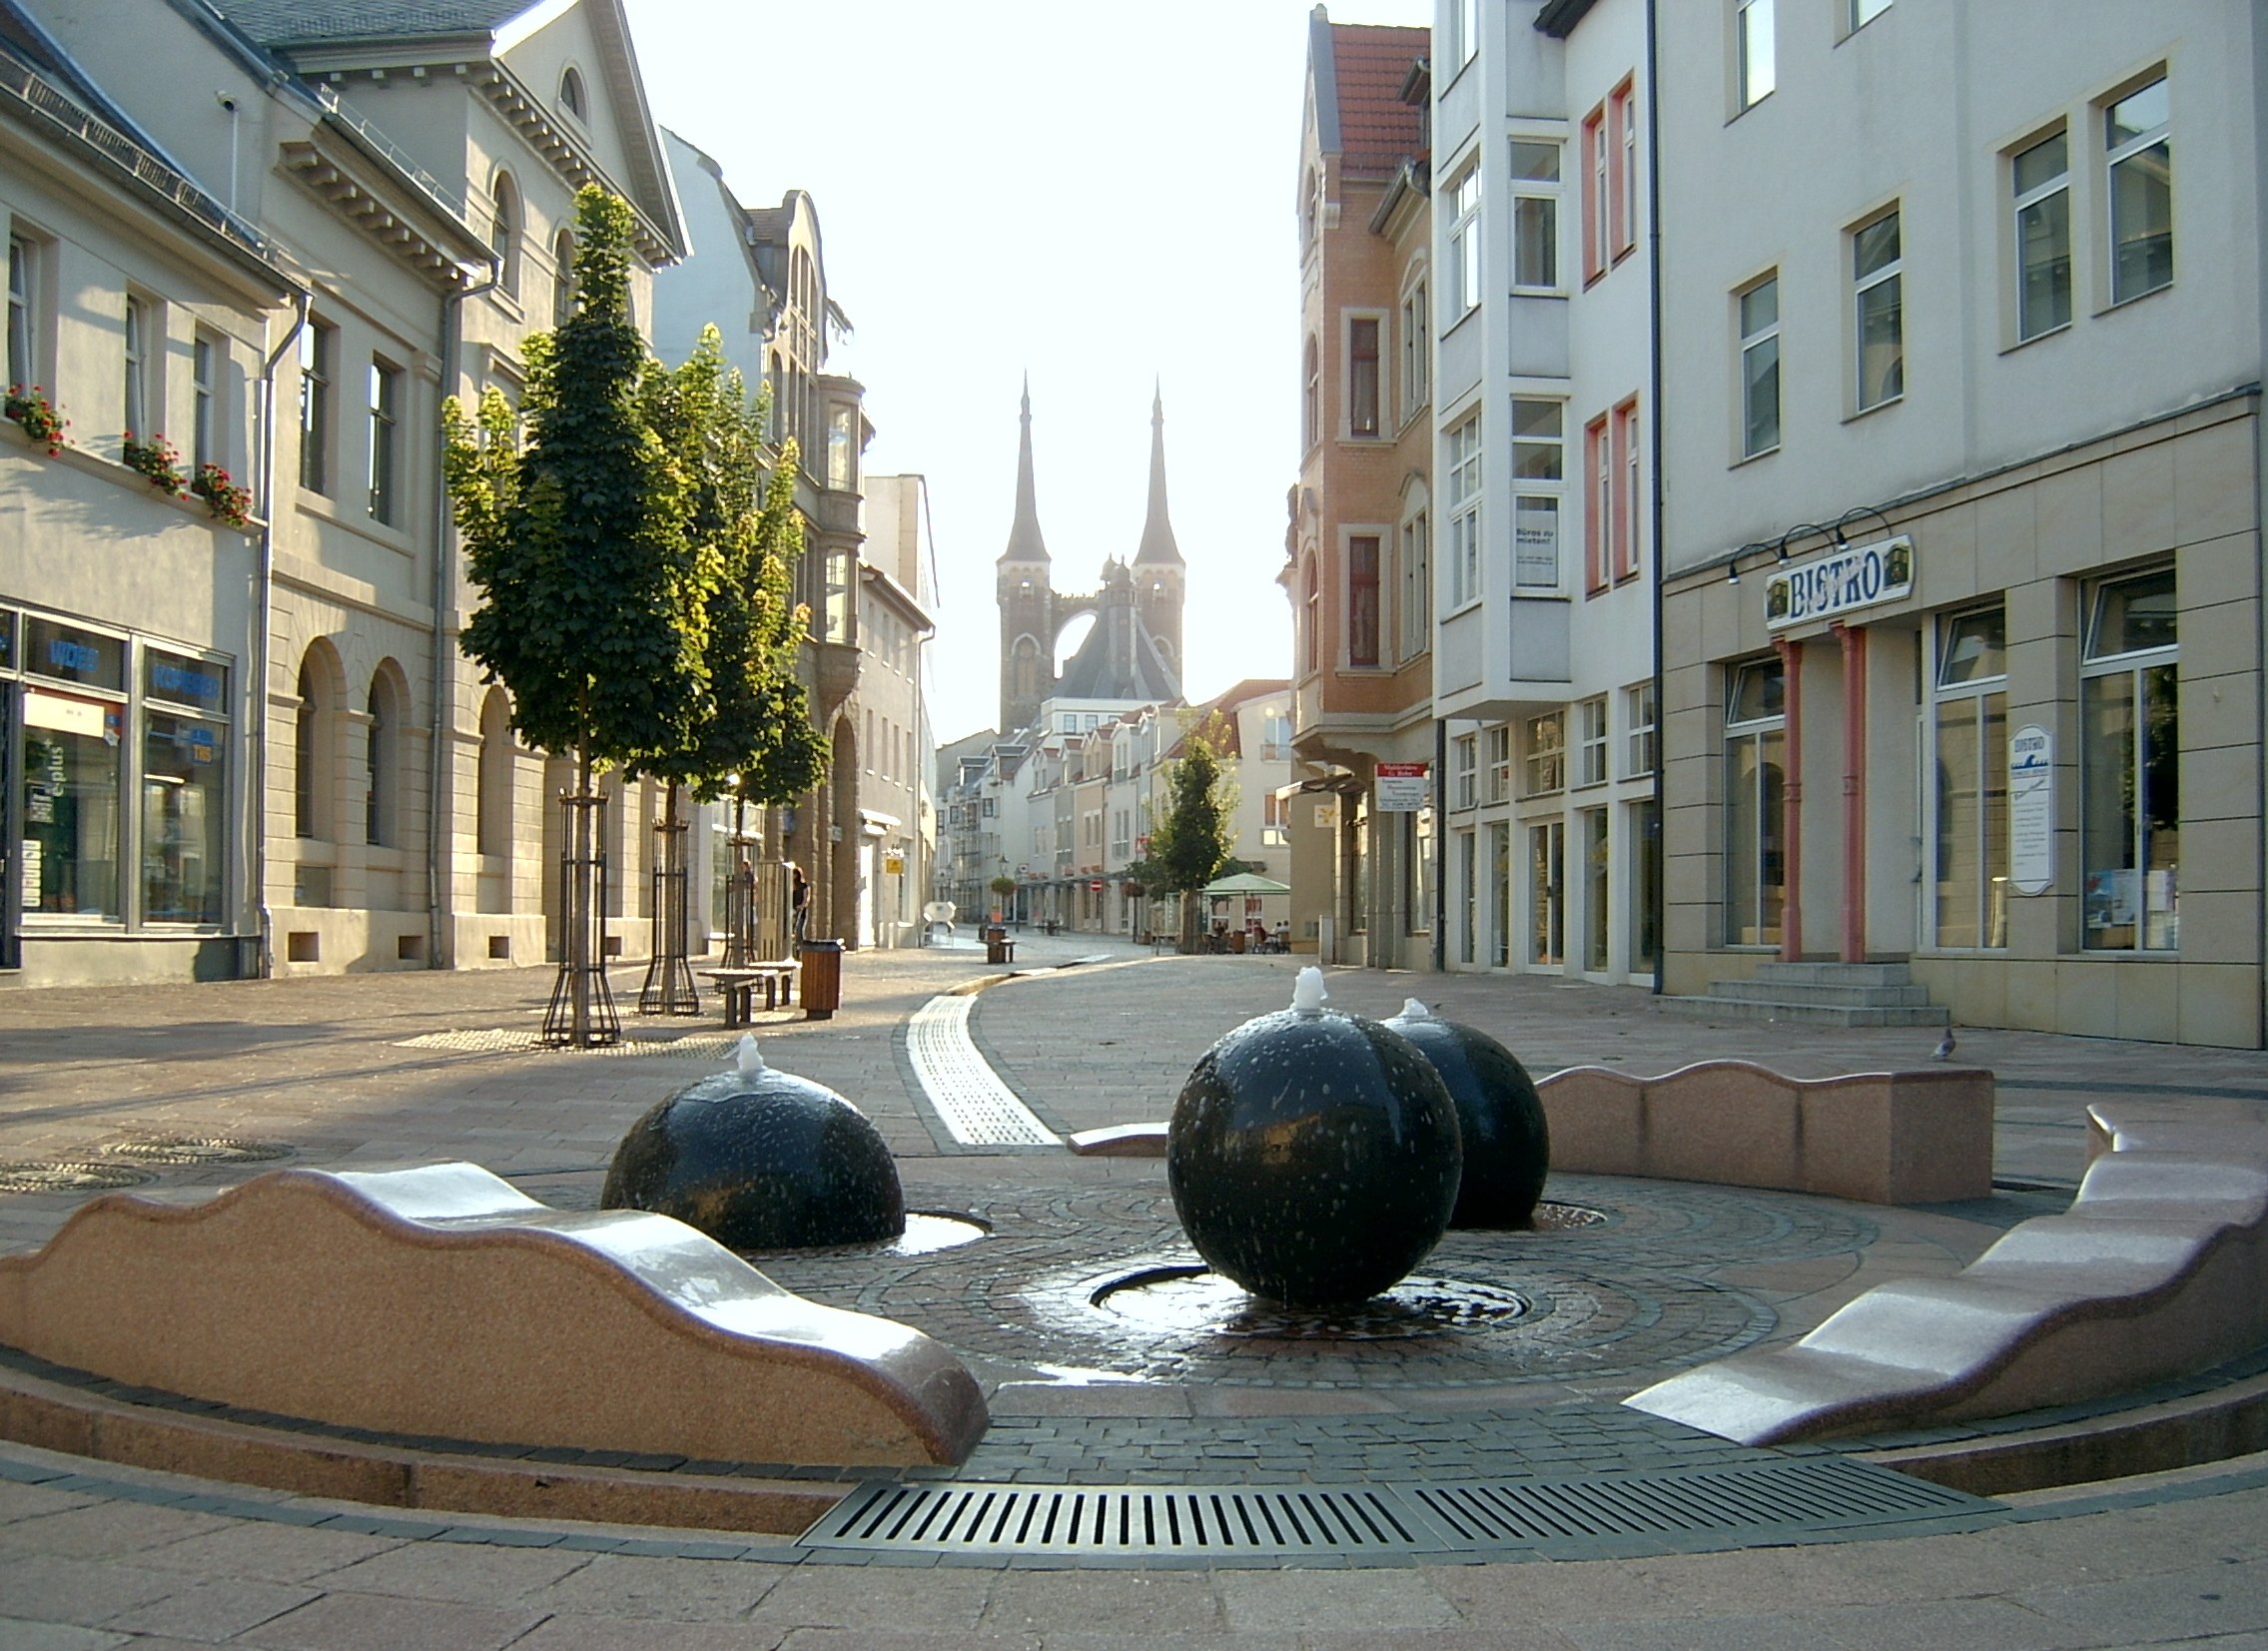
Diebzig
Diebzig is a village and a former municipality in the district of Anhalt-Bitterfeld, in Saxony-Anhalt, Germany. Since 1 January 2010, it is part of the municipality Osternienburger Land.
Diebzig Wikipedia Page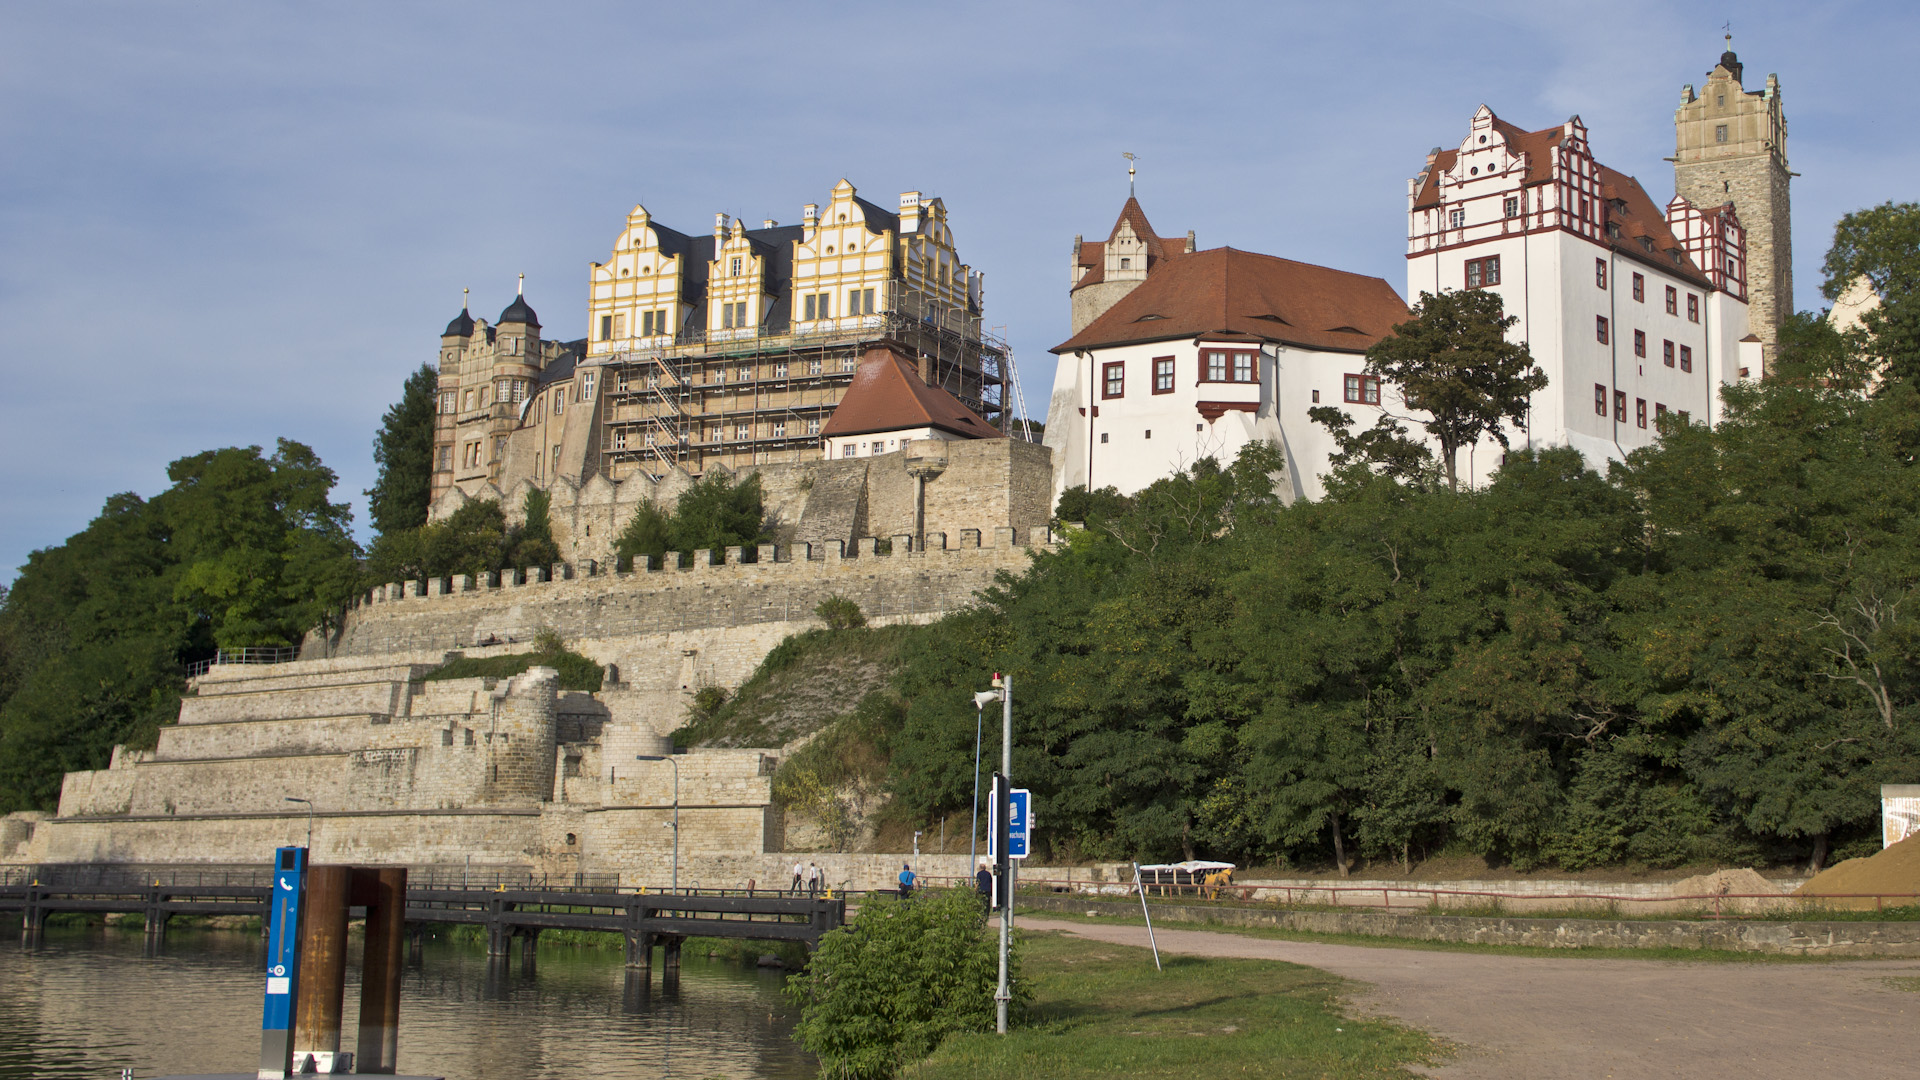

About Our Data
The data on this page is estimated using a number of publicly available tools and resources. It is provided without warranty, and could contain inaccuracies. Use at your own risk.