Industries
Business Distribution by Industry in Dömitz
Dömitz Facts
| Area | 1.8 km² |
| Population | 1,300 |
| Male Population | 631 (48.5%) |
| Female Population | 669 (51.5%) |
| Population change (1975 to 2020) | -39.5% |
| Population change (2000 to 2020) | -22.3% |
| Median Age | 47.9 years (Male: 46.5, Female: 49.4) |
| Area Codes | 38758 |
| Neighborhoods | Polz, Heidhof, Rüterberg, Groß Schmölen |
| Local Time | |
| Timezone | Central European Summer Time |
| Lat & Lng | 53.14080, 11.25017 |
Map of Dömitz
Interactive Map
Dömitz Population
Years 1975 to 2020
| Data | 1975 | 1990 | 2000 | 2015 | 2020 |
|---|---|---|---|---|---|
| Population | 2,150 | 1,919 | 1,674 | 1,339 | 1,300 |
| Population Density | 1,186.2 / km² | 1,058.8 / km² | 923.6 / km² | 738.8 / km² | 717.2 / km² |
Dömitz Population change from 2000 to 2015
Decrease of 20% from year 2000 to 2015
| Location | Change since 1975 | Change since 1990 | Change since 2000 |
|---|---|---|---|
| Dömitz | -37.7% | -30.2% | -20% |
| Mecklenburg-Vorpommern | -19.6% | -12.3% | -10.1% |
| Germany | +2.6% | +2.2% | -1.5% |
Dömitz Median Age
Median Age: 47.9 years
| Location | Median Age | Median Age (Female) | Median Age (Male) |
|---|---|---|---|
| Dömitz | 47.9 yrs | 49.4 yrs | 46.5 yrs |
| Mecklenburg-Vorpommern | 47.5 yrs | 49.1 yrs | 46 yrs |
| Germany | 44.8 yrs | 46 yrs | 43.6 yrs |
Dömitz Population Density
Population Density: 717 / km²
| Location | Population | Area | Density |
|---|---|---|---|
| Dömitz | 1,300 | 1.813 km² | 717 / km² |
| Mecklenburg-Vorpommern | 1.6 million | 23,289 km² | 66.9 / km² |
| Germany | 80.7 million | 358,179.8 km² | 225 / km² |
Dömitz Historical and Projected Population
Estimated Population from 0 to 2100
- JRC (European Commission's Joint Research Centre) work on the GHS built-up grid
- CIESIN (Center for International Earth Science Information Network)
- [Link] Klein Goldewijk, K., Beusen, A., Doelman, J., and Stehfest, E.: Anthropogenic land use estimates for the Holocene – HYDE 3.2, Earth Syst. Sci. Data, 9, 927–953, https://doi.org/10.5194/essd-9-927-2017, 2017.
Neighborhoods in Dömitz
Percentage of businesses by neighborhood in Dömitz
Price Distribution
Business distribution by price for Dömitz
Human Development Index (HDI)
Statistic composite index of life expectancy, education, and per capita income.
Dömitz CO2 Emissions
Carbon Dioxide (CO2) Emissions Per Capita in Tonnes Per Year
| Location | CO2 Emissions | CO2 Emissions Per Capita | CO2 Emissions Intensity |
|---|---|---|---|
| Dömitz | 12,151 tn | 9.35 tn | 6,704.1 tons/km² |
| Mecklenburg-Vorpommern | 14,301,725 tn | 9.18 tn | 614.1 tons/km² |
| Germany | 755,339,039 tn | 9.36 tn | 2,108.8 tons/km² |
| 2013 CO2 emissions (tonnes/year) | 12,151 tn |
| 2013 CO2 emissions (tonnes/year) per capita | 9.35 tn |
| 2013 CO2 emissions intensity (tonnes/km²/year) | 6,704.1 tons/km² |
Recent Nearby Earthquakes
Magnitude 3.0 and greater
| Date▼ | Time↕ | Magnitude↕ | Distance↕ | Depth↕ | Location↕ | Link |
|---|---|---|---|---|---|---|
| 5/19/00 | 7:22 PM | 3.5 | 38.6 km | 10,000 m | Germany | usgs.gov |
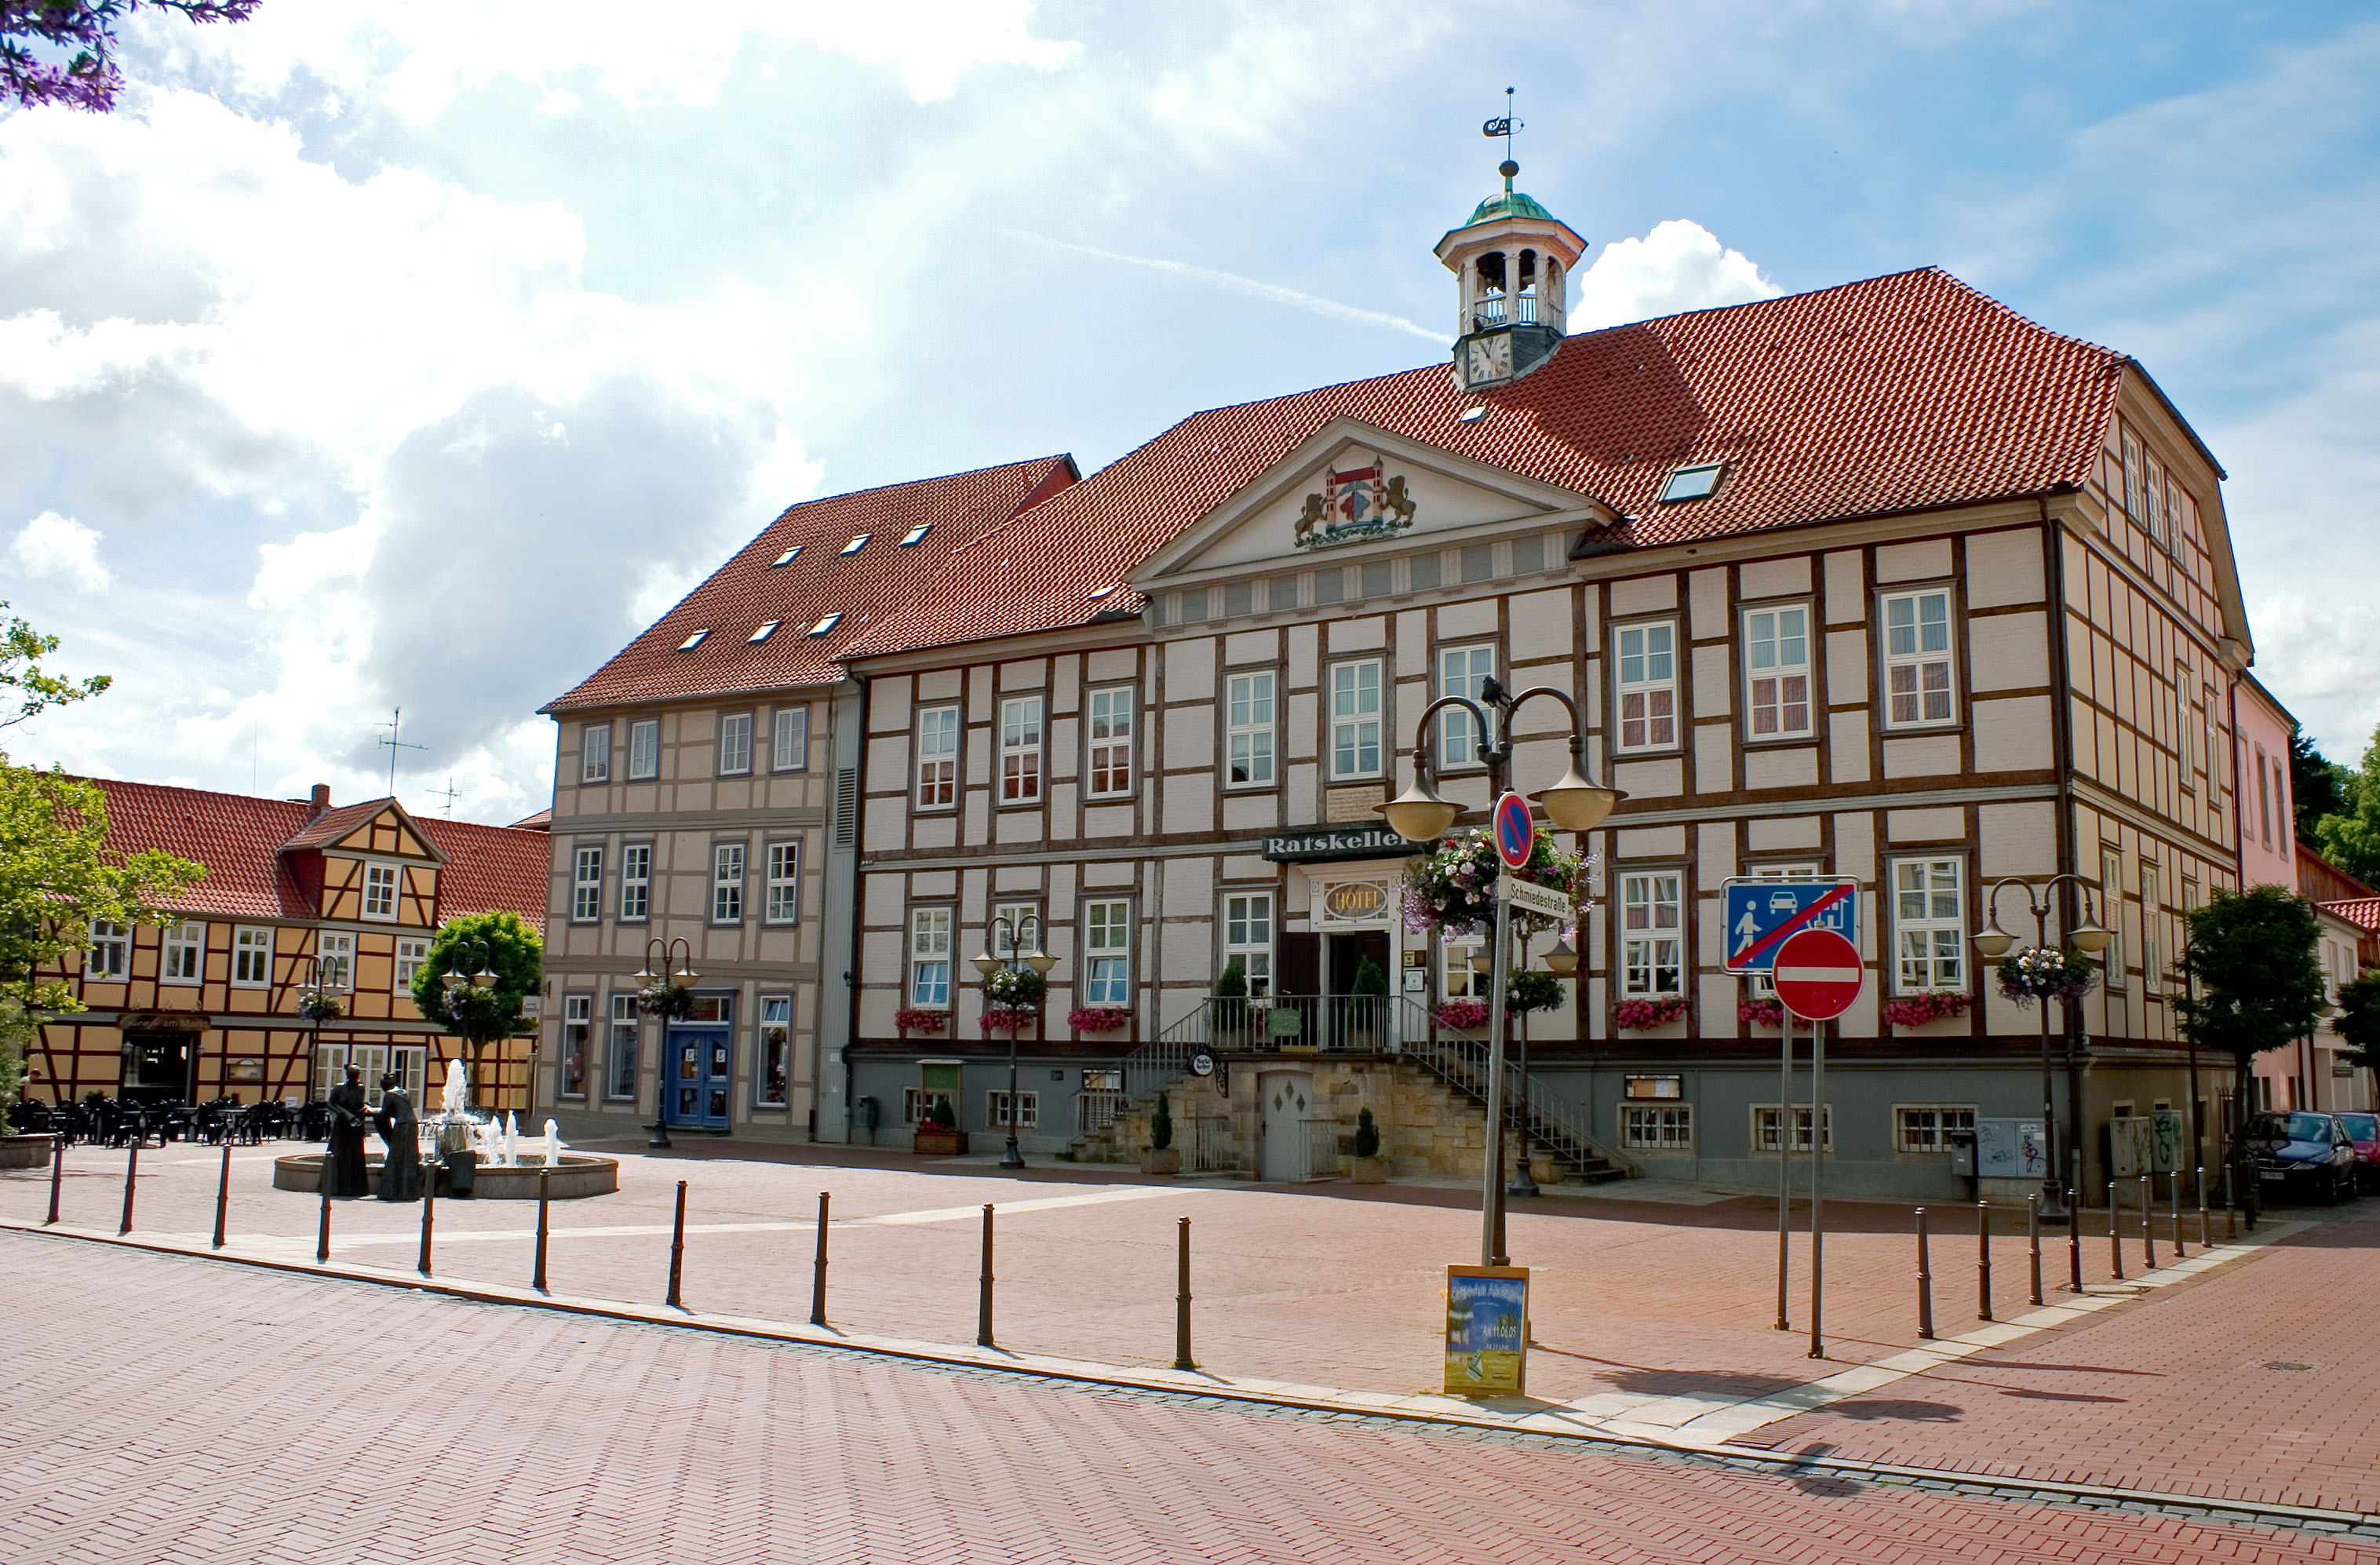
Dömitz
Dömitz (German pronunciation: [ˈdøːmɪts]) is a municipality in the Ludwigslust-Parchim district, in Mecklenburg-Western Pomerania, Germany. It is situated on the right bank of the Elbe, 25 km southwest of Ludwigslust, and 37 km northwest of Wittenber..
Dömitz Wikipedia Page


About Our Data
The data on this page is estimated using a number of publicly available tools and resources. It is provided without warranty, and could contain inaccuracies. Use at your own risk.