Categories in Farge
Industries
Business Distribution by Industry in Farge
| Industry Description | Number of Establishments |
|---|---|
| Construction of buildings | 5 |
Farge Facts
| Area | 11.6 km² |
| Population | 9,930 |
| Male Population | 4,834 (48.7%) |
| Female Population | 5,096 (51.3%) |
| Population change (1975 to 2020) | +10.1% |
| Population change (2000 to 2020) | +2.0% |
| Median Age | 44 years (Male: 42.4, Female: 45.6) |
| Local Time | |
| Timezone | Central European Summer Time |
| Lat & Lng | 53.20164, 8.53059 |
Map of Farge
Interactive Map
Farge Population
Years 1975 to 2020
| Data | 1975 | 1990 | 2000 | 2015 | 2020 |
|---|---|---|---|---|---|
| Population | 9,015 | 9,347 | 9,735 | 9,796 | 9,930 |
| Population Density | 775.5 / km² | 804 / km² | 837.4 / km² | 842.7 / km² | 854.2 / km² |
Sources: JRC (European Commission's Joint Research Centre) work on the GHS built-up grid
Farge Population change from 2000 to 2015
Increase of 0.6% from year 2000 to 2015
| Location | Change since 1975 | Change since 1990 | Change since 2000 |
|---|---|---|---|
| Farge | +8.7% | +4.8% | +0.6% |
| Bremen (state) | +9.3% | +5.9% | +0.5% |
| Germany | +2.6% | +2.2% | -1.5% |
Sources: JRC (European Commission's Joint Research Centre) work on the GHS built-up grid
Farge Median Age
Median Age: 44 years
| Location | Median Age | Median Age (Female) | Median Age (Male) |
|---|---|---|---|
| Farge | 44 yrs | 45.6 yrs | 42.4 yrs |
| Bremen (state) | 44.1 yrs | 45.8 yrs | 42.4 yrs |
| Germany | 44.8 yrs | 46 yrs | 43.6 yrs |
Sources: CIESIN (Center for International Earth Science Information Network)
Farge Population Density
Population Density: 854 / km²
| Location | Population | Area | Density |
|---|---|---|---|
| Farge | 9,930 | 11.6 km² | 854 / km² |
| Bremen (state) | 658,399 | 411.7 km² | 1,599 / km² |
| Germany | 80.7 million | 358,179.8 km² | 225 / km² |
Sources: JRC (European Commission's Joint Research Centre) work on the GHS built-up grid
Farge Historical and Projected Population
Estimated Population from 0 to 2100
Sources:
- JRC (European Commission's Joint Research Centre) work on the GHS built-up grid
- CIESIN (Center for International Earth Science Information Network)
- [Link] Klein Goldewijk, K., Beusen, A., Doelman, J., and Stehfest, E.: Anthropogenic land use estimates for the Holocene – HYDE 3.2, Earth Syst. Sci. Data, 9, 927–953, https://doi.org/10.5194/essd-9-927-2017, 2017.
Human Development Index (HDI)
Statistic composite index of life expectancy, education, and per capita income.
Source: [Link] Kummu, M., Taka, M. &Guillaume, J. Gridded global datasets for Gross Domestic Product and Human Development Index over 1990–2015. Sci Data 5, 180004 (2018) doi:10.1038/sdata.2018.4
Farge CO2 Emissions
Carbon Dioxide (CO2) Emissions Per Capita in Tonnes Per Year
| Location | CO2 Emissions | CO2 Emissions Per Capita | CO2 Emissions Intensity |
|---|---|---|---|
| Farge | 99,266 tn | 10 tn | 8,539 tons/km² |
| Bremen (state) | 6,727,348 tn | 10.22 tn | 16,339 tons/km² |
| Germany | 755,339,039 tn | 9.36 tn | 2,108.8 tons/km² |
Sources: [Link] Moran, D., Kanemoto K; Jiborn, M., Wood, R., Többen, J., and Seto, K.C. (2018) Carbon footprints of 13,000 cities. Environmental Research Letters DOI: 10.1088/1748-9326/aac72a
Farge CO2 Emissions
| 2013 CO2 emissions (tonnes/year) | 99,266 tn |
| 2013 CO2 emissions (tonnes/year) per capita | 10 tn |
| 2013 CO2 emissions intensity (tonnes/km²/year) | 8,539 tons/km² |
Recent Nearby Earthquakes
Magnitude 3.0 and greater
| Date▼ | Time↕ | Magnitude↕ | Distance↕ | Depth↕ | Location↕ | Link |
|---|---|---|---|---|---|---|
| 7/2/06 | 2:37 PM | 3 | 64.1 km | 5,000 m | Germany | usgs.gov |
| 7/15/05 | 3:02 PM | 4 | 31.2 km | 10,000 m | Germany | usgs.gov |
| 10/20/04 | 6:59 AM | 4.5 | 66.2 km | 5,500 m | Germany | usgs.gov |
| 6/2/77 | 1:32 PM | 3.8 | 70 km | 0 m | Germany | usgs.gov |
Source: U.S. Geological Survey (USGS)
Farge
Farge is a small port on the Weser River in the city of Bremen. The bombing of Bremen in World War II attacked Farge targets, including the oil storage and the Valentin submarine pens.
Farge Wikipedia Page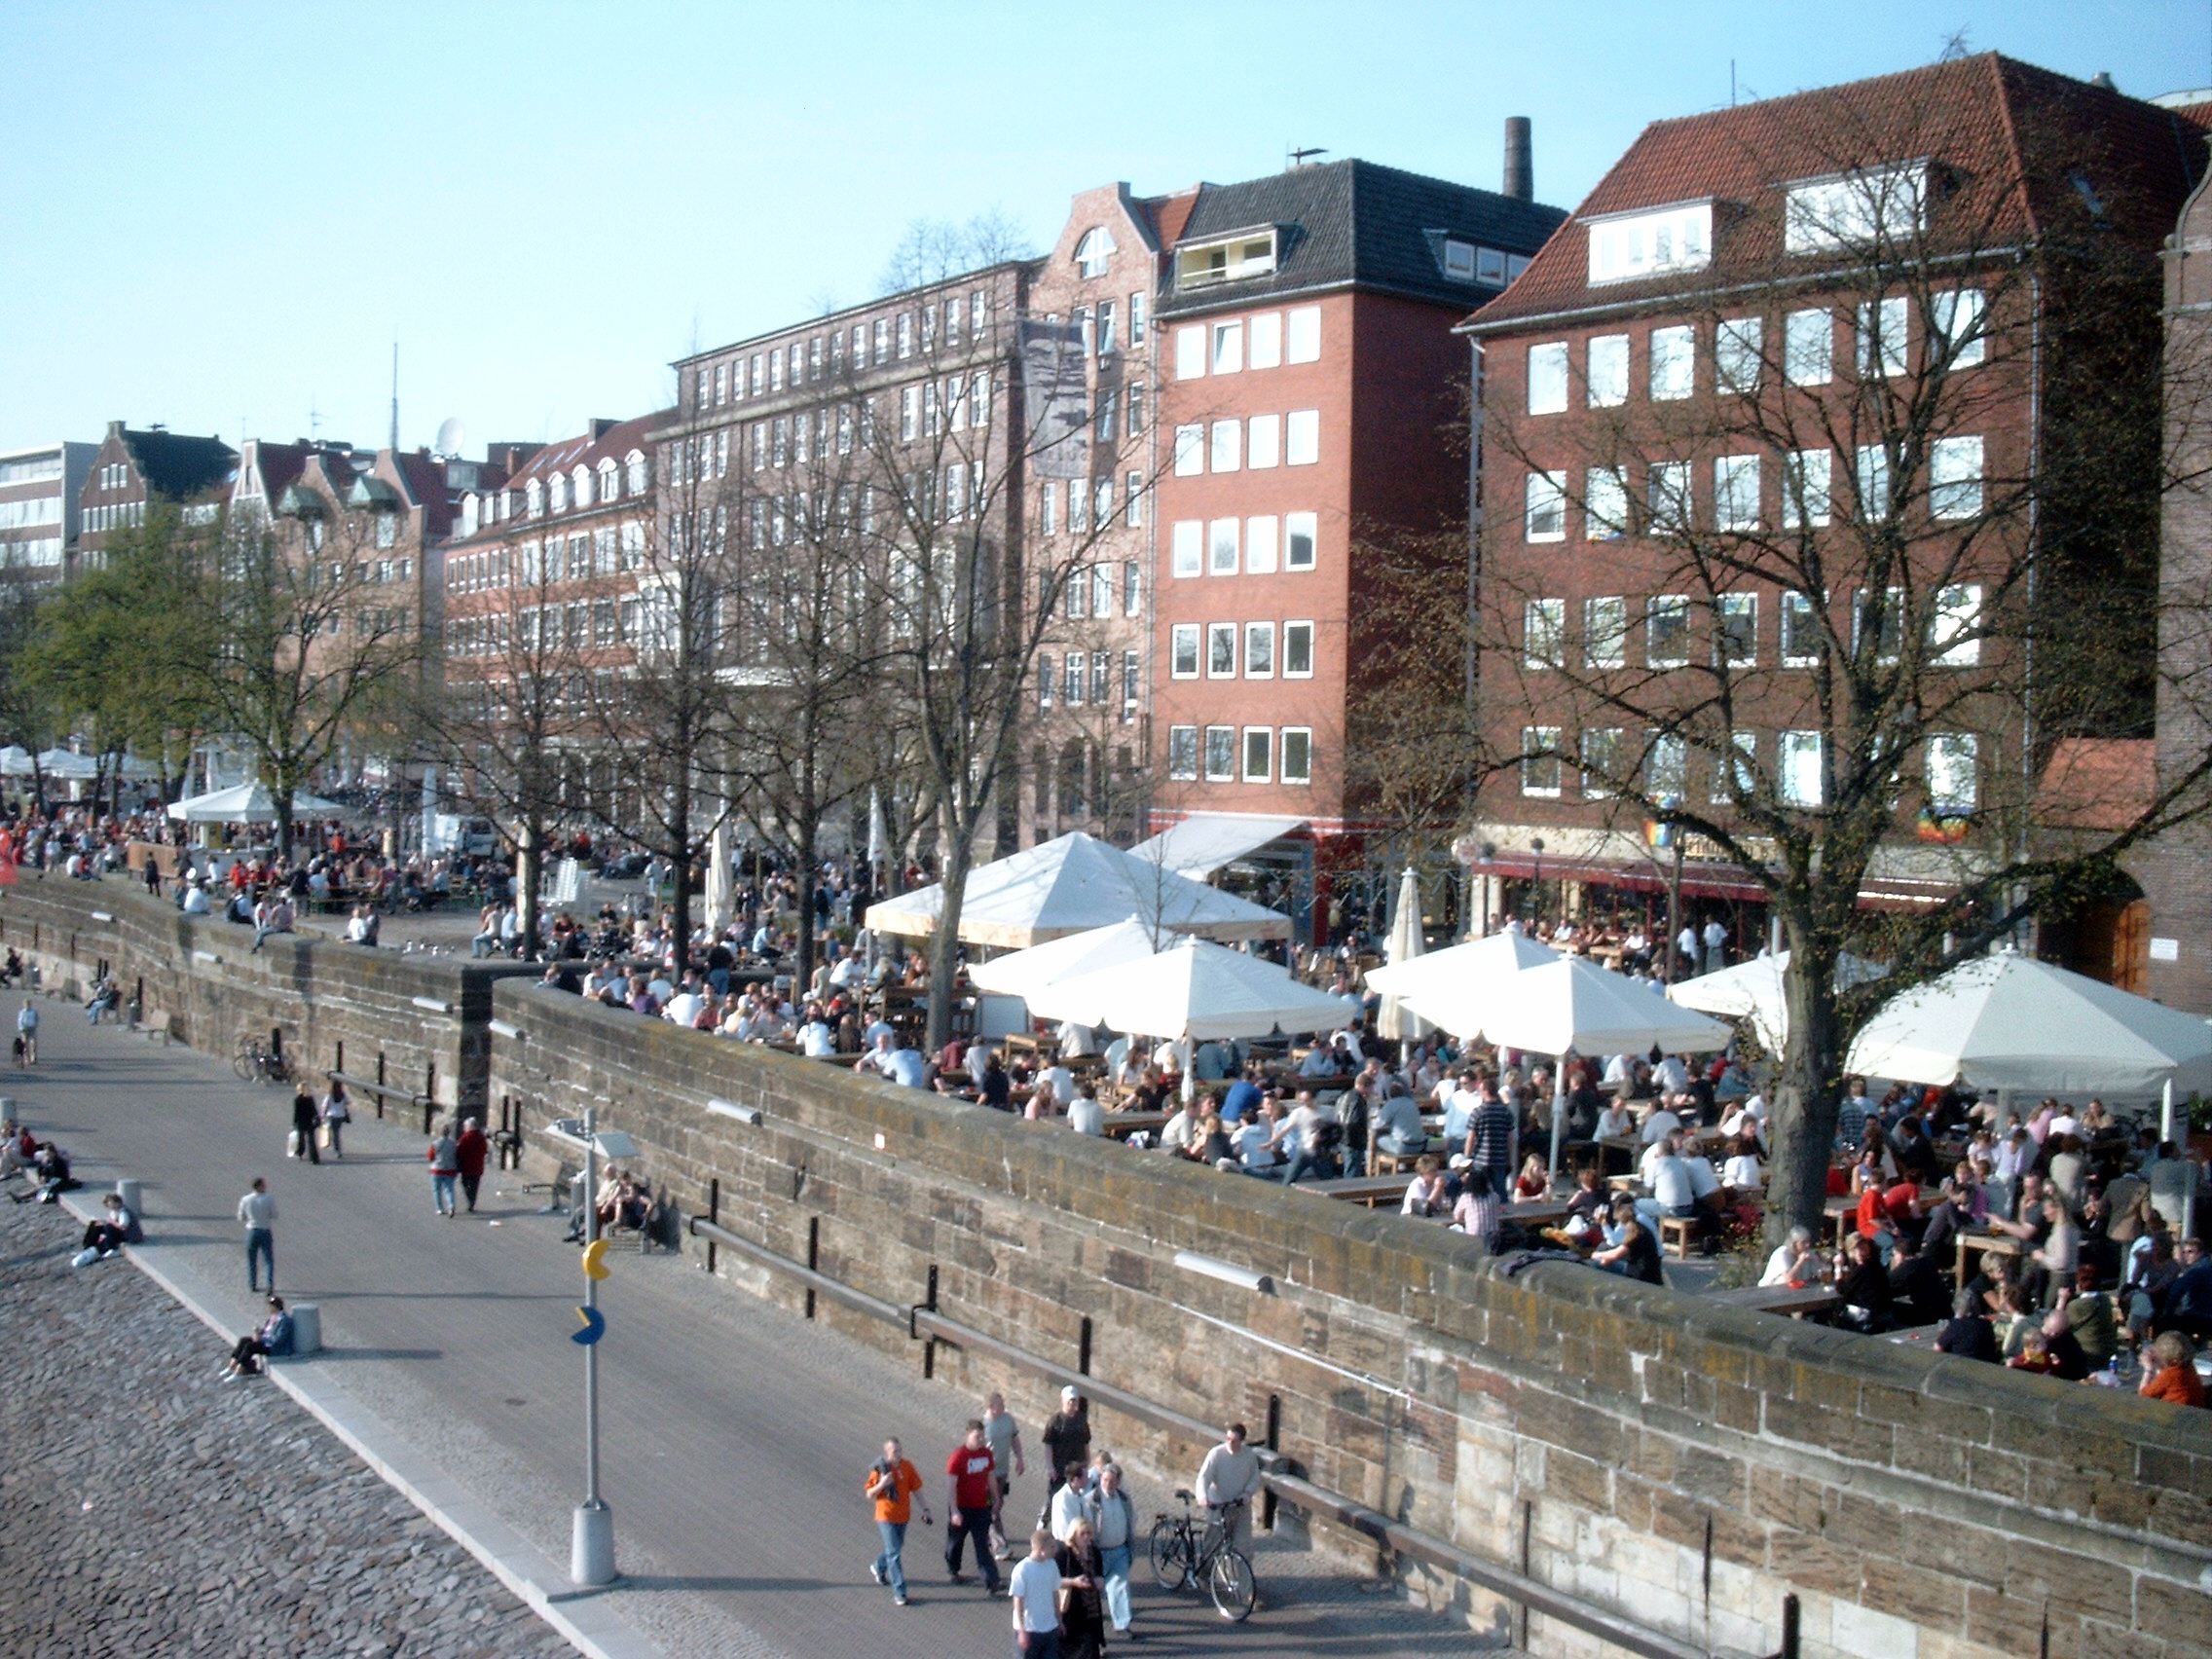


About Our Data
The data on this page is estimated using a number of publicly available tools and resources. It is provided without warranty, and could contain inaccuracies. Use at your own risk.