Categories in Garding
Industries
Business Distribution by Industry in Garding
| Industry Description | Number of Establishments | Average Google Rating |
|---|---|---|
| Shopping | 29 | 4.2 |
| Other accommodation | 21 | 4.6 |
| Health and medical | 20 | 5 |
| Real estate | 11 | 4 |
| Restaurants | 11 | 4.5 |
| Loan companies | 11 | 4.5 |
| Financial services | 10 | 5 |
| General contractors | 8 | 4.7 |
| Car repair | 7 | 4.6 |
| All food and beverage | 7 | 4.2 |
| Electrical installation | 7 | 4.5 |
| Dentists | 7 | 5 |
| Travel agencies | 7 | 4.8 |
| Holiday homes, cabins and resorts | 6 | 4.6 |
| Construction of buildings | 6 | 5 |
| Grocery stores and supermarkets | 6 | 4.3 |
| General cleaning services | 5 | 4.6 |
| Pharmacies and drug stores | 5 | 4.3 |
| Kitchen and bath cabinets and remodel | 5 | 3.4 |
| Playground | 5 | 4 |
| Public parks | 5 | 4 |
Garding Facts
| Area | 1.6 km² |
| Population | 2,247 |
| Male Population | 1,047 (46.6%) |
| Female Population | 1,200 (53.4%) |
| Population change (1975 to 2020) | -1.6% |
| Population change (2000 to 2020) | -3.6% |
| Median Age | 45.9 years (Male: 44.6, Female: 46.9) |
| Area Codes | 4862 |
| Neighborhoods | Sandwehle, Borsthusen, Korndeich, Garding, Augustenkoog |
| Local Time | |
| Timezone | Central European Summer Time |
| Lat & Lng | 54.33056, 8.78056 |
Map of Garding
Interactive Map
Garding Population
Years 1975 to 2020
| Data | 1975 | 1990 | 2000 | 2015 | 2020 |
|---|---|---|---|---|---|
| Population | 2,284 | 2,211 | 2,332 | 2,318 | 2,247 |
| Population Density | 1,405.5 / km² | 1,360.6 / km² | 1,435.1 / km² | 1,426.5 / km² | 1,382.8 / km² |
Garding Population change from 2000 to 2015
Decrease of 0.6% from year 2000 to 2015
| Location | Change since 1975 | Change since 1990 | Change since 2000 |
|---|---|---|---|
| Garding | +1.5% | +4.8% | -0.6% |
| Schleswig-Holstein | +14.9% | +9.1% | +2.3% |
| Germany | +2.6% | +2.2% | -1.5% |
Garding Median Age
Median Age: 45.9 years
| Location | Median Age | Median Age (Female) | Median Age (Male) |
|---|---|---|---|
| Garding | 45.9 yrs | 46.9 yrs | 44.6 yrs |
| Schleswig-Holstein | 45.3 yrs | 46.3 yrs | 44.3 yrs |
| Germany | 44.8 yrs | 46 yrs | 43.6 yrs |
Garding Population Density
Population Density: 1,383 / km²
| Location | Population | Area | Density |
|---|---|---|---|
| Garding | 2,247 | 1.625 km² | 1,383 / km² |
| Schleswig-Holstein | 2.8 million | 15,915.1 km² | 177 / km² |
| Germany | 80.7 million | 358,179.8 km² | 225 / km² |
Garding Historical and Projected Population
Estimated Population from 0 to 2100
- JRC (European Commission's Joint Research Centre) work on the GHS built-up grid
- CIESIN (Center for International Earth Science Information Network)
- [Link] Klein Goldewijk, K., Beusen, A., Doelman, J., and Stehfest, E.: Anthropogenic land use estimates for the Holocene – HYDE 3.2, Earth Syst. Sci. Data, 9, 927–953, https://doi.org/10.5194/essd-9-927-2017, 2017.
Neighborhoods in Garding
Percentage of businesses by neighborhood in Garding
Price Distribution
Business distribution by price for Garding
Human Development Index (HDI)
Statistic composite index of life expectancy, education, and per capita income.
Garding CO2 Emissions
Carbon Dioxide (CO2) Emissions Per Capita in Tonnes Per Year
| Location | CO2 Emissions | CO2 Emissions Per Capita | CO2 Emissions Intensity |
|---|---|---|---|
| Garding | 21,117 tn | 9.4 tn | 12,994.8 tons/km² |
| Schleswig-Holstein | 27,326,926 tn | 9.68 tn | 1,717 tons/km² |
| Germany | 755,339,039 tn | 9.36 tn | 2,108.8 tons/km² |
| 2013 CO2 emissions (tonnes/year) | 21,117 tn |
| 2013 CO2 emissions (tonnes/year) per capita | 9.4 tn |
| 2013 CO2 emissions intensity (tonnes/km²/year) | 12,994.8 tons/km² |
Garding
Garding is a town in the district of Nordfriesland, Schleswig-Holstein, Germany. It has a population of 2,700 (as of 2007). It is located in the Eiderstedt peninsula, and part of the Amt Eiderstedt.
Garding Wikipedia Page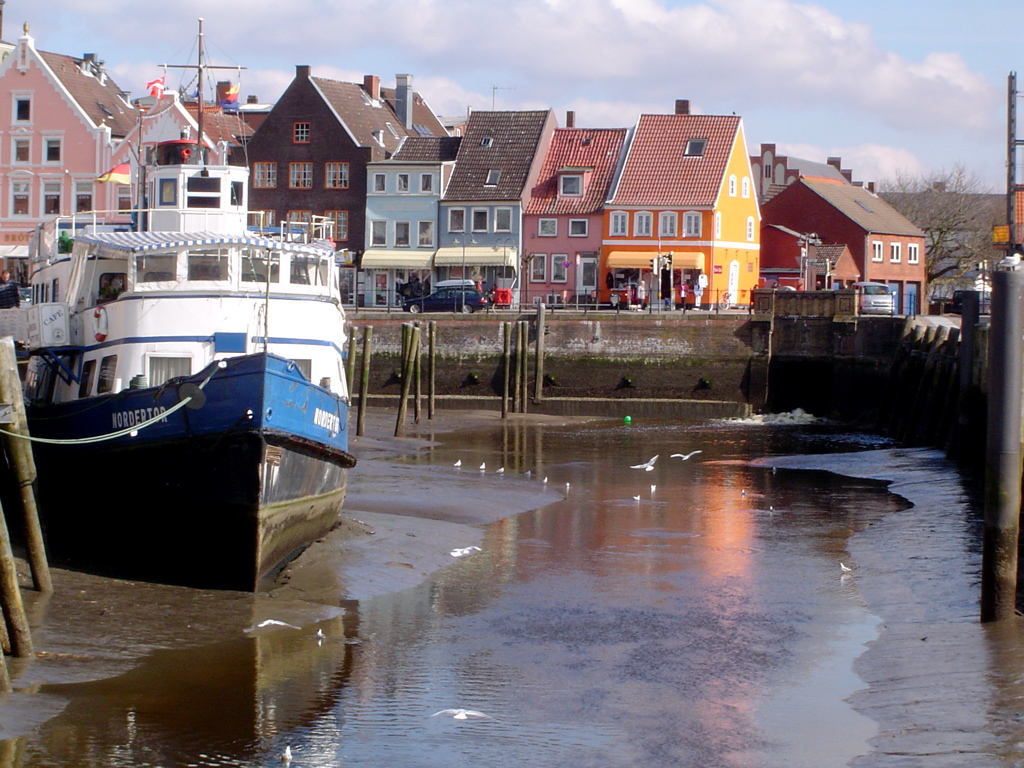


About Our Data
The data on this page is estimated using a number of publicly available tools and resources. It is provided without warranty, and could contain inaccuracies. Use at your own risk.