Categories in Großbottwar
Industries
Business Distribution by Industry in Großbottwar
| Industry Description | Number of Establishments |
|---|---|
| Corporate management | 51 |
| Restaurants | 33 |
| Construction of buildings | 32 |
| Shopping | 28 |
| Real estate | 23 |
| Electronics stores | 18 |
| Car repair | 16 |
| Beauty salons | 16 |
| Playground | 15 |
| Grocery stores and supermarkets | 13 |
Großbottwar Facts
| Area | 1.7 km² |
| Population | 4,715 |
| Male Population | 2,354 (49.9%) |
| Female Population | 2,361 (50.1%) |
| Population change (1975 to 2020) | +10.8% |
| Population change (2000 to 2020) | -2.5% |
| Median Age | 43.3 years (Male: 42.5, Female: 44.2) |
| Area Codes | 7148 |
| Neighborhoods | Winzerhausen, Hof und Lembach, Lembach, Holzweiler Hof, Sauserhof |
| Local Time | |
| Timezone | Central European Summer Time |
| Lat & Lng | 49.00147, 9.29348 |
| Postal Codes | 71723 |
Map of Großbottwar
Interactive Map
Großbottwar Population
Years 1975 to 2020
| Data | 1975 | 1990 | 2000 | 2015 | 2020 |
|---|---|---|---|---|---|
| Population | 4,255 | 4,502 | 4,838 | 4,826 | 4,715 |
| Population Density | 2,521.5 / km² | 2,667.9 / km² | 2,867 / km² | 2,859.9 / km² | 2,794.1 / km² |
Großbottwar Population change from 2000 to 2015
Decrease of 0.2% from year 2000 to 2015
| Location | Change since 1975 | Change since 1990 | Change since 2000 |
|---|---|---|---|
| Großbottwar | +13.4% | +7.2% | -0.2% |
| Baden-Württemberg | +10.4% | +6.4% | +0.8% |
| Germany | +2.6% | +2.2% | -1.5% |
Großbottwar Median Age
Median Age: 43.3 years
| Location | Median Age | Median Age (Female) | Median Age (Male) |
|---|---|---|---|
| Großbottwar | 43.3 yrs | 44.2 yrs | 42.5 yrs |
| Baden-Württemberg | 43.5 yrs | 44.6 yrs | 42.4 yrs |
| Germany | 44.8 yrs | 46 yrs | 43.6 yrs |
Großbottwar Population Density
Population Density: 2,794 / km²
| Location | Population | Area | Density |
|---|---|---|---|
| Großbottwar | 4,715 | 1.688 km² | 2,794 / km² |
| Baden-Württemberg | 10.6 million | 35,793.9 km² | 297 / km² |
| Germany | 80.7 million | 358,179.8 km² | 225 / km² |
Großbottwar Historical and Projected Population
Estimated Population from 1200 to 2100
- JRC (European Commission's Joint Research Centre) work on the GHS built-up grid
- CIESIN (Center for International Earth Science Information Network)
- [Link] Klein Goldewijk, K., Beusen, A., Doelman, J., and Stehfest, E.: Anthropogenic land use estimates for the Holocene – HYDE 3.2, Earth Syst. Sci. Data, 9, 927–953, https://doi.org/10.5194/essd-9-927-2017, 2017.
Neighborhoods in Großbottwar
Percentage of businesses by neighborhood in Großbottwar
Price Distribution
Business distribution by price for Großbottwar
Human Development Index (HDI)
Statistic composite index of life expectancy, education, and per capita income.
Großbottwar CO2 Emissions
Carbon Dioxide (CO2) Emissions Per Capita in Tonnes Per Year
| Location | CO2 Emissions | CO2 Emissions Per Capita | CO2 Emissions Intensity |
|---|---|---|---|
| Großbottwar | 47,102 tn | 9.99 tn | 27,912.2 tons/km² |
| Baden-Württemberg | 100,584,924 tn | 9.47 tn | 2,810.1 tons/km² |
| Germany | 755,339,039 tn | 9.36 tn | 2,108.8 tons/km² |
| 2013 CO2 emissions (tonnes/year) | 47,102 tn |
| 2013 CO2 emissions (tonnes/year) per capita | 9.99 tn |
| 2013 CO2 emissions intensity (tonnes/km²/year) | 27,912.2 tons/km² |
Natural Hazards Risk
Relative risk out of 10
| Hazard | Risk Level |
|---|---|
| Flood | High (10) |
| Earthquake | Low (2) |
* Risk, particularly concerning flood or landslide, may not be for the entire area.
- Dilley, M., R.S. Chen, U. Deichmann, A.L. Lerner-Lam, M. Arnold, J. Agwe, P. Buys, O. Kjekstad, B. Lyon, and G. Yetman. 2005. Natural Disaster Hotspots: A Global Risk Analysis. Washington, D.C.: World Bank. https://doi.org/10.1596/0-8213-5930-4.
- Center for Hazards and Risk Research - CHRR - Columbia University, Center for International Earth Science Information Network - CIESIN - Columbia University. 2005. Global Flood Hazard Frequency and Distribution. Palisades, NY: NASA Socioeconomic Data and Applications Center (SEDAC). https://doi.org/10.7927/H4668B3D.
- Center for Hazards and Risk Research - CHRR - Columbia University, Center for International Earth Science Information Network - CIESIN - Columbia University. 2005. Global Earthquake Hazard Distribution - Peak Ground Acceleration. Palisades, NY: NASA Socioeconomic Data and Applications Center (SEDAC). https://doi.org/10.7927/H4BZ63ZS.
Recent Nearby Earthquakes
Magnitude 3.0 and greater
| Date▼ | Time↕ | Magnitude↕ | Distance↕ | Depth↕ | Location↕ | Link |
|---|---|---|---|---|---|---|
| 2/16/08 | 9:48 AM | 3.2 | 81.4 km | 10,000 m | Germany | usgs.gov |
| 9/1/07 | 6:43 PM | 3 | 65.6 km | 10,000 m | Germany | usgs.gov |
| 8/16/07 | 9:36 AM | 3.4 | 92.3 km | 6,000 m | Germany | usgs.gov |
| 9/13/05 | 6:54 PM | 3.1 | 74 km | 9,000 m | Germany | usgs.gov |
| 2/10/05 | 3:32 PM | 3.3 | 75.2 km | 10,000 m | Germany | usgs.gov |
| 6/22/04 | 1:49 AM | 3.2 | 46.1 km | 8,500 m | Germany | usgs.gov |
| 5/31/04 | 11:52 PM | 3 | 98.6 km | 16,000 m | Germany | usgs.gov |
| 4/8/04 | 3:09 AM | 3.2 | 74.8 km | 8,000 m | Germany | usgs.gov |
| 4/11/03 | 4:04 PM | 3.4 | 89.6 km | 7,000 m | Germany | usgs.gov |
| 3/22/03 | 1:36 PM | 4.7 | 90.6 km | 6,000 m | Germany | usgs.gov |
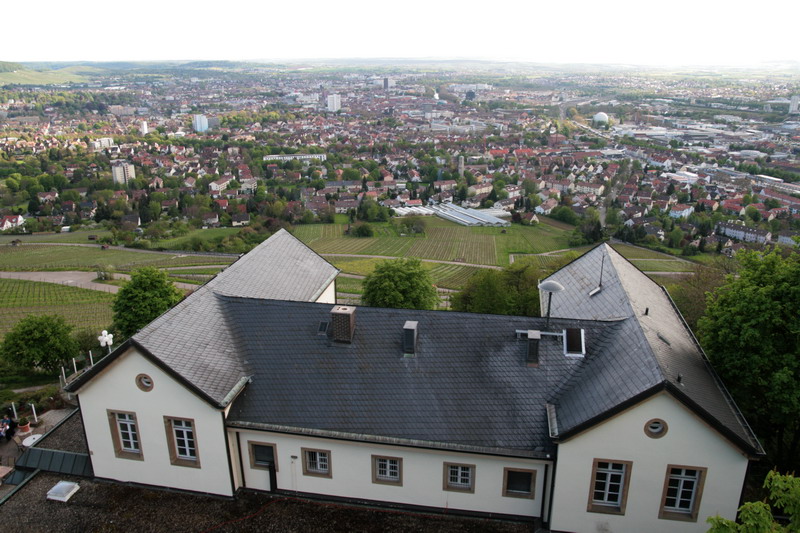
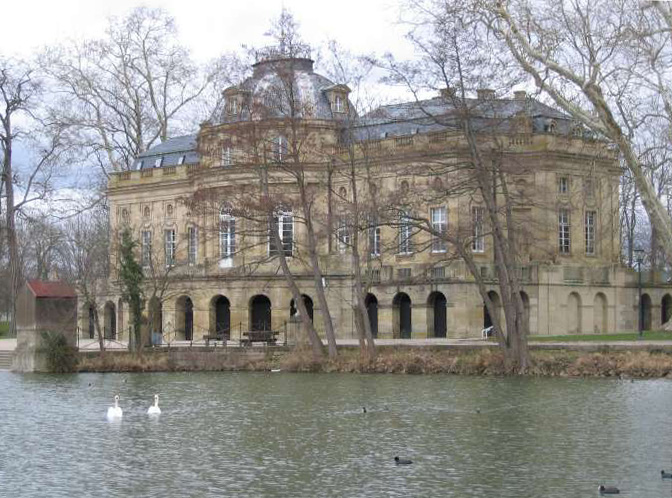
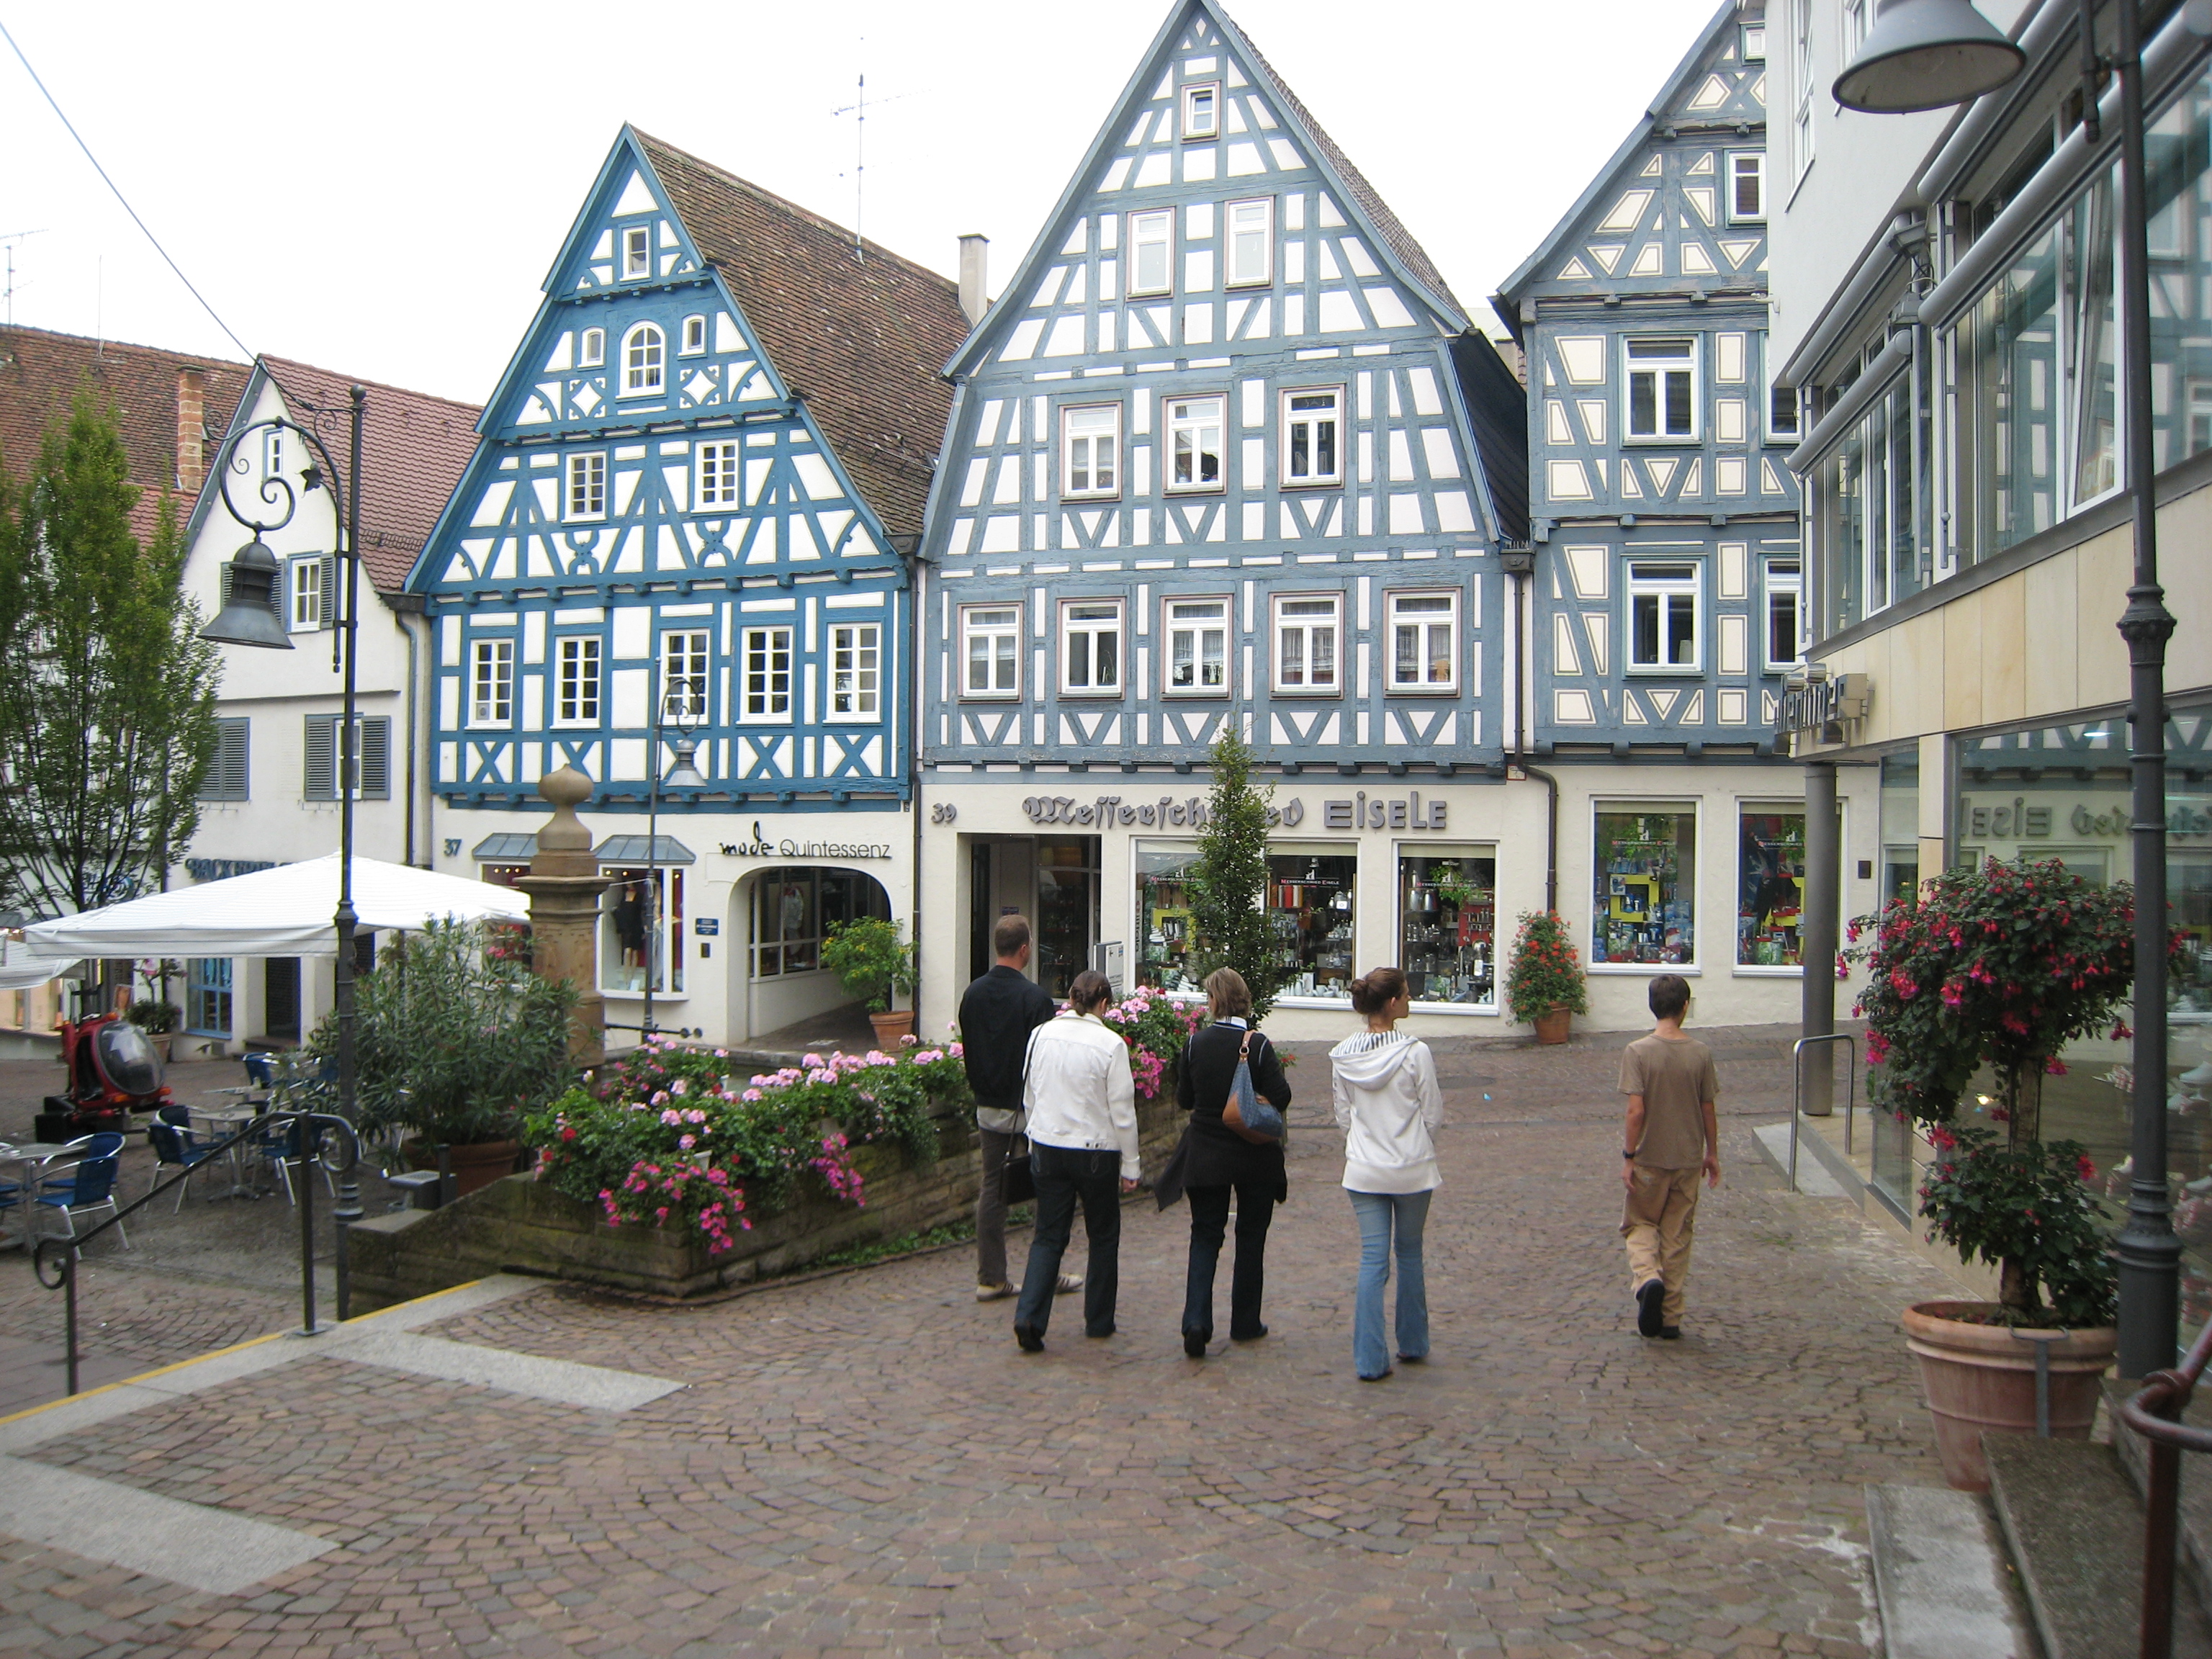
Großbottwar
Großbottwar (or Grossbottwar) is a town in the Ludwigsburg district of Baden-Württemberg, Germany. It sits within the Neckar River basin and is located on a tourist route through the Württemberg wine region. The Großbottwar region has been inhabited ..
Großbottwar Wikipedia Page
About Our Data
The data on this page is estimated using a number of publicly available tools and resources. It is provided without warranty, and could contain inaccuracies. Use at your own risk.