Kladow Facts
| Area | 14.6 km² |
| Population | 22,130 |
| Male Population | 10,764 (48.6%) |
| Female Population | 11,366 (51.4%) |
| Population change (1975 to 2020) | +52.5% |
| Population change (2000 to 2020) | +29.2% |
| Median Age | 43 years (Male: 42, Female: 44) |
| GDP per capita (PPP) | $57,120 (2022) |
| Neighborhoods | Kladow, Fahrland |
| Local Time | |
| Timezone | Central European Summer Time |
| Lat & Lng | 52.45423, 13.14445 |
| Postal Codes | 14089 |
Map of Kladow
Interactive Map
Kladow Population
Years 1975 to 2030
| Data | 1975 | 1990 | 2000 | 2015 | 2020 | 2025* | 2030* |
|---|---|---|---|---|---|---|---|
| Population | 14,512 | 14,205 | 17,127 | 20,045 | 22,130 | 22,577 | 22,814 |
| Population Density | 992.3 / km² | 971.3 / km² | 1,171.1 / km² | 1,370.6 / km² | 1,513.2 / km² | 1,543.7 / km² | 1,559.9 / km² |
* Projected
Sources: JRC (European Commission's Joint Research Centre) work on the GHS built-up gridKladow Population change from 2000 to 2020
Increase of 29.2% from year 2000 to 2020
| Location | Change since 1975 | Change since 1990 | Change since 2000 |
|---|---|---|---|
| Kladow | +52.5% | +55.8% | +29.2% |
| Berlin | — | — | — |
| Germany | — | — | — |
Sources: JRC (European Commission's Joint Research Centre) work on the GHS built-up grid
Kladow Median Age
Median Age: 43 years
| Location | Median Age | Median Age (Female) | Median Age (Male) |
|---|---|---|---|
| Kladow | 43 yrs | 44 yrs | 42 yrs |
| Berlin | 43 yrs | 44.1 yrs | 42 yrs |
| Germany | 44.8 yrs | 46 yrs | 43.6 yrs |
Sources: CIESIN (Center for International Earth Science Information Network)
Kladow Population Density
Population Density: 1,513 / km²
| Location | Population | Area | Density |
|---|---|---|---|
| Kladow | 22,130 | 14.6 km² | 1,513 / km² |
| Berlin | 3.3 million | 891.8 km² | 3,754 / km² |
| Germany | 80.7 million | 358,179.8 km² | 225 / km² |
Sources: JRC (European Commission's Joint Research Centre) work on the GHS built-up grid
Kladow Historical and Projected Population
Estimated Population from 500 to 2100
Sources:
- JRC (European Commission's Joint Research Centre) work on the GHS built-up grid
- CIESIN (Center for International Earth Science Information Network)
- [Link] Klein Goldewijk, K., Beusen, A., Doelman, J., and Stehfest, E.: Anthropogenic land use estimates for the Holocene – HYDE 3.2, Earth Syst. Sci. Data, 9, 927–953, https://doi.org/10.5194/essd-9-927-2017, 2017.
Human Development Index (HDI)
Statistic composite index of life expectancy, education, and per capita income.
Source: [Link] Kummu, M., Taka, M. &Guillaume, J. Gridded global datasets for Gross Domestic Product and Human Development Index over 1990–2015. Sci Data 5, 180004 (2018) doi:10.1038/sdata.2018.4
Kladow Gross Domestic Product (GDP)
GDP per capita, PPP (constant 2017 international $)
| Data | 1990 | 1995 | 2000 | 2005 | 2010 | 2015 | 2020 | 2022 |
|---|---|---|---|---|---|---|---|---|
| GDP per capita | $36,937 | $39,577 | $43,167 | $41,513 | $46,464 | $50,509 | $54,872 | $57,120 |
| Total GDP | $727.5M | $828.6M | $921.9M | $952.2M | $1.2B | $1.4B | $1.7B | $1.8B |
Source: [Link] Kummu, M., Kosonen, M. & Masoumzadeh Sayyar, S. Downscaled gridded global dataset for gross domestic product (GDP) per capita PPP over 1990–2022. Sci Data 12, 178 (2025) doi:10.1038/s41597-025-04487-x
Kladow CO2 Emissions
Carbon Dioxide (CO2) Emissions Per Capita in Tonnes Per Year
| Location | CO2 Emissions | CO2 Emissions Per Capita | CO2 Emissions Intensity |
|---|---|---|---|
| Kladow | 230,555 tn | 10.42 tn | 15,764.4 tons/km² |
| Berlin | 34,879,850 tn | 10.42 tn | 39,110.2 tons/km² |
| Germany | 755,339,039 tn | 9.36 tn | 2,108.8 tons/km² |
Sources: [Link] Moran, D., Kanemoto K; Jiborn, M., Wood, R., Többen, J., and Seto, K.C. (2018) Carbon footprints of 13,000 cities. Environmental Research Letters DOI: 10.1088/1748-9326/aac72a
Kladow CO2 Emissions
| 2013 CO2 emissions (tonnes/year) | 230,555 tn |
| 2013 CO2 emissions (tonnes/year) per capita | 10.42 tn |
| 2013 CO2 emissions intensity (tonnes/km²/year) | 15,764.4 tons/km² |
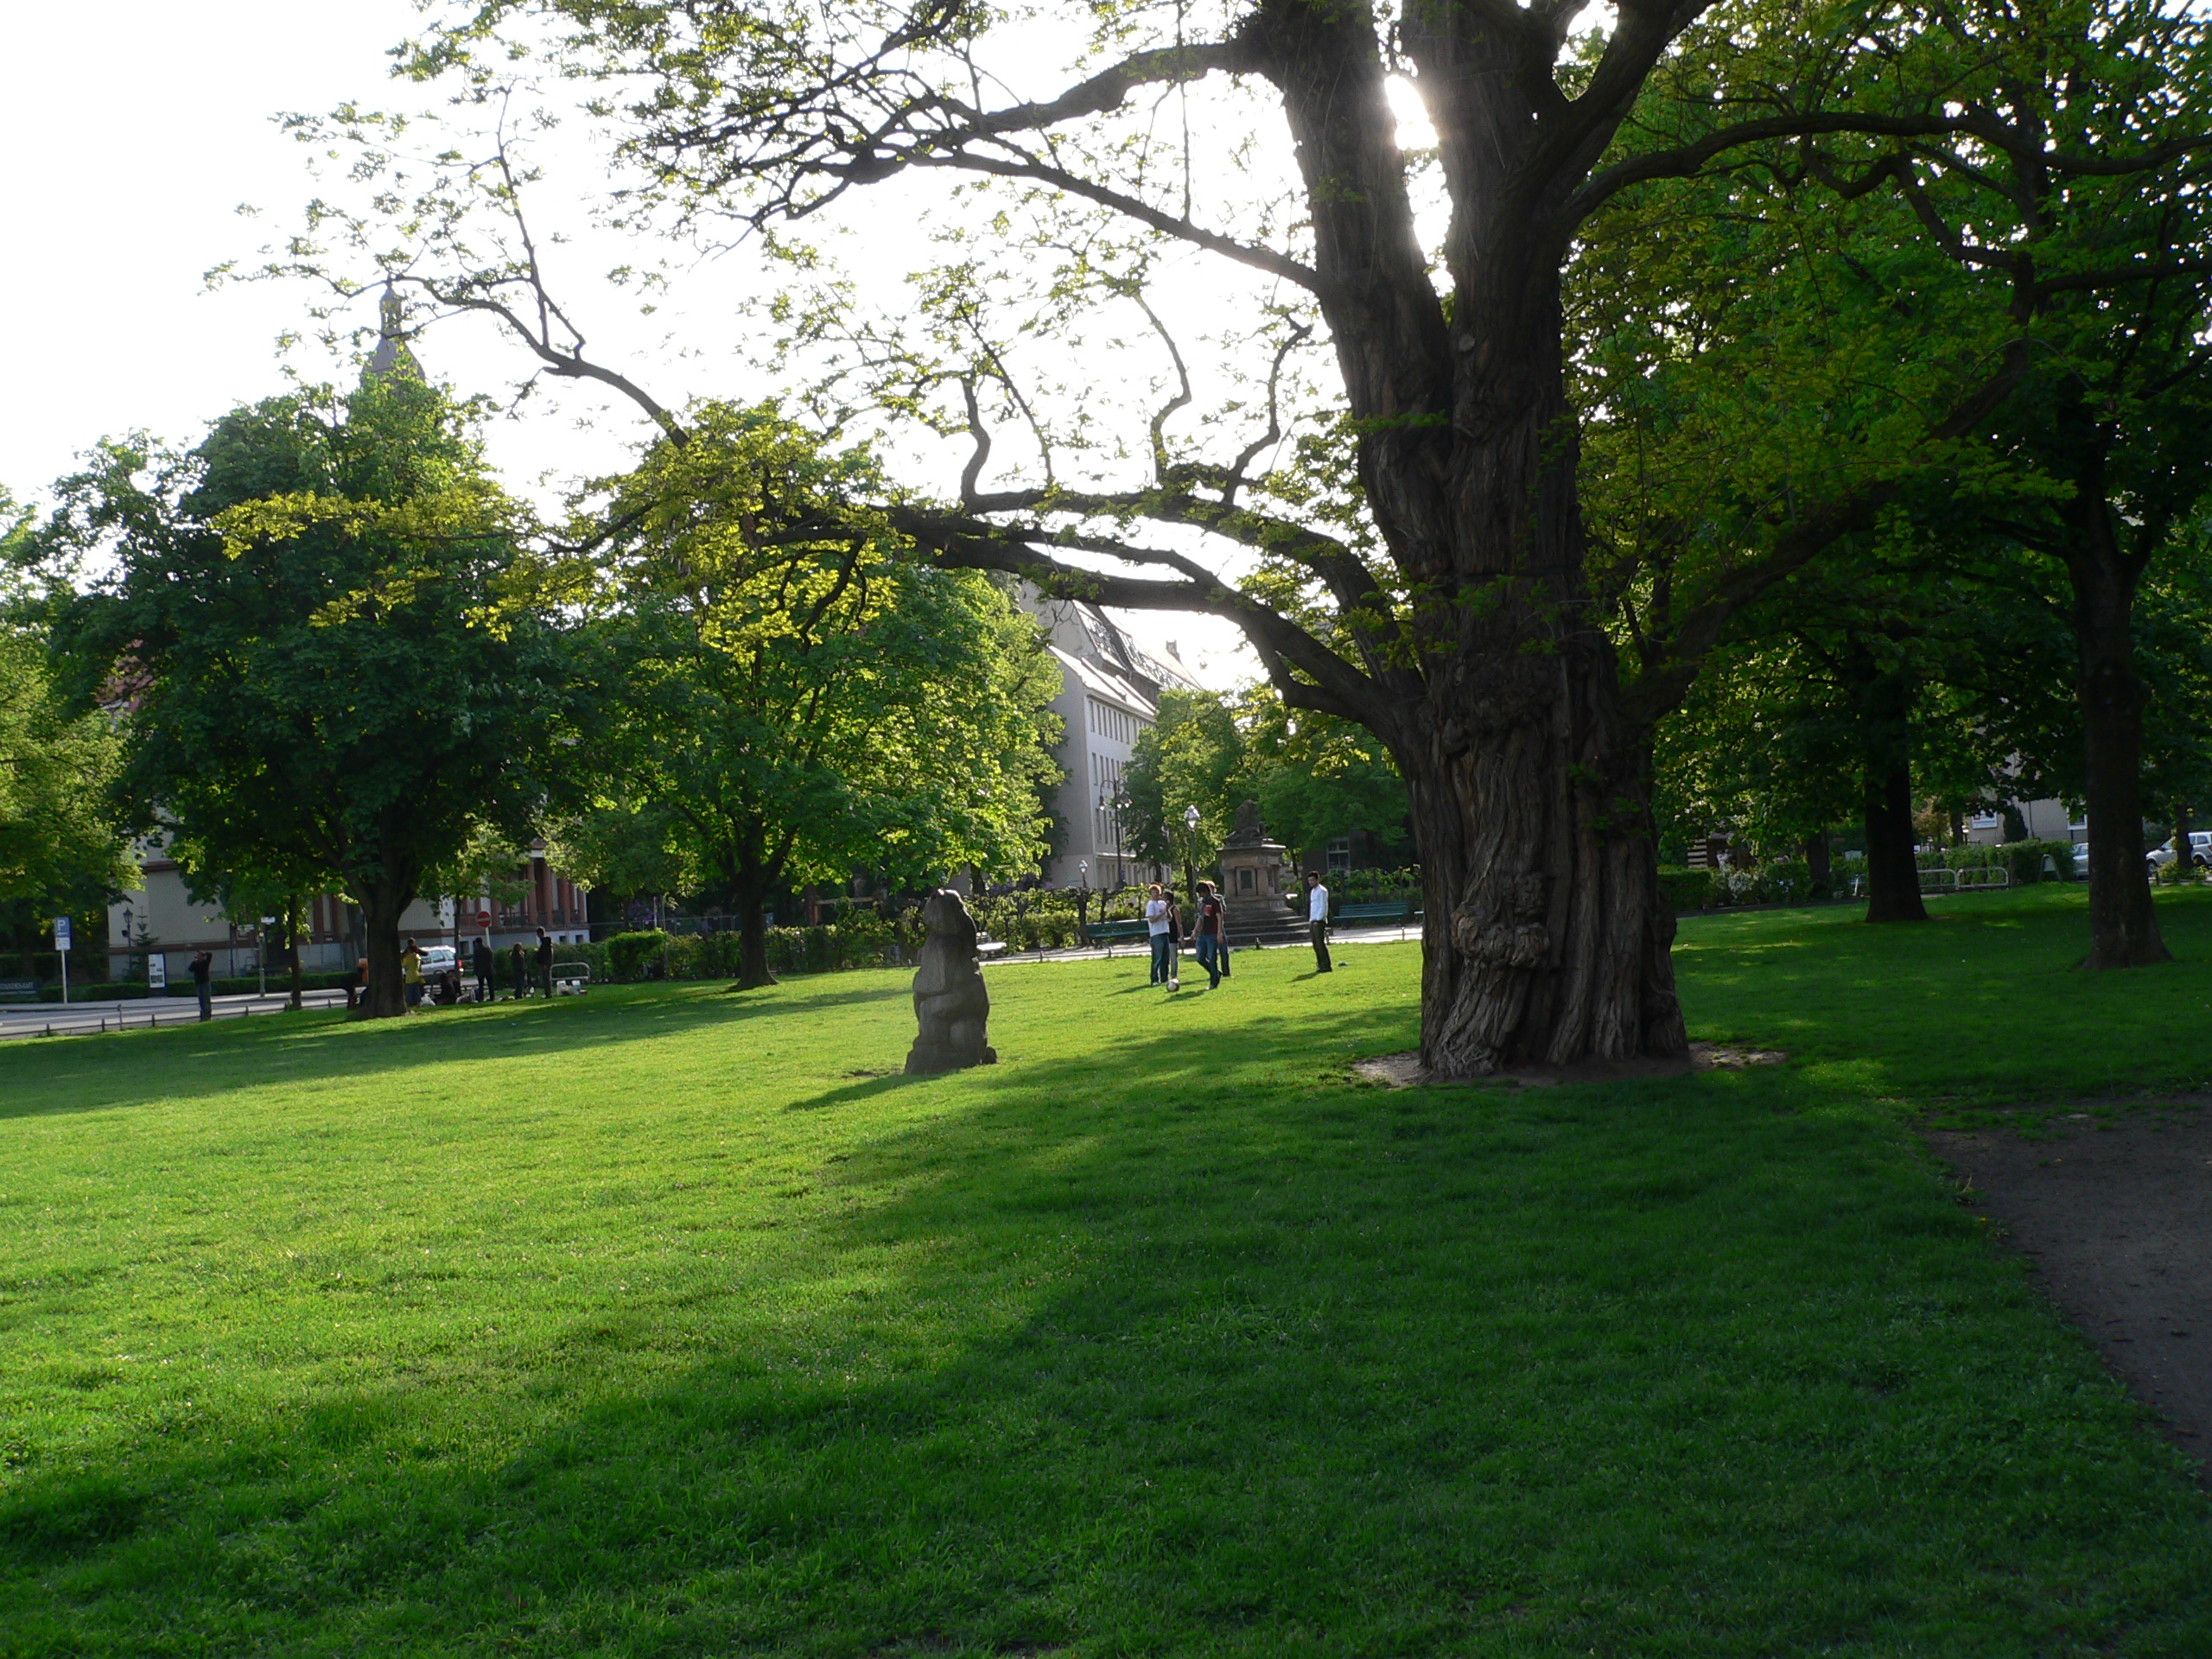
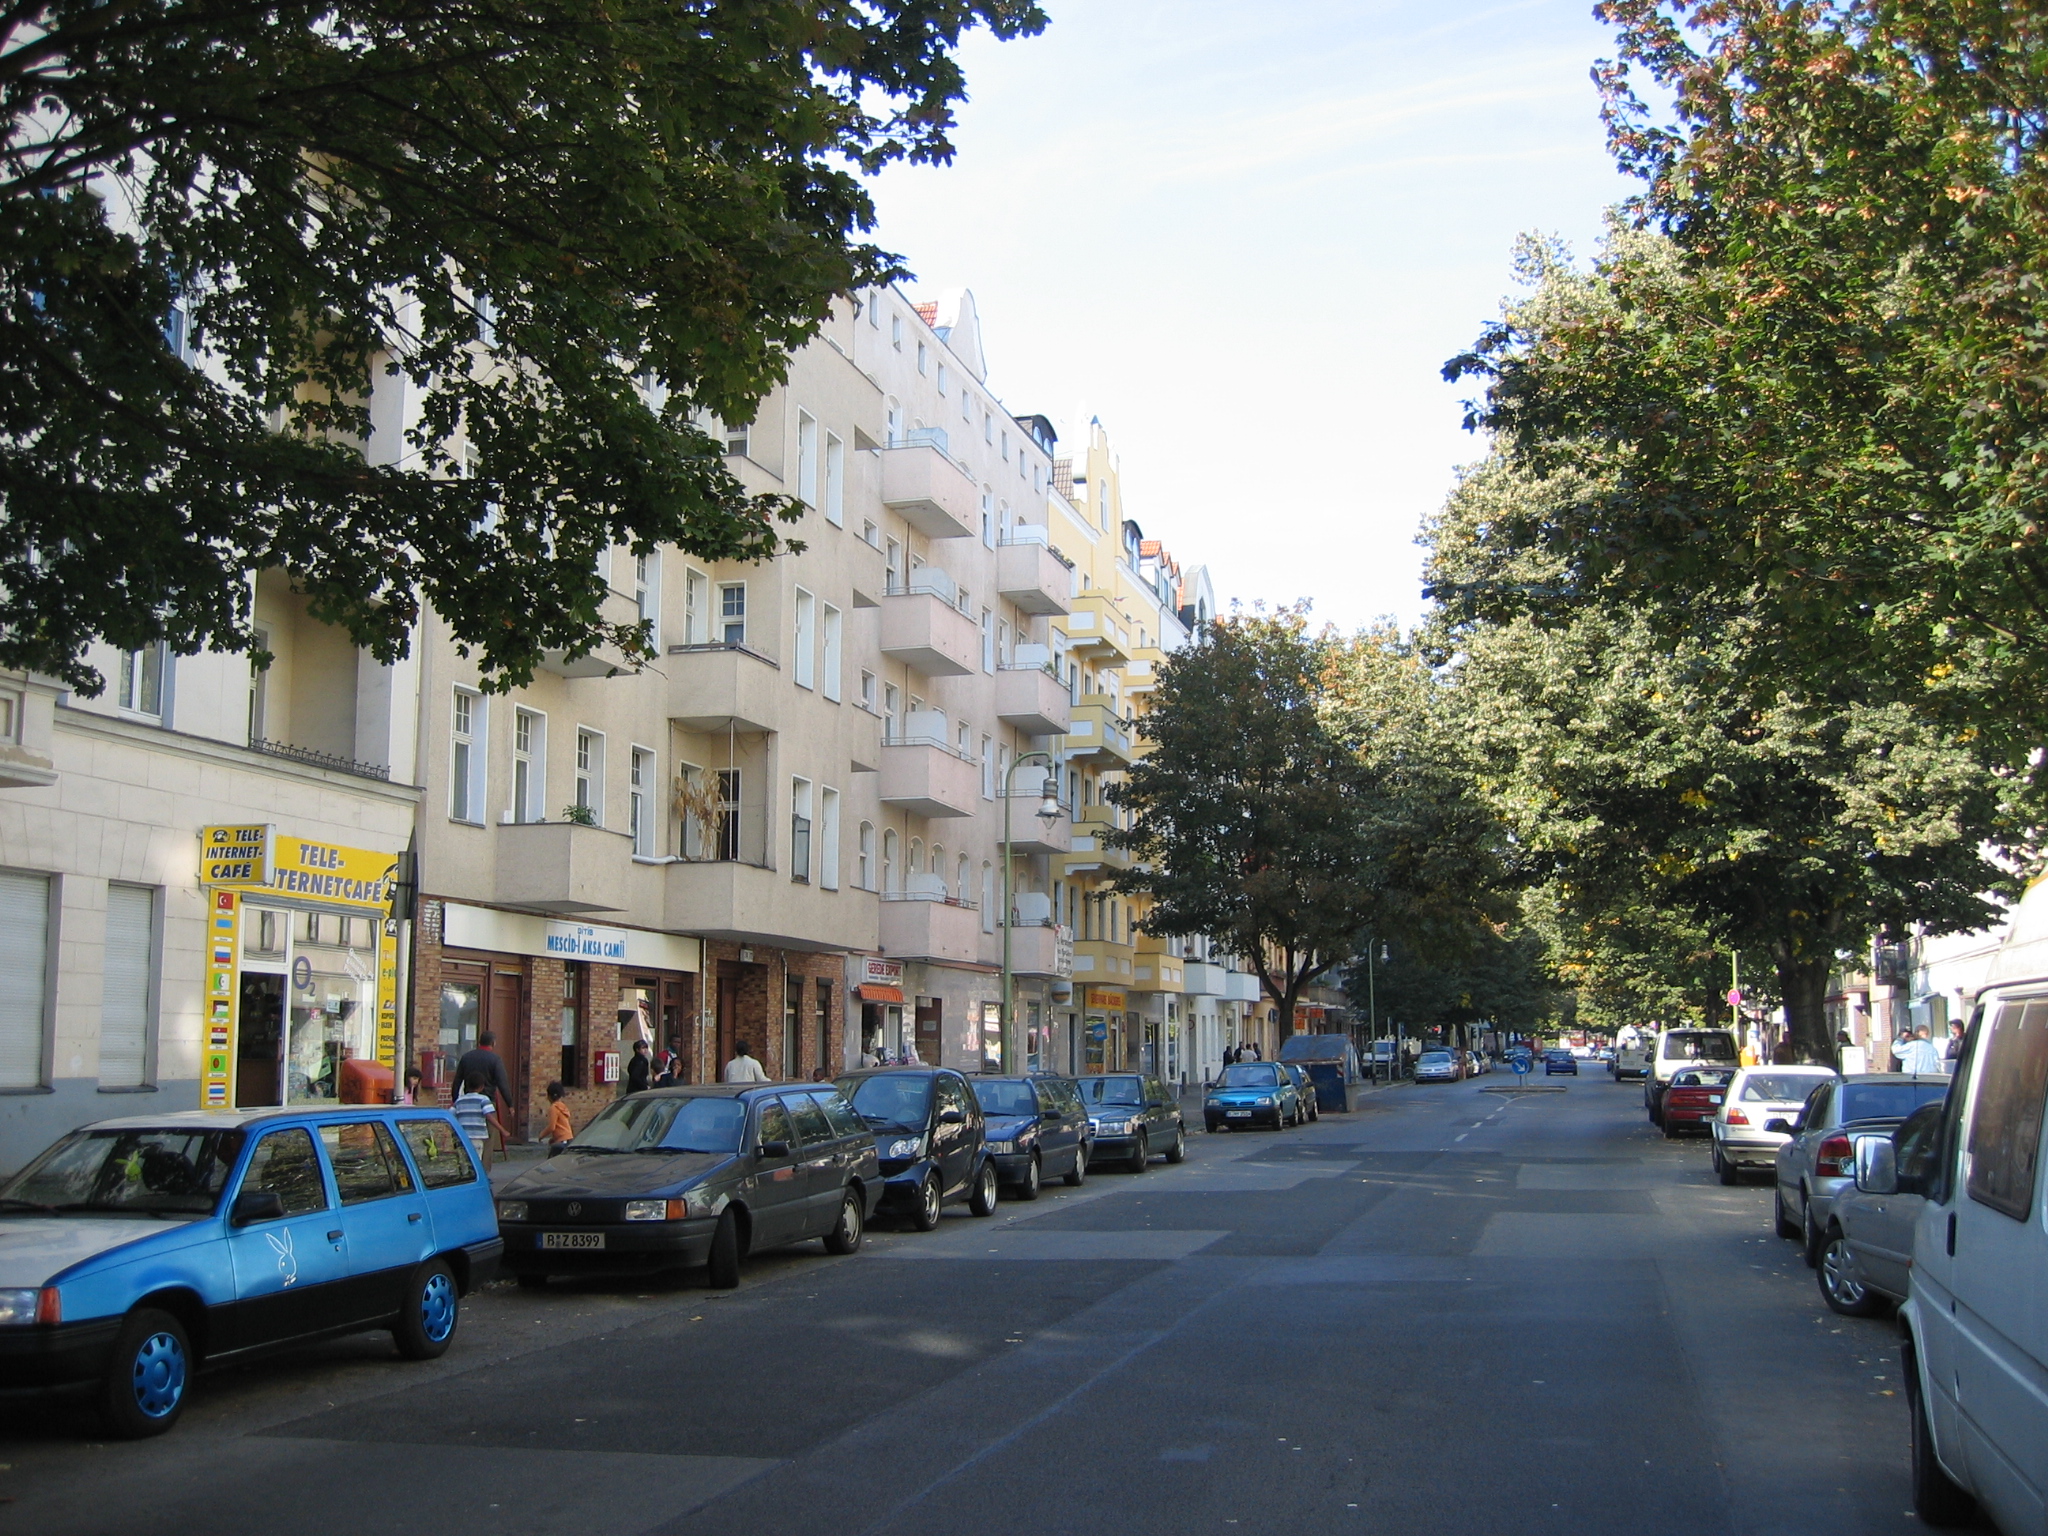
Kladow
Kladow is the southernmost district of the Borough of Spandau in Berlin.
Kladow Wikipedia Page

About Our Data
The data on this page is estimated using a number of publicly available tools and resources. It is provided without warranty, and could contain inaccuracies. Use at your own risk.