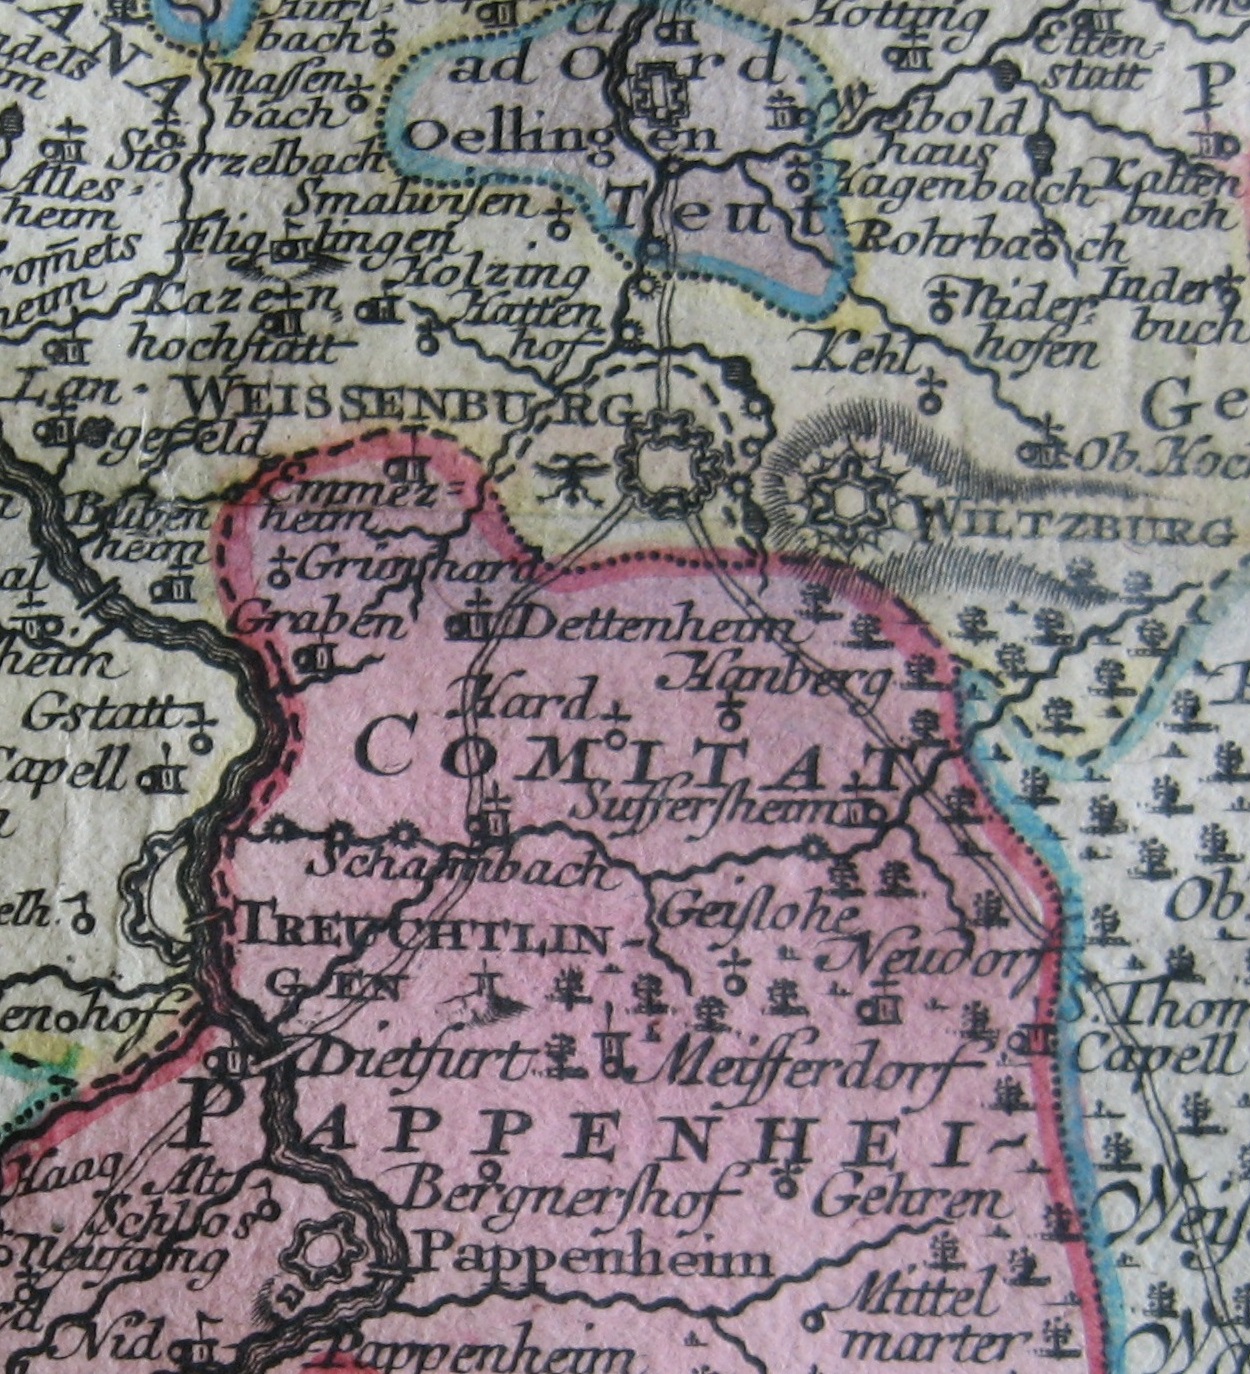
Map of Rögling
Interactive Map
Rögling Population
Years 1975 to 2020
| Data | 1975 | 1990 | 2000 | 2015 | 2020 |
|---|---|---|---|---|---|
| Population | 523 | 524 | 526 | 494 | 480 |
| Population Density | 1,046 / km² | 1,048 / km² | 1,052 / km² | 988 / km² | 960 / km² |
Sources: JRC (European Commission's Joint Research Centre) work on the GHS built-up grid
Rögling Population change from 2000 to 2015
Decrease of 6.1% from year 2000 to 2015
| Location | Change since 1975 | Change since 1990 | Change since 2000 |
|---|---|---|---|
| Rögling | -5.5% | -5.7% | -6.1% |
| Bavaria | +18.8% | +11.8% | +3.9% |
| Germany | +2.6% | +2.2% | -1.5% |
Sources: JRC (European Commission's Joint Research Centre) work on the GHS built-up grid
Rögling Population Density
Population Density: 960 / km²
| Location | Population | Area | Density |
|---|---|---|---|
| Rögling | 480 | 0.5 km² | 960 / km² |
| Bavaria | 12.7 million | 70,548.3 km² | 180 / km² |
| Germany | 80.7 million | 358,179.8 km² | 225 / km² |
Sources: JRC (European Commission's Joint Research Centre) work on the GHS built-up grid
Rögling Historical and Projected Population
Estimated Population from 0 to 2100
Sources:
- JRC (European Commission's Joint Research Centre) work on the GHS built-up grid
- CIESIN (Center for International Earth Science Information Network)
- [Link] Klein Goldewijk, K., Beusen, A., Doelman, J., and Stehfest, E.: Anthropogenic land use estimates for the Holocene – HYDE 3.2, Earth Syst. Sci. Data, 9, 927–953, https://doi.org/10.5194/essd-9-927-2017, 2017.
Human Development Index (HDI)
Statistic composite index of life expectancy, education, and per capita income.
Source: [Link] Kummu, M., Taka, M. &Guillaume, J. Gridded global datasets for Gross Domestic Product and Human Development Index over 1990–2015. Sci Data 5, 180004 (2018) doi:10.1038/sdata.2018.4
Rögling CO2 Emissions
Carbon Dioxide (CO2) Emissions Per Capita in Tonnes Per Year
| Location | CO2 Emissions | CO2 Emissions Per Capita | CO2 Emissions Intensity |
|---|---|---|---|
| Rögling | 4,740 tn | 9.87 tn | 9,479.2 tons/km² |
| Bavaria | 124,278,407 tn | 9.81 tn | 1,761.6 tons/km² |
| Germany | 755,339,039 tn | 9.36 tn | 2,108.8 tons/km² |
Sources: [Link] Moran, D., Kanemoto K; Jiborn, M., Wood, R., Többen, J., and Seto, K.C. (2018) Carbon footprints of 13,000 cities. Environmental Research Letters DOI: 10.1088/1748-9326/aac72a
Rögling CO2 Emissions
| 2013 CO2 emissions (tonnes/year) | 4,740 tn |
| 2013 CO2 emissions (tonnes/year) per capita | 9.87 tn |
| 2013 CO2 emissions intensity (tonnes/km²/year) | 9,479.2 tons/km² |
Natural Hazards Risk
Relative risk out of 10
| Hazard | Risk Level |
|---|---|
| Flood | High (9) |
| Earthquake | Medium (4) |
* Risk, particularly concerning flood or landslide, may not be for the entire area.
Sources:
- Dilley, M., R.S. Chen, U. Deichmann, A.L. Lerner-Lam, M. Arnold, J. Agwe, P. Buys, O. Kjekstad, B. Lyon, and G. Yetman. 2005. Natural Disaster Hotspots: A Global Risk Analysis. Washington, D.C.: World Bank. https://doi.org/10.1596/0-8213-5930-4.
- Center for Hazards and Risk Research - CHRR - Columbia University, Center for International Earth Science Information Network - CIESIN - Columbia University. 2005. Global Flood Hazard Frequency and Distribution. Palisades, NY: NASA Socioeconomic Data and Applications Center (SEDAC). https://doi.org/10.7927/H4668B3D.
- Center for Hazards and Risk Research - CHRR - Columbia University, Center for International Earth Science Information Network - CIESIN - Columbia University. 2005. Global Earthquake Hazard Distribution - Peak Ground Acceleration. Palisades, NY: NASA Socioeconomic Data and Applications Center (SEDAC). https://doi.org/10.7927/H4BZ63ZS.
Recent Nearby Earthquakes
Magnitude 3.0 and greater
| Date▼ | Time↕ | Magnitude↕ | Distance↕ | Depth↕ | Location↕ | Link |
|---|---|---|---|---|---|---|
| 10/21/97 | 4:44 PM | 4.1 | 98.5 km | 20,000 m | Germany | usgs.gov |
| 2/14/96 | 4:27 PM | 3 | 42.4 km | 10,000 m | Germany | usgs.gov |
| 5/17/82 | 5:30 PM | 4.3 | 66.4 km | 33,000 m | Germany | usgs.gov |
| 8/2/81 | 2:15 PM | 3.1 | 44.6 km | 10,000 m | Germany | usgs.gov |
Source: U.S. Geological Survey (USGS)
Rögling
Rögling is a municipality in the district of Donau-Ries in Bavaria in Germany.
Rögling Wikipedia Page

About Our Data
The data on this page is estimated using a number of publicly available tools and resources. It is provided without warranty, and could contain inaccuracies. Use at your own risk.