Staaken Facts
| Area | 10.9 km² |
| Population | 37,675 |
| Male Population | 18,329 (48.6%) |
| Female Population | 19,346 (51.4%) |
| Population change (1975 to 2020) | +17.8% |
| Population change (2000 to 2020) | +7.1% |
| Median Age | 43 years (Male: 42, Female: 44.1) |
| Neighborhoods | Staaken |
| Local Time | |
| Timezone | Central European Summer Time |
| Lat & Lng | 52.53661, 13.15057 |
| Postal Codes | 13591 |
Map of Staaken
Interactive Map
Staaken Population
Years 1975 to 2020
| Data | 1975 | 1990 | 2000 | 2015 | 2020 |
|---|---|---|---|---|---|
| Population | 31,978 | 32,423 | 35,180 | 37,063 | 37,675 |
| Population Density | 2,923.7 / km² | 2,964.4 / km² | 3,216.5 / km² | 3,388.6 / km² | 3,444.6 / km² |
Sources: JRC (European Commission's Joint Research Centre) work on the GHS built-up grid
Staaken Population change from 2000 to 2015
Increase of 5.4% from year 2000 to 2015
| Location | Change since 1975 | Change since 1990 | Change since 2000 |
|---|---|---|---|
| Staaken | +15.9% | +14.3% | +5.4% |
| Berlin | +8% | +4.8% | -0.3% |
| Germany | +2.6% | +2.2% | -1.5% |
Sources: JRC (European Commission's Joint Research Centre) work on the GHS built-up grid
Staaken Median Age
Median Age: 43 years
| Location | Median Age | Median Age (Female) | Median Age (Male) |
|---|---|---|---|
| Staaken | 43 yrs | 44.1 yrs | 42 yrs |
| Berlin | 43 yrs | 44.1 yrs | 42 yrs |
| Germany | 44.8 yrs | 46 yrs | 43.6 yrs |
Sources: CIESIN (Center for International Earth Science Information Network)
Staaken Population Density
Population Density: 3,445 / km²
| Location | Population | Area | Density |
|---|---|---|---|
| Staaken | 37,675 | 10.9 km² | 3,445 / km² |
| Berlin | 3.3 million | 891.8 km² | 3,754 / km² |
| Germany | 80.7 million | 358,179.8 km² | 225 / km² |
Sources: JRC (European Commission's Joint Research Centre) work on the GHS built-up grid
Staaken Historical and Projected Population
Estimated Population from 1730 to 2100
Sources:
- JRC (European Commission's Joint Research Centre) work on the GHS built-up grid
- CIESIN (Center for International Earth Science Information Network)
- [Link] Klein Goldewijk, K., Beusen, A., Doelman, J., and Stehfest, E.: Anthropogenic land use estimates for the Holocene – HYDE 3.2, Earth Syst. Sci. Data, 9, 927–953, https://doi.org/10.5194/essd-9-927-2017, 2017.
Human Development Index (HDI)
Statistic composite index of life expectancy, education, and per capita income.
Source: [Link] Kummu, M., Taka, M. &Guillaume, J. Gridded global datasets for Gross Domestic Product and Human Development Index over 1990–2015. Sci Data 5, 180004 (2018) doi:10.1038/sdata.2018.4
Staaken CO2 Emissions
Carbon Dioxide (CO2) Emissions Per Capita in Tonnes Per Year
| Location | CO2 Emissions | CO2 Emissions Per Capita | CO2 Emissions Intensity |
|---|---|---|---|
| Staaken | 394,800 tn | 10.48 tn | 36,096 tons/km² |
| Berlin | 34,879,850 tn | 10.42 tn | 39,110.2 tons/km² |
| Germany | 755,339,039 tn | 9.36 tn | 2,108.8 tons/km² |
Sources: [Link] Moran, D., Kanemoto K; Jiborn, M., Wood, R., Többen, J., and Seto, K.C. (2018) Carbon footprints of 13,000 cities. Environmental Research Letters DOI: 10.1088/1748-9326/aac72a
Staaken CO2 Emissions
| 2013 CO2 emissions (tonnes/year) | 394,800 tn |
| 2013 CO2 emissions (tonnes/year) per capita | 10.48 tn |
| 2013 CO2 emissions intensity (tonnes/km²/year) | 36,096 tons/km² |
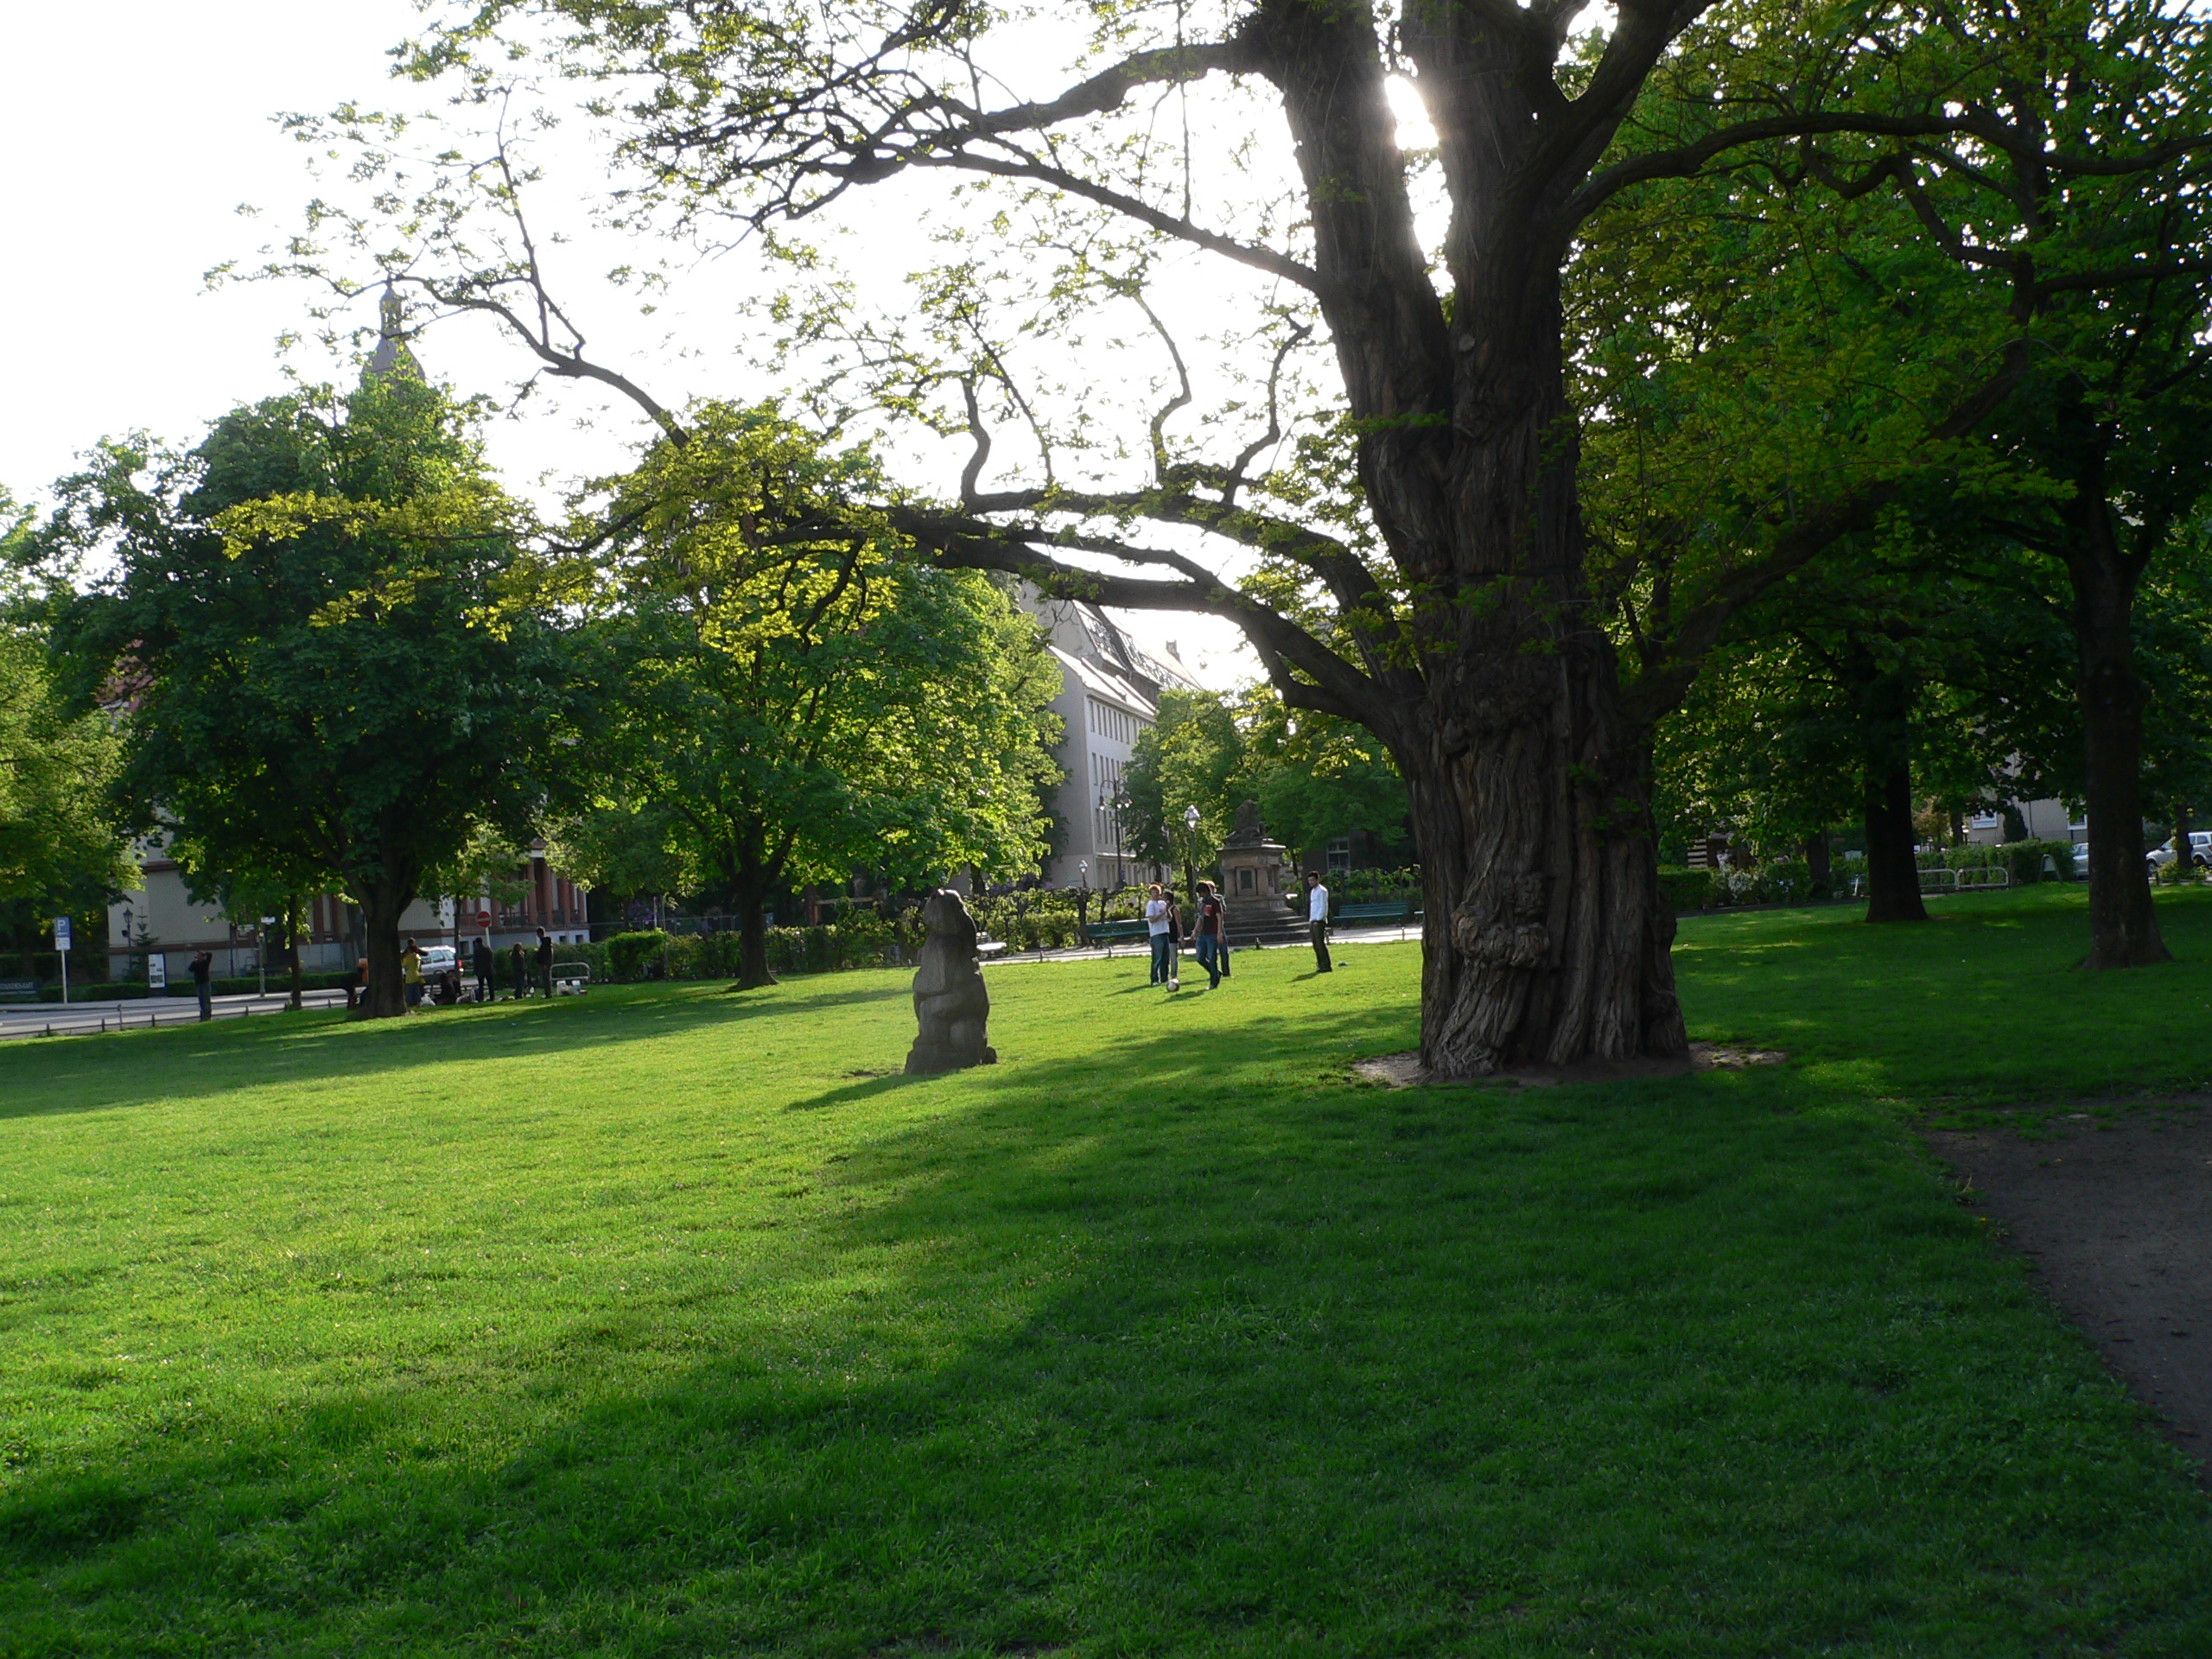
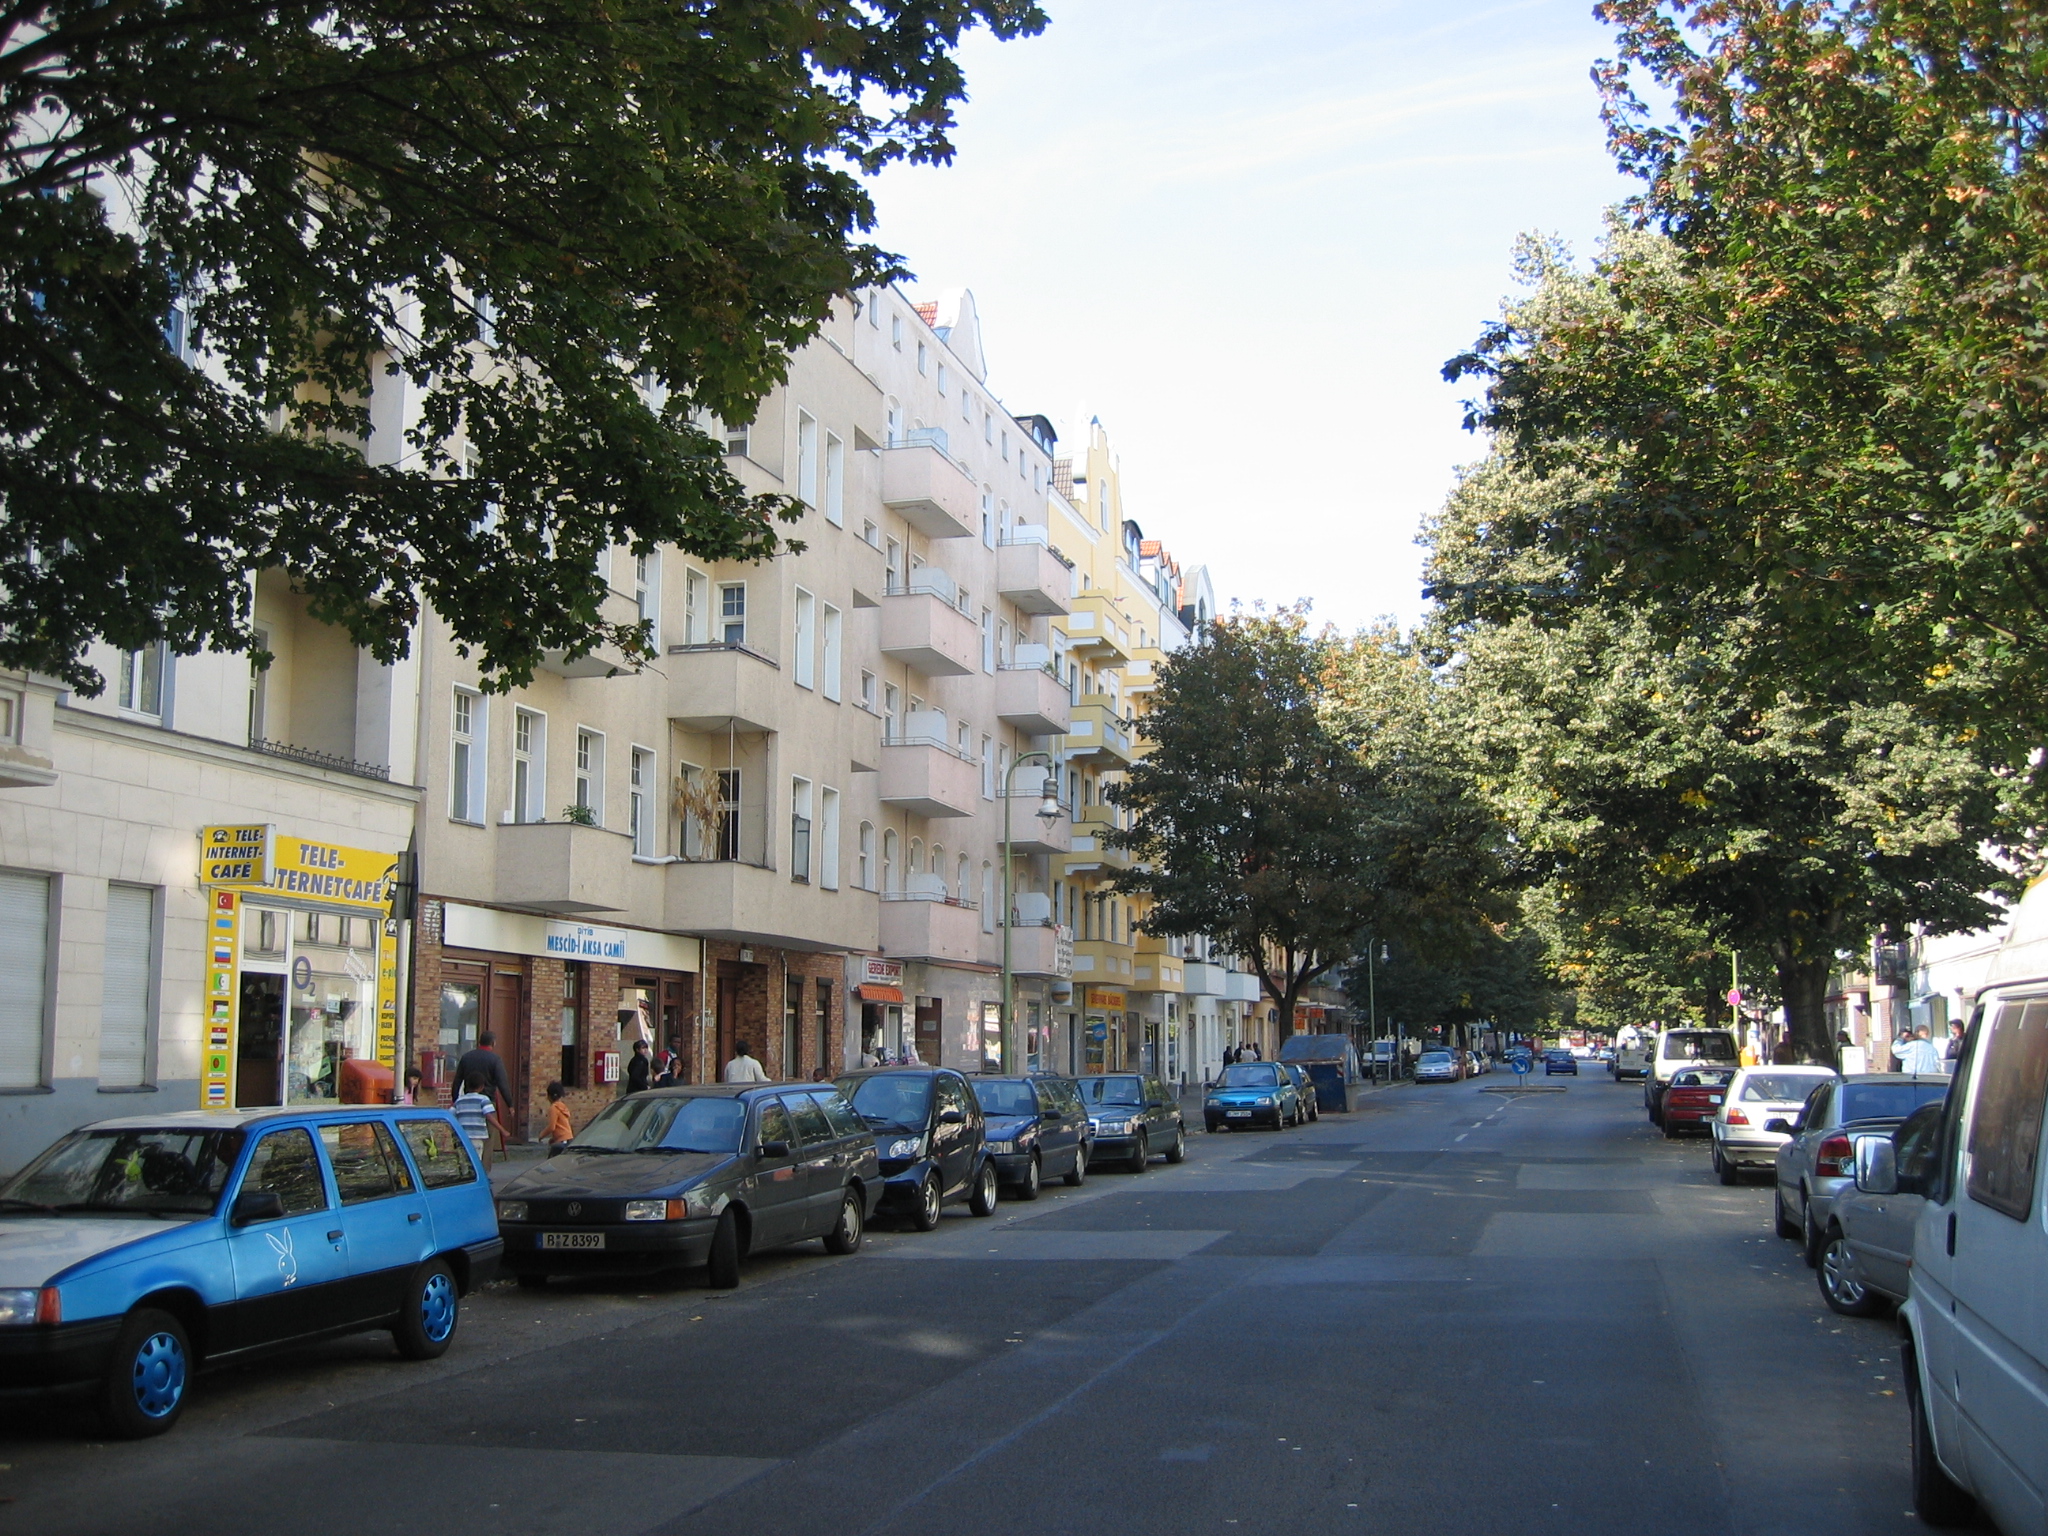
Staaken
Staaken is a locality at the western rim of Berlin within the borough of Spandau.
Staaken Wikipedia Page

About Our Data
The data on this page is estimated using a number of publicly available tools and resources. It is provided without warranty, and could contain inaccuracies. Use at your own risk.